Yeast Extract Market Size and Share Forecast Outlook 2025 to 2035

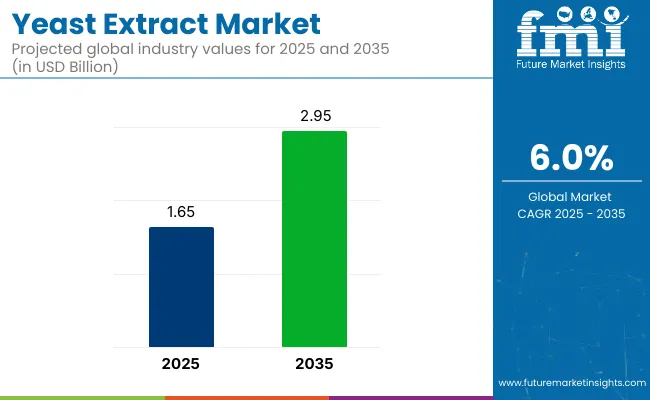
The global yeast extract market is expected to grow from USD 1.64 billion in 2025 to USD 2.94 billion by 2035, reflecting a CAGR of 6.0%. The yeast extract market is growing steadily due to increasing consumer preference for natural and clean-label ingredients.

Quick Stats of Yeast Extract Market

  • Market Value (2025): USD 1.64 billion
  • Forecast Value (2035): USD 2.94 billion
  • Forecast CAGR: 6.0%
  • End Use Leader in 2025: Food & Beverages (38.2% market share)
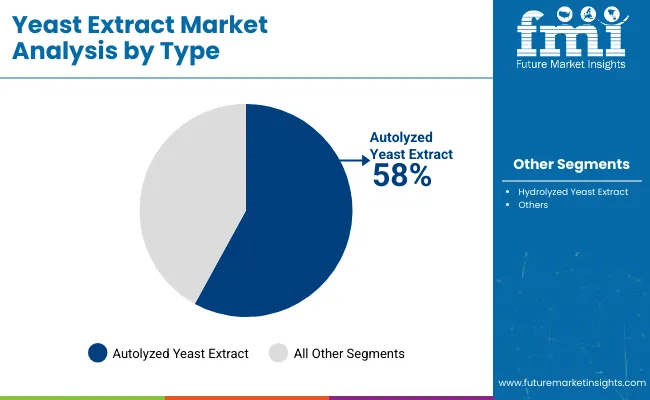
  • Top Type Segment: Autolyzed (58% share)
  • Key Growth Region: Asia Pacific (China fastest-growing market with a 6.7% CAGR)
Attributes Description
Estimated Yeast Extract Market Size (2025E) USD 1.64 billion
Projected Yeast Extract Market Value (2035F) USD 2.94 billion
Value-based CAGR (2025 to 2035) 6.0%

Many people today look for food products without artificial additives or synthetic flavor enhancers. Yeast extract, being a natural ingredient derived from yeast, fits this demand perfectly. It serves as a natural flavor booster and is often used as an alternative to monosodium glutamate. This shift toward cleaner, more transparent ingredient lists is pushing food manufacturers to incorporate yeast extract in their recipes.

Another important factor driving the market is the health and nutritional benefits of yeast extract. It is rich in essential nutrients such as B vitamins, amino acids, and minerals, which appeal to health-conscious consumers. As people become more aware of the importance of nutrition in their diets, ingredients that offer both flavor and health benefits gain popularity. Yeast extract is widely used in functional foods and dietary supplements, which further supports its growing demand.

By end use, the food and beverages segment dominates with a 38.2% value share in 2025, while by type, the autolyzed segment contributes 58% share. The expanding food and beverage industry also plays a significant role in the growth of the yeast extract market. Busy lifestyles have increased the demand for convenient products like ready-to-eat meals, soups, sauces, and snacks, where yeast extract is often used to enhance taste.

Additionally, the rise of plant-based and vegan diets has boosted the use of yeast extract as a flavor enhancer in vegan cheese, spreads, and other alternatives. Improvements in extraction and fermentation technologies have made production more efficient and cost-effective, allowing for wider applications across various sectors such as pharmaceuticals and biotechnology. These combined factors contribute to the steady expansion of the yeast extract market worldwide

Semi-Annual Market Update

The table below illustrates the semi-annual CAGR performance for the base year (2024) and the current year (2025). This analysis highlights the shifts in growth patterns, aiding stakeholders in understanding market dynamics over time. H1 represents January to June, and H2 spans July to December.

Particular Value CAGR
H1(2024 to 2034) 5.8%
H2(2024 to 2034) 6.0%
H1(2025 to 2035) 6.0%
H2(2025 to 2035) 6.2%

From 2025 to 2035, the yeast extract market is expected to demonstrate consistent growth. H1 2025 to 2035 shows a CAGR of 6.0%, reflecting steady demand across food, feed, and pharmaceutical applications.

In H2, the growth rate slightly increases to 6.2%, attributed to seasonal demand spikes and new product launches in emerging markets. A similar pattern is observed from 2024 to 2034, with a gradual increase in growth rates across both halves of the year, signifying expanding applications and geographical penetration.

Analyzing Yeast Extract Market by Top Investment Segments

The yeast extract market is segmented by type into autolyzed and hydrolyzed. By grade, it is divided into food grade and feed grade. The form segment includes powder, liquid, paste, and flakes. By end use, the market covers food & beverages, animal feed, cosmetics & personal care, pharmaceuticals, and others. Regionally, the market is segmented into North America, Latin America, Western Europe, Eastern Europe, Balkans & Baltic, Russia & Belarus, Central Asia, East Asia, South Asia & Pacific, and Middle East & Africa.

By Type, Autolyzed Segment Dominates with 58% Share

The autolyzed segment accounts for 58% share. Autolyzed yeast extracts are widely preferred because they offer a natural and clean-label alternative to artificial flavor enhancers. The autolysis process breaks down yeast cells gently without using harsh chemicals, preserving the natural nutrients and creating a rich umami flavor that enhances the taste of various food products.

This makes them especially popular in soups, sauces, snacks, and ready-to-eat meals. Additionally, autolyzed yeast extracts are cost-effective, versatile, and easy to incorporate into formulations. Their ability to improve flavor while meeting consumer demand for natural ingredients drives their widespread preference in the market.

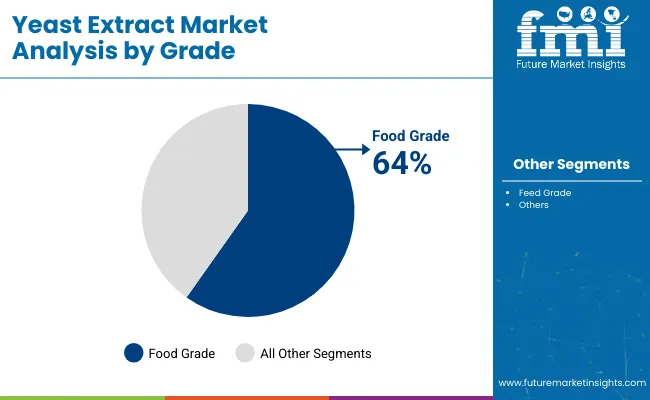
By Grade, Food Grade Segment Leads with 64% Share

In the yeast extract market, the food grade segment holds the leading share. This dominance is driven by the high demand for yeast extracts in the food and beverage industry, where they are widely used as natural flavor enhancers and nutritional additives.

Food grade yeast extracts are valued for their ability to improve taste and provide essential nutrients such as amino acids and B vitamins, aligning with consumer preferences for clean-label and natural ingredients. Additionally, the expansion of convenience foods, snacks, and processed products fuels the need for food grade yeast extract. In contrast, the feed grade segment, while important for animal nutrition, represents a smaller portion of the overall market. This segment holds 64% share.

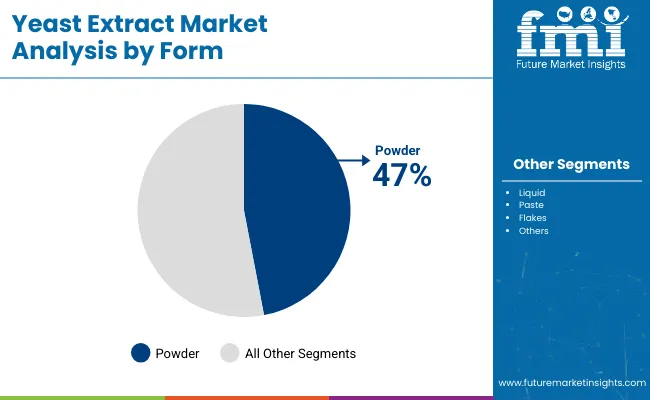
By Form, Powder Segment Dominates with 47% Share

In the yeast extract market, the powder form holds the leading share of 47%. Powdered yeast extract is preferred because of its longer shelf life, ease of storage, and convenient handling during food processing. It can be easily blended into a wide range of food products such as soups, sauces, snacks, and ready-to-eat meals without affecting texture.

The powder form also allows for consistent flavor distribution and dosage control, making it highly favored by manufacturers. Additionally, powdered yeast extract is cost-effective to transport and package, contributing to its widespread adoption compared to liquid, paste, or flakes forms.

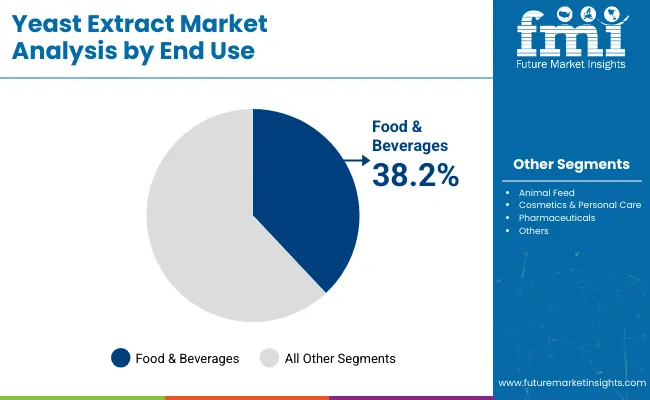
In terms of End Use, Food & Beverages Segment Holds 38.2% Share

The food & beverages segment accounts for 38.2% share. Yeast extracts are widely used in the food and beverages industry because they act as natural flavor enhancers, adding a rich umami taste that improves the overall flavor profile of many products. They help reduce the need for artificial additives and monosodium glutamate, which aligns with the growing consumer demand for clean-label and natural ingredients.

Yeast extracts also provide nutritional benefits by contributing essential amino acids, vitamins, and minerals. Their versatility allows them to be used in a variety of products such as soups, sauces, snacks, processed meats, and ready-to-eat meals, making them a valuable ingredient for food manufacturers looking to enhance taste and nutritional value.

Key Industry Highlights

Increased Demand for Clean-Label and Natural Ingredients

The consumers around the world are converting their diets into crypto clean-label products that contain no artificial additives. Yeast extract, which is made through the natural process of fermentation, reflects the same tendency. Besides flavoring it, it is a good nutritional source, so it is widely used in plant-based food and processed foods.

The greater use of clean-label laws in the European and North American regions is a further driver of this demand. In addition to this, its use as a salt reduction agent in the formulation of food is also in line with the preferences of health-oriented consumers.

Growing Applications in Plant-Based and Functional Foods

The phenomenon of the plant-based and vegan movement has created an area for yeast-extract as a full industrial production of yeast extract moves toward its public promotion of being eco-friendly and social responsible. Being the most used ingredient in plant-based meat and dairy substitutes, yeast extract gives the dish the missing flavor.

The umami richness of it usually vector the deficit flavor that the products made from the plants have. Moreover, the inclusion of yeast extract which is B-vitamin content and also has a positive effect on the immune system has been a result of the changing trends in functional foods and beverages.

Technological Advancements in Fermentation Processes

The use of novel fermentation techniques to generate S.aureus is achieved by increasing the yield, purity, and sustainability of the process. For instance, new technology platforms such as mycelial have turned out to be the means to an end of the desired objective. The methods are used in the lab before approval for industrial application, and OHSMS standards are strictly followed.

Hence, no disturbance to the atmosphere is caused and will promote the company’s green goals. These improvements have made it possible for producers to comply with the environmental favour by meeting the increased demand.

Market Concentration

The yeast extract market is categorized into three tiers based on market presence and revenue:

Tier 1: Global distribution networks and advanced R&D capabilities are the contributing reasons of the market dominance by companies like Angel Yeast Co., Lesaffre Group, and Lallemand Inc. These companies allocate a large portion of their resource to the product development that is based on innovation and are bаsed on clean-label and functional yeast extracts. They vouch for the food manufacturers to develop the necessary product collaboratively, thus, continuing to be the priority ferment supplier of multi-national companies.

Tier 2: Ohly GmbH and Bio springer are mдd-sized mid-sized companies that are more interested in regional markets and niche applications. These companies have an additional focus on sustainability and organic certification, which are very attractive to health-oriented customers. Their flexible business model is allowing them to change and update their product line according to the new market trends quickly.

Tier 3: Small enterprises like Titan Biotech and the specialty yeast section of Kerry Group, tackle the issue of cost by offering efficient schemes and they are mostly concerned with localized issues. Though their visibility in the market is less, these companies still have a good impact on the demands and preferences of the regional consumers and serve the local industries.

Country-Wise Insights

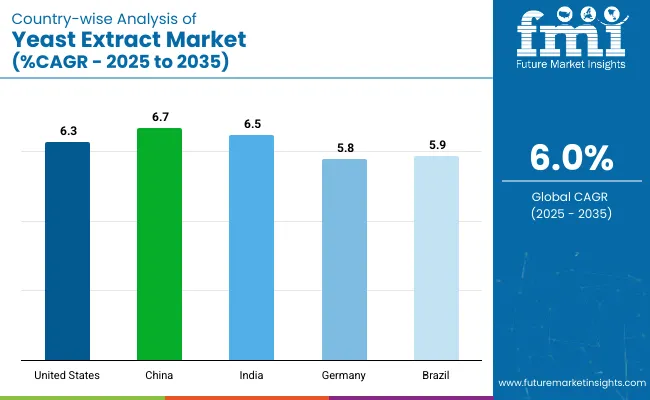
The yeast extract market is expected to grow steadily across these countries from 2025 to 2035, with China leading at a CAGR of 6.7%, driven by expanding food processing industries and rising demand for natural flavor enhancers. India follows closely at 6.5%, supported by growing urbanization and increased consumption of processed foods.

The United States shows strong growth at 6.3%, reflecting innovation and health-conscious consumer trends. Brazil and Germany have slightly lower growth rates of 5.9% and 5.8%, respectively, due to market maturity but continue to expand through product diversification. Overall, these markets demonstrate healthy and balanced growth trajectories.

Countries CAGR 2025 to 2035
United States 6.3%
China 6.7%
India 6.5%
Germany 5.8%
Brazil 5.9%

United States: Strong Demand for Functional Foods

The United States is in charge of the yeast extract market which experiences simultaneous boost by the fast-growing clean-label and natural products sector. Yeast extract is predominantly used in processed foods and functional beverages, which boosts both flavor and nutritional value. In addition to this, there is a positive correlation between the consumers quest for a healthier lifestyle and the trend of less sodium in food formulations, which, in turn, has increased the demand for yeast extract as a natural salt-reducing agent.

Apart from that, its use in plant-based products and health supplements is also being noticed, making a substantial impact on market growth. The ever-increasing consumers' knowledge of the health advantages of yeast extract, and, at the same time, its application in different culinary practices, put it at the top of the list of manufacturers to choose it. As the market shifts, the emphasis on natural components and functional foods will help yeast extract thrive in the USA.

China: Expanding Applications in Pharmaceuticals and Food

The yeast extract market in China is greatly gaining momentum, as it serves a broad range of sectors including food, pharmaceuticals, and traditional medicine. The mushrooming request for superior tastes and quick foods fuels the growth of the food category, as shoppers look for delicious and health-conscious ingredients.

Yeast extract is specifically acknowledged for its savory flavor and accordingly, it is frequently processed in several foods. Furthermore, the pharmaceutical industry resorts to yeast extract for its immune stimulation and nutritional properties, especially in food supplements.

This advance is in line with the expanding consumer emphasis on health and wellness. On top of that, government's favor for domestic production adds to this pace, making it evident that China plays an important part in the business of yeast extract. Correspondingly, as both food and pharmaceutical sectors keep changing, it is anticipated that the yeast extract demand will rise mirroring the general fears about health and the emerging food formulations.

India: Rising Adoption of Plant-Based Diets

The demand for the yeast extract in India is at an all-time high, thanks to the rapid adoption of plant-based diets among the country's growing population of vegetarians and vegans. As the consumers change to these diets, the use of yeast extract in micronutrient-fortified plant-based protein products and health supplements becomes more critical righting the nutritional deficiencies connected with such diets.

This natural umami flavor mainly brings to the table the deliciousness of various plant-based dishes for consumers. The initiative for creating more clean-label products and natural ingredients comes with a boom in the food industry in India, where health-conscious individuals are increasingly opting for high-quality and transparent products.

The demand is being met by local suppliers through the introduction of different lines of yeast extract-based products that are in line with the company's vision of modern food consumption. The plant-based meal trend is clearly on the rise, and thereby yeast extract is likely to be an essential component of the food scenario in India that will involve health and the environment as well.

Germany: High Demand for Natural Ingredients

The yeast extract marketplace in Germany is running high hand, thanks to the country's strict environmental sustainability and clean-label policy, which has created a new breed of consumers who are more concerned about ingredient safety and environmental impact.

Yeast extract contributes to the organic and healthful foods sector, which in turn, both increases the flavor and nutrient content. Currently, the rigorous regulatory framework the nation is operating under is making it so that only the very best ingredients are being used, which is why health-conscious consumers want more.

Besides, yeast extract rates are utilized in the cosmetic and pharmaceutical industries, and that is an essential point of Germany's powerful growth trend. With the population becoming more and more aware of the natural components, the need for yeast extract is supposed to expand.

The local manufacturers are quickly coming out without the need for yeast extract, the demand for which is being actively met by innovation, growth, and product trends in health and sustainability. This confluence of factors has made Germany a pivotal player in the yeast extract market shaping the transitions towards naturally-derived and functionally-enhanced food components.

Brazil: Growing Use in Animal Feed

The increment in the use of yeast extract in animal feeds has become a prevailing trend in Brazil blessed with extensive use in the equipment yogurt due to its high protein and a range of other functional advantages. Yeast extract not only helps in the preservation of gut health but also increases livestock masses by reducing wastage and also increasing productivity.

Additionally, the step by step transformation of farming towards a more eco-friendly route has been a common theme through the decades, and yeast extract falls into that equation. Likewise, the livestock producers' increase in knowledge about animal nutrition and husbandry also persuades to more utilization of yeast extract in Brazil.

This is due to the fact that the ingredient can inspire the digestion of feed and enhance their taste, which are probably the most important aspects of nutrition in animals. With the anticipated expansion of the agricultural sector ahead, the market for yeast extract in feeding animals is meant to be larger as an example of a broader move towards sustainability and nutrition ideals.

Leading Yeast Extract Suppliers

The yeast extracts market is moderately consolidated, with a few major players holding significant market share and influencing global trends. Companies like Lesaffre Group, Angel Yeast Co. Ltd, and Lallemand Inc. lead with extensive production capabilities, global distribution, and continuous innovation. Kerry Group and Cargill Incorporated add strong R&D and flavor enhancement expertise, catering to both food and nutritional segments.

Biospringer and its subsidiary Bio Springer S.A. specialize in natural flavor solutions, enhancing their position in the clean-label movement. Synergy Flavors and Thai Foods International Co. serve regional and niche markets. While large players dominate, the presence of regional competitors ensures some level of fragmentation, maintaining a competitive and innovation-driven market landscape.

Leading Brands

  • Lesaffre Group
  • Kerry Group
  • Angel Yeast
  • Lallemand Inc.
  • Biospringer
  • Synergy Flavors
  • Thai Foods International Co.
  • Associated British Foods
  • Chr. Hansen
  • Leiber
  • Novozymes

Report Scope Table - Yeast Extract Market

Report Attributes Details
Current Total Market Size (2025) USD 1.64 billion
Projected Market Size (2035) USD 2.94 billion
CAGR (2025 to 2035) 6.0%
Base Year for Estimation 2024
Historical Period 2020 to 2024
Projections Period 2025 to 2035
Quantitative Units USD billion for value; Thousand metric tons for volume
Product Types Analyzed (Segment 1) Autolyzed Yeast Extract, Hydrolyzed Yeast Extract
Grades Analyzed (Segment 2) Food Grade, Feed Grade
Forms Analyzed (Segment 3) Powder, Liquid, Paste, Flakes
End Uses Analyzed (Segment 4) Food & Beverages, Animal Feed, Cosmetics & Personal Care, Pharmaceuticals, Others
Regions Covered North America; Latin America; Western Europe; Eastern Europe; South Asia and Pacific; East Asia; Middle East & Africa
Countries Covered United States, Canada, Germany, United Kingdom, France, Japan, China, India, South Korea, Brazil
Key Players Influencing the Market Lesaffre Group, Kerry Group, Angel Yeast, Lallemand Inc., Biospringer, Synergy Flavors, Thai Foods International Co., Associated British Foods, Chr. Hansen, Leiber, Novozymes
Additional Attributes Growing clean label demand, Functional nutrition in processed food, Rising application in animal and pharma sectors
Customization and Pricing Customization and Pricing Available on Request

Key Segmentation

By Type:

  • Autolyzed Yeast Extract
  • Hydrolyzed Yeast Extract

By Grade:

  • Food Grade
  • Feed Grade

By Form:

  • Powder
  • Liquid
  • Paste
  • Flakes

By End Use:

  • Food & Beverages
  • Animal Feed
  • Cosmetics & Personal Care
  • Pharmaceuticals
  • Others

By Region:

  • North America
  • Europe
  • Asia-Pacific
  • Latin America
  • Middle East & Africa

Table of Content

  1. Executive Summary
  2. Industry Introduction, Including Taxonomy and Market Definition
  3. Market Trends and Success Factors, Including Macro-economic Factors, Market Dynamics, and Recent Industry Developments
  4. Global Market Demand Analysis 2020 to 2024 and Forecast 2025 to 2035, including Historical Analysis and Future Projections
  5. Pricing Analysis
  6. Global Market Analysis 2020 to 2024 and Forecast 2025 to 2035
    • Type
    • Grade
    • Form
    • End Use
    • Region
  7. Global Market Analysis 2020 to 2024 and Forecast 2025 to 2035, by Type
    • Autolyzed
    • Hydrolyzed
  8. Global Market Analysis 2020 to 2024 and Forecast 2025 to 2035, by Grade
    • Food Grade
    • Feed Grade
  9. Global Market Analysis 2020 to 2024 and Forecast 2025 to 2035, by Form
    • Powder
    • Liquid
    • Paste
    • Flakes
  10. Global Market Analysis 2020 to 2024 and Forecast 2025 to 2035, by End Use
    • Food & Beverages
    • Animal Feed
    • Cosmetics & Personal Care
    • Pharmaceuticals
    • Others
  11. Global Market Analysis 2020 to 2024 and Forecast 2025 to 2035, by Region
    • North America
    • Latin America
    • Western Europe
    • Eastern Europe
    • Balkans & Baltic
    • Russia & Belarus
    • Central Asia
    • East Asia
    • South Asia & Pacific
    • Middle East & Africa
  12. North America Sales Analysis 2020 to 2024 and Forecast 2025 to 2035, by Key Segments and Countries
  13. Latin America Sales Analysis 2020 to 2024 and Forecast 2025 to 2035, by Key Segments and Countries
  14. Western Europe Sales Analysis 2020 to 2024 and Forecast 2025 to 2035, by Key Segments and Countries
  15. Eastern Europe Sales Analysis 2020 to 2024 and Forecast 2025 to 2035, by Key Segments and Countries
  16. Balkans & Baltic Sales Analysis 2020 to 2024 and Forecast 2025 to 2035, by Key Segments and Countries
  17. Russia & Belarus Sales Analysis 2020 to 2024 and Forecast 2025 to 2035, by Key Segments and Countries
  18. Central Asia Sales Analysis 2020 to 2024 and Forecast 2025 to 2035, by Key Segments and Countries
  19. East Asia Sales Analysis 2020 to 2024 and Forecast 2025 to 2035, by Key Segments and Countries
  20. South Asia & Pacific Sales Analysis 2020 to 2024 and Forecast 2025 to 2035, by Key Segments and Countries
  21. Middle East & Africa Sales Analysis 2020 to 2024 and Forecast 2025 to 2035, by Key Segments and Countries
  22. Sales Forecast 2025 to 2035 by Type, Grade, Form, and End Use for 30 Countries
  23. Competition Outlook, including Market Structure Analysis, Company Share Analysis by Key Players, and Competition Dashboard
  24. Company Profile
    • Lesaffre Group
    • Kerry Group
    • Angel Yeast
    • Lallemand Inc.
    • Biospringer
    • Synergy Flavors
    • Thai Foods International Co.
    • Bio Springer S.A.
    • Angel Yeast Co. Ltd
    • Cargill Incorporated
    • Others

List of Tables

  • Table 1: Global Market Value (USD Million) Forecast by Region, 2020 to 2035
  • Table 2: Global Market Volume (Tons) Forecast by Region, 2020 to 2035
  • Table 3: Global Market Value (USD Million) Forecast by Grade, 2020 to 2035
  • Table 4: Global Market Volume (Tons) Forecast by Grade, 2020 to 2035
  • Table 5: Global Market Value (USD Million) Forecast by End Use, 2020 to 2035
  • Table 6: Global Market Volume (Tons) Forecast by End Use, 2020 to 2035
  • Table 7: North America Market Value (USD Million) Forecast by Country, 2020 to 2035
  • Table 8: North America Market Volume (Tons) Forecast by Country, 2020 to 2035
  • Table 9: North America Market Value (USD Million) Forecast by Grade, 2020 to 2035
  • Table 10: North America Market Volume (Tons) Forecast by Grade, 2020 to 2035
  • Table 11: North America Market Value (USD Million) Forecast by End Use, 2020 to 2035
  • Table 12: North America Market Volume (Tons) Forecast by End Use, 2020 to 2035
  • Table 13: Latin America Market Value (USD Million) Forecast by Country, 2020 to 2035
  • Table 14: Latin America Market Volume (Tons) Forecast by Country, 2020 to 2035
  • Table 15: Latin America Market Value (USD Million) Forecast by Grade, 2020 to 2035
  • Table 16: Latin America Market Volume (Tons) Forecast by Grade, 2020 to 2035
  • Table 17: Latin America Market Value (USD Million) Forecast by End Use, 2020 to 2035
  • Table 18: Latin America Market Volume (Tons) Forecast by End Use, 2020 to 2035
  • Table 19: Western Europe Market Value (USD Million) Forecast by Country, 2020 to 2035
  • Table 20: Western Europe Market Volume (Tons) Forecast by Country, 2020 to 2035
  • Table 21: Western Europe Market Value (USD Million) Forecast by Grade, 2020 to 2035
  • Table 22: Western Europe Market Volume (Tons) Forecast by Grade, 2020 to 2035
  • Table 23: Western Europe Market Value (USD Million) Forecast by End Use, 2020 to 2035
  • Table 24: Western Europe Market Volume (Tons) Forecast by End Use, 2020 to 2035
  • Table 25: Eastern Europe Market Value (USD Million) Forecast by Country, 2020 to 2035
  • Table 26: Eastern Europe Market Volume (Tons) Forecast by Country, 2020 to 2035
  • Table 27: Eastern Europe Market Value (USD Million) Forecast by Grade, 2020 to 2035
  • Table 28: Eastern Europe Market Volume (Tons) Forecast by Grade, 2020 to 2035
  • Table 29: Eastern Europe Market Value (USD Million) Forecast by End Use, 2020 to 2035
  • Table 30: Eastern Europe Market Volume (Tons) Forecast by End Use, 2020 to 2035
  • Table 31: South Asia and Pacific Market Value (USD Million) Forecast by Country, 2020 to 2035
  • Table 32: South Asia and Pacific Market Volume (Tons) Forecast by Country, 2020 to 2035
  • Table 33: South Asia and Pacific Market Value (USD Million) Forecast by Grade, 2020 to 2035
  • Table 34: South Asia and Pacific Market Volume (Tons) Forecast by Grade, 2020 to 2035
  • Table 35: South Asia and Pacific Market Value (USD Million) Forecast by End Use, 2020 to 2035
  • Table 36: South Asia and Pacific Market Volume (Tons) Forecast by End Use, 2020 to 2035
  • Table 37: East Asia Market Value (USD Million) Forecast by Country, 2020 to 2035
  • Table 38: East Asia Market Volume (Tons) Forecast by Country, 2020 to 2035
  • Table 39: East Asia Market Value (USD Million) Forecast by Grade, 2020 to 2035
  • Table 40: East Asia Market Volume (Tons) Forecast by Grade, 2020 to 2035
  • Table 41: East Asia Market Value (USD Million) Forecast by End Use, 2020 to 2035
  • Table 42: East Asia Market Volume (Tons) Forecast by End Use, 2020 to 2035
  • Table 43: Middle East and Africa Market Value (USD Million) Forecast by Country, 2020 to 2035
  • Table 44: Middle East and Africa Market Volume (Tons) Forecast by Country, 2020 to 2035
  • Table 45: Middle East and Africa Market Value (USD Million) Forecast by Grade, 2020 to 2035
  • Table 46: Middle East and Africa Market Volume (Tons) Forecast by Grade, 2020 to 2035
  • Table 47: Middle East and Africa Market Value (USD Million) Forecast by End Use, 2020 to 2035
  • Table 48: Middle East and Africa Market Volume (Tons) Forecast by End Use, 2020 to 2035

List of Figures

  • Figure 1: Global Market Value (USD Million) by Grade, 2025 to 2035
  • Figure 2: Global Market Value (USD Million) by End Use, 2025 to 2035
  • Figure 3: Global Market Value (USD Million) by Region, 2025 to 2035
  • Figure 4: Global Market Value (USD Million) Analysis by Region, 2020 to 2035
  • Figure 5: Global Market Volume (Tons) Analysis by Region, 2020 to 2035
  • Figure 6: Global Market Value Share (%) and BPS Analysis by Region, 2025 to 2035
  • Figure 7: Global Market Y-o-Y Growth (%) Projections by Region, 2025 to 2035
  • Figure 8: Global Market Value (USD Million) Analysis by Grade, 2020 to 2035
  • Figure 9: Global Market Volume (Tons) Analysis by Grade, 2020 to 2035
  • Figure 10: Global Market Value Share (%) and BPS Analysis by Grade, 2025 to 2035
  • Figure 11: Global Market Y-o-Y Growth (%) Projections by Grade, 2025 to 2035
  • Figure 12: Global Market Value (USD Million) Analysis by End Use, 2020 to 2035
  • Figure 13: Global Market Volume (Tons) Analysis by End Use, 2020 to 2035
  • Figure 14: Global Market Value Share (%) and BPS Analysis by End Use, 2025 to 2035
  • Figure 15: Global Market Y-o-Y Growth (%) Projections by End Use, 2025 to 2035
  • Figure 16: Global Market Attractiveness by Grade, 2025 to 2035
  • Figure 17: Global Market Attractiveness by End Use, 2025 to 2035
  • Figure 18: Global Market Attractiveness by Region, 2025 to 2035
  • Figure 19: North America Market Value (USD Million) by Grade, 2025 to 2035
  • Figure 20: North America Market Value (USD Million) by End Use, 2025 to 2035
  • Figure 21: North America Market Value (USD Million) by Country, 2025 to 2035
  • Figure 22: North America Market Value (USD Million) Analysis by Country, 2020 to 2035
  • Figure 23: North America Market Volume (Tons) Analysis by Country, 2020 to 2035
  • Figure 24: North America Market Value Share (%) and BPS Analysis by Country, 2025 to 2035
  • Figure 25: North America Market Y-o-Y Growth (%) Projections by Country, 2025 to 2035
  • Figure 26: North America Market Value (USD Million) Analysis by Grade, 2020 to 2035
  • Figure 27: North America Market Volume (Tons) Analysis by Grade, 2020 to 2035
  • Figure 28: North America Market Value Share (%) and BPS Analysis by Grade, 2025 to 2035
  • Figure 29: North America Market Y-o-Y Growth (%) Projections by Grade, 2025 to 2035
  • Figure 30: North America Market Value (USD Million) Analysis by End Use, 2020 to 2035
  • Figure 31: North America Market Volume (Tons) Analysis by End Use, 2020 to 2035
  • Figure 32: North America Market Value Share (%) and BPS Analysis by End Use, 2025 to 2035
  • Figure 33: North America Market Y-o-Y Growth (%) Projections by End Use, 2025 to 2035
  • Figure 34: North America Market Attractiveness by Grade, 2025 to 2035
  • Figure 35: North America Market Attractiveness by End Use, 2025 to 2035
  • Figure 36: North America Market Attractiveness by Country, 2025 to 2035
  • Figure 37: Latin America Market Value (USD Million) by Grade, 2025 to 2035
  • Figure 38: Latin America Market Value (USD Million) by End Use, 2025 to 2035
  • Figure 39: Latin America Market Value (USD Million) by Country, 2025 to 2035
  • Figure 40: Latin America Market Value (USD Million) Analysis by Country, 2020 to 2035
  • Figure 41: Latin America Market Volume (Tons) Analysis by Country, 2020 to 2035
  • Figure 42: Latin America Market Value Share (%) and BPS Analysis by Country, 2025 to 2035
  • Figure 43: Latin America Market Y-o-Y Growth (%) Projections by Country, 2025 to 2035
  • Figure 44: Latin America Market Value (USD Million) Analysis by Grade, 2020 to 2035
  • Figure 45: Latin America Market Volume (Tons) Analysis by Grade, 2020 to 2035
  • Figure 46: Latin America Market Value Share (%) and BPS Analysis by Grade, 2025 to 2035
  • Figure 47: Latin America Market Y-o-Y Growth (%) Projections by Grade, 2025 to 2035
  • Figure 48: Latin America Market Value (USD Million) Analysis by End Use, 2020 to 2035
  • Figure 49: Latin America Market Volume (Tons) Analysis by End Use, 2020 to 2035
  • Figure 50: Latin America Market Value Share (%) and BPS Analysis by End Use, 2025 to 2035
  • Figure 51: Latin America Market Y-o-Y Growth (%) Projections by End Use, 2025 to 2035
  • Figure 52: Latin America Market Attractiveness by Grade, 2025 to 2035
  • Figure 53: Latin America Market Attractiveness by End Use, 2025 to 2035
  • Figure 54: Latin America Market Attractiveness by Country, 2025 to 2035
  • Figure 55: Western Europe Market Value (USD Million) by Grade, 2025 to 2035
  • Figure 56: Western Europe Market Value (USD Million) by End Use, 2025 to 2035
  • Figure 57: Western Europe Market Value (USD Million) by Country, 2025 to 2035
  • Figure 58: Western Europe Market Value (USD Million) Analysis by Country, 2020 to 2035
  • Figure 59: Western Europe Market Volume (Tons) Analysis by Country, 2020 to 2035
  • Figure 60: Western Europe Market Value Share (%) and BPS Analysis by Country, 2025 to 2035
  • Figure 61: Western Europe Market Y-o-Y Growth (%) Projections by Country, 2025 to 2035
  • Figure 62: Western Europe Market Value (USD Million) Analysis by Grade, 2020 to 2035
  • Figure 63: Western Europe Market Volume (Tons) Analysis by Grade, 2020 to 2035
  • Figure 64: Western Europe Market Value Share (%) and BPS Analysis by Grade, 2025 to 2035
  • Figure 65: Western Europe Market Y-o-Y Growth (%) Projections by Grade, 2025 to 2035
  • Figure 66: Western Europe Market Value (USD Million) Analysis by End Use, 2020 to 2035
  • Figure 67: Western Europe Market Volume (Tons) Analysis by End Use, 2020 to 2035
  • Figure 68: Western Europe Market Value Share (%) and BPS Analysis by End Use, 2025 to 2035
  • Figure 69: Western Europe Market Y-o-Y Growth (%) Projections by End Use, 2025 to 2035
  • Figure 70: Western Europe Market Attractiveness by Grade, 2025 to 2035
  • Figure 71: Western Europe Market Attractiveness by End Use, 2025 to 2035
  • Figure 72: Western Europe Market Attractiveness by Country, 2025 to 2035
  • Figure 73: Eastern Europe Market Value (USD Million) by Grade, 2025 to 2035
  • Figure 74: Eastern Europe Market Value (USD Million) by End Use, 2025 to 2035
  • Figure 75: Eastern Europe Market Value (USD Million) by Country, 2025 to 2035
  • Figure 76: Eastern Europe Market Value (USD Million) Analysis by Country, 2020 to 2035
  • Figure 77: Eastern Europe Market Volume (Tons) Analysis by Country, 2020 to 2035
  • Figure 78: Eastern Europe Market Value Share (%) and BPS Analysis by Country, 2025 to 2035
  • Figure 79: Eastern Europe Market Y-o-Y Growth (%) Projections by Country, 2025 to 2035
  • Figure 80: Eastern Europe Market Value (USD Million) Analysis by Grade, 2020 to 2035
  • Figure 81: Eastern Europe Market Volume (Tons) Analysis by Grade, 2020 to 2035
  • Figure 82: Eastern Europe Market Value Share (%) and BPS Analysis by Grade, 2025 to 2035
  • Figure 83: Eastern Europe Market Y-o-Y Growth (%) Projections by Grade, 2025 to 2035
  • Figure 84: Eastern Europe Market Value (USD Million) Analysis by End Use, 2020 to 2035
  • Figure 85: Eastern Europe Market Volume (Tons) Analysis by End Use, 2020 to 2035
  • Figure 86: Eastern Europe Market Value Share (%) and BPS Analysis by End Use, 2025 to 2035
  • Figure 87: Eastern Europe Market Y-o-Y Growth (%) Projections by End Use, 2025 to 2035
  • Figure 88: Eastern Europe Market Attractiveness by Grade, 2025 to 2035
  • Figure 89: Eastern Europe Market Attractiveness by End Use, 2025 to 2035
  • Figure 90: Eastern Europe Market Attractiveness by Country, 2025 to 2035
  • Figure 91: South Asia and Pacific Market Value (USD Million) by Grade, 2025 to 2035
  • Figure 92: South Asia and Pacific Market Value (USD Million) by End Use, 2025 to 2035
  • Figure 93: South Asia and Pacific Market Value (USD Million) by Country, 2025 to 2035
  • Figure 94: South Asia and Pacific Market Value (USD Million) Analysis by Country, 2020 to 2035
  • Figure 95: South Asia and Pacific Market Volume (Tons) Analysis by Country, 2020 to 2035
  • Figure 96: South Asia and Pacific Market Value Share (%) and BPS Analysis by Country, 2025 to 2035
  • Figure 97: South Asia and Pacific Market Y-o-Y Growth (%) Projections by Country, 2025 to 2035
  • Figure 98: South Asia and Pacific Market Value (USD Million) Analysis by Grade, 2020 to 2035
  • Figure 99: South Asia and Pacific Market Volume (Tons) Analysis by Grade, 2020 to 2035
  • Figure 100: South Asia and Pacific Market Value Share (%) and BPS Analysis by Grade, 2025 to 2035
  • Figure 101: South Asia and Pacific Market Y-o-Y Growth (%) Projections by Grade, 2025 to 2035
  • Figure 102: South Asia and Pacific Market Value (USD Million) Analysis by End Use, 2020 to 2035
  • Figure 103: South Asia and Pacific Market Volume (Tons) Analysis by End Use, 2020 to 2035
  • Figure 104: South Asia and Pacific Market Value Share (%) and BPS Analysis by End Use, 2025 to 2035
  • Figure 105: South Asia and Pacific Market Y-o-Y Growth (%) Projections by End Use, 2025 to 2035
  • Figure 106: South Asia and Pacific Market Attractiveness by Grade, 2025 to 2035
  • Figure 107: South Asia and Pacific Market Attractiveness by End Use, 2025 to 2035
  • Figure 108: South Asia and Pacific Market Attractiveness by Country, 2025 to 2035
  • Figure 109: East Asia Market Value (USD Million) by Grade, 2025 to 2035
  • Figure 110: East Asia Market Value (USD Million) by End Use, 2025 to 2035
  • Figure 111: East Asia Market Value (USD Million) by Country, 2025 to 2035
  • Figure 112: East Asia Market Value (USD Million) Analysis by Country, 2020 to 2035
  • Figure 113: East Asia Market Volume (Tons) Analysis by Country, 2020 to 2035
  • Figure 114: East Asia Market Value Share (%) and BPS Analysis by Country, 2025 to 2035
  • Figure 115: East Asia Market Y-o-Y Growth (%) Projections by Country, 2025 to 2035
  • Figure 116: East Asia Market Value (USD Million) Analysis by Grade, 2020 to 2035
  • Figure 117: East Asia Market Volume (Tons) Analysis by Grade, 2020 to 2035
  • Figure 118: East Asia Market Value Share (%) and BPS Analysis by Grade, 2025 to 2035
  • Figure 119: East Asia Market Y-o-Y Growth (%) Projections by Grade, 2025 to 2035
  • Figure 120: East Asia Market Value (USD Million) Analysis by End Use, 2020 to 2035
  • Figure 121: East Asia Market Volume (Tons) Analysis by End Use, 2020 to 2035
  • Figure 122: East Asia Market Value Share (%) and BPS Analysis by End Use, 2025 to 2035
  • Figure 123: East Asia Market Y-o-Y Growth (%) Projections by End Use, 2025 to 2035
  • Figure 124: East Asia Market Attractiveness by Grade, 2025 to 2035
  • Figure 125: East Asia Market Attractiveness by End Use, 2025 to 2035
  • Figure 126: East Asia Market Attractiveness by Country, 2025 to 2035
  • Figure 127: Middle East and Africa Market Value (USD Million) by Grade, 2025 to 2035
  • Figure 128: Middle East and Africa Market Value (USD Million) by End Use, 2025 to 2035
  • Figure 129: Middle East and Africa Market Value (USD Million) by Country, 2025 to 2035
  • Figure 130: Middle East and Africa Market Value (USD Million) Analysis by Country, 2020 to 2035
  • Figure 131: Middle East and Africa Market Volume (Tons) Analysis by Country, 2020 to 2035
  • Figure 132: Middle East and Africa Market Value Share (%) and BPS Analysis by Country, 2025 to 2035
  • Figure 133: Middle East and Africa Market Y-o-Y Growth (%) Projections by Country, 2025 to 2035
  • Figure 134: Middle East and Africa Market Value (USD Million) Analysis by Grade, 2020 to 2035
  • Figure 135: Middle East and Africa Market Volume (Tons) Analysis by Grade, 2020 to 2035
  • Figure 136: Middle East and Africa Market Value Share (%) and BPS Analysis by Grade, 2025 to 2035
  • Figure 137: Middle East and Africa Market Y-o-Y Growth (%) Projections by Grade, 2025 to 2035
  • Figure 138: Middle East and Africa Market Value (USD Million) Analysis by End Use, 2020 to 2035
  • Figure 139: Middle East and Africa Market Volume (Tons) Analysis by End Use, 2020 to 2035
  • Figure 140: Middle East and Africa Market Value Share (%) and BPS Analysis by End Use, 2025 to 2035
  • Figure 141: Middle East and Africa Market Y-o-Y Growth (%) Projections by End Use, 2025 to 2035
  • Figure 142: Middle East and Africa Market Attractiveness by Grade, 2025 to 2035
  • Figure 143: Middle East and Africa Market Attractiveness by End Use, 2025 to 2035
  • Figure 144: Middle East and Africa Market Attractiveness by Country, 2025 to 2035

Frequently Asked Questions

How Big is the Yeast Extract Market?

The global yeast extract market is likely to achieve USD 1.64 billion in 2025.

How Big will the Market Be by 2035?

The market is projected to reach USD 2.94 billion by 2035, with a projected value of by that year.

What is Expected Growth Rate of the Market over the Forecast Period?

The market is expected to grow at a 6.0% CAGR over the forecast period.

What is Expected CAGR of the Yeast Extract Market in the United States?

The United States market is anticipated to expand at a noteworthy CAGR of 6.3% from 2025 to 2035.

Which are the Top Five Countries Driving Demand for Yeast Extracts?

The United States, China, Japan, Australia, and Germany are the top five countries driving the demand for yeast extracts.

Explore Similar Insights

Future Market Insights

Yeast Extract Market