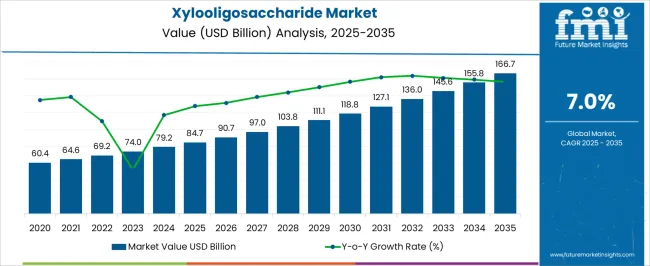
The Xylooligosaccharide Market is estimated to be valued at USD 84.7 billion in 2025 and is projected to reach USD 166.7 billion by 2035, registering a compound annual growth rate (CAGR) of 7.0% over the forecast period.

| Metric | Value |
|---|---|
| Xylooligosaccharide Market Estimated Value in (2025 E) | USD 84.7 billion |
| Xylooligosaccharide Market Forecast Value in (2035 F) | USD 166.7 billion |
| Forecast CAGR (2025 to 2035) | 7.0% |
The xylooligosaccharide market is experiencing robust momentum owing to its growing recognition as a functional prebiotic ingredient with wide-ranging health benefits. Rising consumer awareness regarding digestive wellness and immunity enhancement has been central to increasing adoption across food, beverage, and nutraceutical applications.
Strong demand for clean label and naturally derived ingredients has reinforced its market positioning, particularly as regulatory bodies and health organizations emphasize the importance of gut microbiota in overall health. Continuous research into its role in reducing risks associated with metabolic disorders and improving nutrient absorption has expanded its commercial appeal.
With expanding usage across both human nutrition and animal feed, the market outlook remains positive as food producers and healthcare companies increasingly integrate xylooligosaccharides into product formulations to address consumer demand for natural and science-backed functional ingredients.

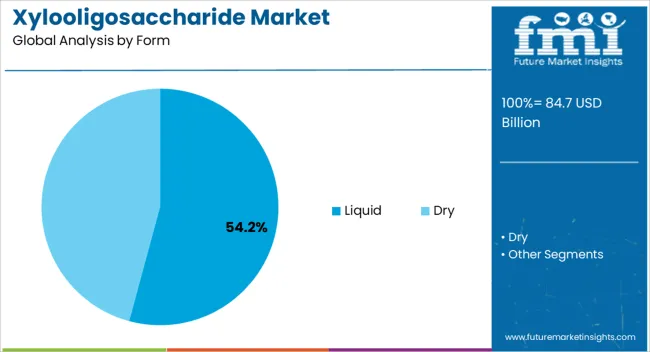
The liquid form segment is projected to account for 54.20% of total market revenue by 2025, making it the leading format. This dominance is being driven by its superior solubility, ease of blending with other ingredients, and higher absorption rates in both food and beverage formulations.
Liquid formulations have gained traction among manufacturers seeking efficient incorporation into functional drinks, dairy products, and syrups. Additionally, the ability to offer consistent dosing and uniform product texture has strengthened the preference for liquid formats.
As demand for ready-to-consume functional beverages grows, the liquid segment continues to maintain leadership due to its adaptability and convenience in large-scale processing and end-user consumption.
Demand in the market was expanding at 2.7% CAGR between 2020 and 2025, a huge downfall from a 12.3% CAGR from 2020 to 2024. Despite this downfall, the market is set to develop at a quicker rate. This is due to the increasing demand for natural ingredients in animal feed, along with the expansion of the livestock sector and packaged food.
| Year | Market Size |
|---|---|
| 2020 | USD 64 million |
| 2025 | USD 71.2 million |
| 2035 | USD 90.5 million |
| 2035 | USD 110.9 million |
| 2035 | USD 139.45 million |
Demand for xylooligosaccharides is expected to be driven by local sourcing and the development of downstream sales channels. Manufacturers of animal feed are preferring locally sourced ingredients instead of bulk ingredients available through global supply chains.
Similarly, feed additive makers are choosing local sources, and prioritizing nation and region-specific raw material sourcing. Most animal feed manufacturing companies are developing local distribution networks to protect their businesses from external forces and trade regulations.
This is creating growth opportunities for new entrants in the global xylooligosaccharide market. Additionally, increasing usage of compound feed, a combination of raw ingredients and additives, is expected to drive sales in the market. With an expected CAGR of 7% between 2025 and 2035.
Governments and various animal welfare organizations across the globe are launching several campaigns. To spread awareness regarding various diseases affecting companion animals. This helps owners to avoid animal-related diseases. This is expected to continue driving xylooligosaccharide sales in the market over the forecast period.
Many regulatory agencies have strict rules governing the creation and sale of xylooligosaccharides. By making it more difficult for manufacturers to comply with them, these restrictions hamper the expansion of the market.
Consumers currently lack a general understanding of the advantages of xylooligosaccharides, which limit global demand. This results in a lack of investment in the market.
Multiple prebiotic products on the market, such as inulin and fructooligosaccharides, compete fiercely with xylooligosaccharides. This prevents consumers from using it since they can prefer other prebiotic products. This results in reducing the profit margins of xylooligosaccharide manufacturers.
| Country | Market Share (2025) |
|---|---|
| United States | 34% |
| Germany | 13% |
| Japan | 1.5% |
| Australia | 1.2% |

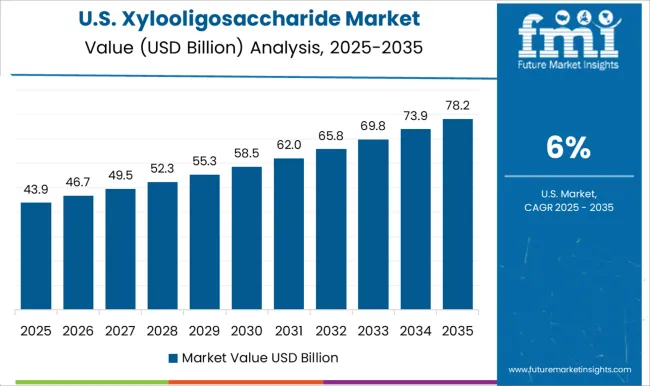
The United States is expected to account for a lion’s share in the North America xylooligosaccharide business over the assessment period. Increasing demand for various animal-derived products is boosting sales in the market.
Interestingly, the growing focus on the quality of ingredients used in animal feed is spurring demand for effective probiotics. Also, naturally sourced ingredients in the country result in high demand for xylooligosaccharides.
| Applications | Development |
|---|---|
| Cosmetics | As they are hydrating and anti-aging, xylooligosaccharides are frequently used in cosmetic and personal care products. Xylooligosaccharides are being developed as a primary ingredient in products like face creams and lotions. |
| Supplements | Producers are creating xylooligosaccharide supplements that can be consumed as powder or capsules. The purpose of these supplements is to maintain gut health and enhance digestion. |
| Combine Products | To create products that offer a wider range of health advantages, producers are combining xylooligosaccharides with other prebiotic components like inulin or fructooligosaccharides. |
China is expected to emerge as a lucrative pocket in the East Asia xylooligosaccharide sector, with a CAGR of 8.9% by 2035. This is owing to the presence of massive livestock and agriculture sectors. Growing demand for naturally sourced ingredients in the country is expected to augment the growth in the China market over the forecast period.
Xylooligosaccharides are a potential source of probiotics that improve the gut health of livestock animals. The high incidence of diseases in livestock animals in the country is expected to drive sales in the market over the assessment period, opines FMI.
Asian nations have a long history of using products made from plants for therapeutic and curative purposes. The demand for xylooligosaccharide as a dietary fiber and prebiotics application in functional foods across the region is projected to expand. This is due to the rising burden of chronic diseases, awareness of health wellness, and avoidance of lifestyle disorders.
In India, Xylooligosaccharides have attracted a lot of attention as prebiotics in recent years. This is a result of its numerous positive effects, particularly in preventing gastrointestinal problems. Its mild sweetness, stability over a wide range of pH and temperatures, and organoleptic qualities that make them acceptable for inclusion in foods also have an impact on demand.
These resources are inexpensive and in great supply in India. Due to the rising need for xylooligosaccharide as a rapidly expanding functional dietary additive. Moreover, inexpensive agricultural residues are also being taken into consideration and have been thoroughly examined. All these factors result in an expected CAGR of 10.8% by 2035.
Based on form, sales in the dry form segment are projected to increase at a considerable pace over the forecast period. It dominated the market with a 69% share in 2025. Growth can be attributed to the increasing incorporation of natural ingredients in animal feed to improve the quality of these products.
Dry xylooligosaccharides are easy to incorporate into animal feed and other products. Being a source of probiotics, it is emerging as one of the key ingredients in animal feed to improve the gut health of animals. This in turn is fueling the adoption in the market.
In terms of product type, livestock segments lead the market with a share of 38% in 2025 and are projected to remain high over the forecast period. Expansion of the agriculture, animal husbandry, packaged food, dairy, and meat industries is expected to provide impetus to sales over the assessment period.
The xylooligosaccharide sector for livestock is anticipated to increase as a result of the rising demand for natural and sustainable feed additives. This is because it is a readily available and reasonably priced product made from agricultural residues.
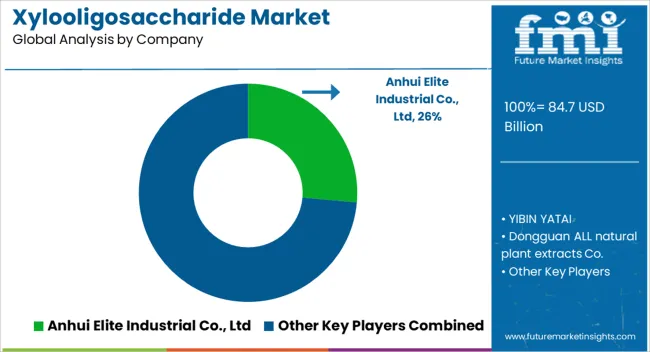
The main growth tactics employed by market companies to increase sales are mergers, acquisitions, expansions, partnerships, and new product development. Also, to obtain a competitive advantage, players are investing in smart marketing and advertising solutions. To increase consumer awareness of their brands.
To satisfy growing consumer demand, producers are developing and introducing new types of xylooligosaccharide products. To enhance their position in the worldwide market, key companies are concentrating on implementing a variety of inorganic growth methods. A producer has a competitive edge by maintaining low production costs, which enables them to sell their goods for less than rivals do.
Recent Development:

The global xylooligosaccharide market is estimated to be valued at USD 84.7 billion in 2025.
The market size for the xylooligosaccharide market is projected to reach USD 166.7 billion by 2035.
The xylooligosaccharide market is expected to grow at a 7.0% CAGR between 2025 and 2035.
The key product types in xylooligosaccharide market are liquid and dry.
In terms of product type, pet segment to command 48.7% share in the xylooligosaccharide market in 2025.


Our Research Products

The "Full Research Suite" delivers actionable market intel, deep dives on markets or technologies, so clients act faster, cut risk, and unlock growth.

The Leaderboard benchmarks and ranks top vendors, classifying them as Established Leaders, Leading Challengers, or Disruptors & Challengers.

Locates where complements amplify value and substitutes erode it, forecasting net impact by horizon

We deliver granular, decision-grade intel: market sizing, 5-year forecasts, pricing, adoption, usage, revenue, and operational KPIs—plus competitor tracking, regulation, and value chains—across 60 countries broadly.

Spot the shifts before they hit your P&L. We track inflection points, adoption curves, pricing moves, and ecosystem plays to show where demand is heading, why it is changing, and what to do next across high-growth markets and disruptive tech

Real-time reads of user behavior. We track shifting priorities, perceptions of today’s and next-gen services, and provider experience, then pace how fast tech moves from trial to adoption, blending buyer, consumer, and channel inputs with social signals (#WhySwitch, #UX).

Partner with our analyst team to build a custom report designed around your business priorities. From analysing market trends to assessing competitors or crafting bespoke datasets, we tailor insights to your needs.
Supplier Intelligence
Discovery & Profiling
Capacity & Footprint
Performance & Risk
Compliance & Governance
Commercial Readiness
Who Supplies Whom
Scorecards & Shortlists
Playbooks & Docs
Category Intelligence
Definition & Scope
Demand & Use Cases
Cost Drivers
Market Structure
Supply Chain Map
Trade & Policy
Operating Norms
Deliverables
Buyer Intelligence
Account Basics
Spend & Scope
Procurement Model
Vendor Requirements
Terms & Policies
Entry Strategy
Pain Points & Triggers
Outputs
Pricing Analysis
Benchmarks
Trends
Should-Cost
Indexation
Landed Cost
Commercial Terms
Deliverables
Brand Analysis
Positioning & Value Prop
Share & Presence
Customer Evidence
Go-to-Market
Digital & Reputation
Compliance & Trust
KPIs & Gaps
Outputs
Full Research Suite comprises of:
Market outlook & trends analysis
Interviews & case studies
Strategic recommendations
Vendor profiles & capabilities analysis
5-year forecasts
8 regions and 60+ country-level data splits
Market segment data splits
12 months of continuous data updates
DELIVERED AS:
PDF EXCEL ONLINE

Thank you!
You will receive an email from our Business Development Manager. Please be sure to check your SPAM/JUNK folder too.
Chat With
MaRIA