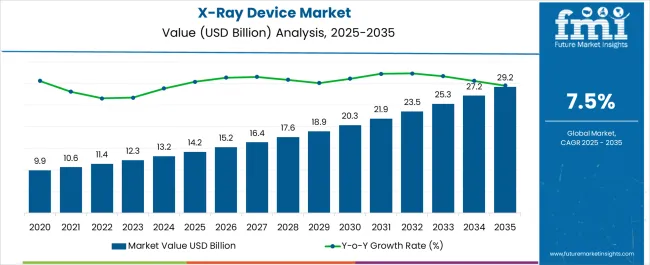
The X-Ray Device Market is estimated to be valued at USD 14.2 billion in 2025 and is projected to reach USD 29.2 billion by 2035, registering a compound annual growth rate (CAGR) of 7.5% over the forecast period.

| Metric | Value |
|---|---|
| X-Ray Device Market Estimated Value in (2025 E) | USD 14.2 billion |
| X-Ray Device Market Forecast Value in (2035 F) | USD 29.2 billion |
| Forecast CAGR (2025 to 2035) | 7.5% |
The X-ray device market is advancing rapidly, fueled by increasing healthcare infrastructure investments, greater emphasis on early diagnostic imaging, and rising demand for non-invasive procedures. The global healthcare sector’s digital shift is accelerating the replacement of analog systems with more efficient, software-enabled X-ray devices.
Technological advancements in detector sensitivity, imaging resolution, and reduced radiation exposure are enhancing clinical outcomes, particularly in orthopedic, dental, and emergency settings. Moreover, aging populations and the increasing prevalence of chronic bone-related conditions are intensifying the need for real-time diagnostic capabilities across primary care and specialist clinics.
Regulatory support for portable diagnostics, growing radiology service outsourcing, and integrated PACS systems are further enabling market expansion. The future trajectory of the market is expected to align with AI-driven automation in image interpretation, device miniaturization, and broader adoption in emerging economies.
The market is segmented by Portability Type, Application Type, Product Type, Technology Type, and End User Type and region. By Portability Type, the market is divided into Portable X-Ray Devices and Fixed X-Ray Devices. In terms of Application Type, the market is classified into X-Ray Device for Orthopedic Applications, X-Ray Device for Dental Applications, X-Ray Device for Cardiovascular Diseases (CVD) Applications, X-Ray Device for Oncology Applications, and X-Ray Device for Other Applications. Based on Product Type, the market is segmented into Digital X-Ray Device and Analog X-Ray Device. By Technology Type, the market is divided into Direct Radiography X-Ray Device and Computed Radiography X-Ray Device. By End User Type, the market is segmented into X-Ray Device for Hospitals, X-Ray Device for Diagnostics Centers, and X-Ray Device for Other End Users. Regionally, the market is classified into North America, Latin America, Western Europe, Eastern Europe, Balkan & Baltic Countries, Russia & Belarus, Central Asia, East Asia, South Asia & Pacific, and the Middle East & Africa.

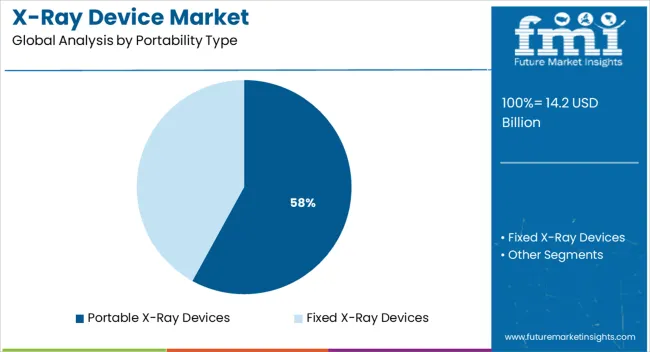
Portable X-ray devices are projected to contribute 58.0% of total revenue in the X-ray device market by 2025, making them the leading portability type. Their dominance is being driven by the growing need for point-of-care diagnostics, especially in emergency medicine, remote settings, and intensive care units.
Portability allows radiographic imaging to be brought directly to patients, minimizing movement and enabling faster diagnosis. Innovations in battery life, wireless transmission, and lightweight construction have made these devices more accessible and reliable across field hospitals, home care, and mobile health units.
The segment’s appeal is also being enhanced by favorable reimbursement structures and workflow improvements in both developed and developing healthcare systems.

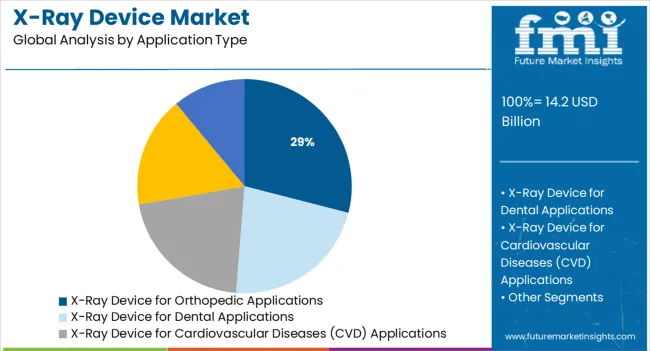
X-ray devices for orthopedic applications are expected to account for 29.0% of total market revenue in 2025, establishing this as the dominant application segment. This share is attributed to the high demand for skeletal imaging in both acute injury assessment and chronic musculoskeletal conditions.
The rising incidence of fractures, arthritis, and sports injuries has increased the need for precise bone imaging and real-time monitoring of treatment progress. Enhanced detector technologies and software capabilities now allow for high-resolution, multi-angle imaging that supports surgical planning and post-operative evaluations.
Additionally, growing orthopedic procedure volumes, coupled with an aging demographic, continue to drive investment in X-ray imaging assets across hospitals, orthopedic clinics, and ambulatory centers.

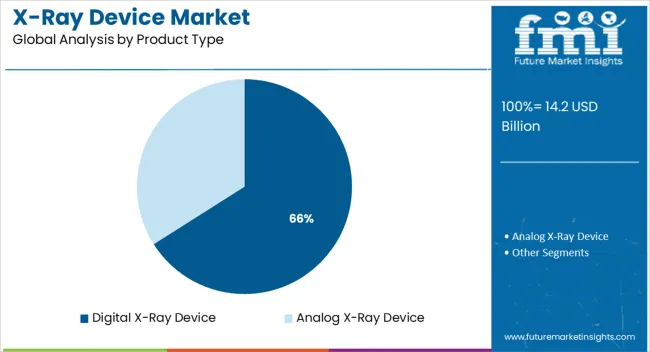
Digital X-ray devices are expected to command 66.0% of the market revenue by 2025, ranking them as the top product type. Their leadership is supported by the shift from analog to digital imaging systems due to the need for faster processing, improved image quality, and integration with hospital information systems.
Digital systems reduce radiation exposure while enabling instant image capture and enhanced contrast resolution, improving both diagnostic accuracy and patient safety. The operational efficiency provided by digital workflows—including fewer retakes, seamless data archiving, and tele-radiology support—has made them the standard across modern healthcare institutions.
The trend toward AI-enhanced diagnostics and cloud-based storage solutions continues to reinforce the digital X-ray device segment's dominance in both inpatient and outpatient settings.
Within North America, the United States holds the major market share for the studied market and is expected to dominate over the forecast period. The increasing adoption of healthcare systems towards sophisticated technology and the growing burden of chronic diseases such as cancer, and diabetes, in the region are the major factors driving the digital X-Rays devices market in North America. The GLOBOCON 2024 data shows that in 2024 the new cancer cases diagnosed were 2,281,658 in the United States, with 612,390 deaths.
Further, as per the Arthritis Foundation Fact sheet 2020, the number of adults in the United States with doctor-diagnosed arthritis is projected to reach 78.4 million by 2040.
Also, according to Arthritis Foundation data updated in October 2024, 13.2 million people in the United States have rheumatoid arthritis, where arthritis most commonly begins between ages 30 and 60 in women. The high incidence of these chronic diseases surges the demand for accurate diagnosis and plans of efficient and on-time treatment by the healthcare provider. Hence, drives the growth of the studied market in North America.
Additionally, the high concentration of key players, along with the increasing product approvals and launches is expected to drive the studied market. For instance, in December 2024, Canon Medical System USA, Inc., launched the OMNERA 500A Digital Radiography system with an advanced intelligent auto-positioning feature to improve the workflow.
The increasing product launches related to portable X-ray devices surge the growth of the studied market. For instance, in August 2024, Canon Medical USA launched the SOLTUS 500 Mobile Digital X-ray system that is equipped with enhancements that can streamline bedside exams to help improve workflow and productivity. Again, in March 2024, Fujifilm India Private Limited announced the launch of its mobile digital radiology system - FDR nano which is around 80% lighter in weight as compared to traditional mobile X-rays.
Also, in July 2025, Shimadzu Corporation announced the addition of the new MobileDaRt Evolution MX8 Version v type digital mobile X-ray system to the mobile X-ray system lineup, for release outside Japan. The system incorporates digital radiography (DR), which is in demand outside Japan. Thus, given the advantages of portable systems and increasing product launches, the segment is expected to grow significantly over the forecast period.
Growing incidences of orthopedic diseases and cancers and increasing awareness about the benefits of using X-ray systems over conventional methods are expected to play important role in driving the global X-ray device market during the forecast period.
Advantages of digital imaging such as easy accessibility and cost-effectiveness are likely to amplify the market size in the forthcoming period. Also, it is relatively less harmful than conventional X-rays as it inhibits about 70-80% of radiation reaching the body.
Furthermore, digital X-rays also assist dentists in recognizing oral issues, which has significantly reduced the invasive investigation at the diagnosis stage. On account of the foregoing factors, the global market for the X-ray device market is likely to flourish notably in the approaching years.
Additionally, the development of technology and growing product approvals are expected to provide a significant boost to the market in the forecast period. In November 2024, Hologic, Inc. obtained the CE mark for its Genius Digital Diagnostics System.
In another occurrence, in August 2024, Waygate Technologies rolled out two new portable X-ray detectors. Owing to the aforementioned causes, the industry is likely to witness notable expansion in the assessment tenure.
As reported by the American Heart Association (AHA) Heart Diseases and Stroke Statistics 2025 data, cardiovascular disease (CVD) is listed as the principal disease infecting the USA citizens and is also responsible for the deaths of about 874, 613 people in 2020.
Such a high prevalence of the disease across the region generated a need for efficient imaging devices, thereby, benefitting the X-ray device market during the forecast period. Also, increasing health consciousness and growing product launches are other salient factors propelling the market during the assessment period.
Moreover, the demand for advanced digital X-ray methods has increased significantly owing to advantages like their capability to process large volumes of data and examine patients at a fast pace. Also, various players are making significant investments in R&D to develop products that are likely to augment the market size in the coming time.
For instance, in September 2024, GE Healthcare introduced AMX Navigate. It is a portable digital X-ray system. In addition, increasing instances of clearances are expected to propel market growth. For In March 2024, Koninklijke Philips obtained 510(k) clearance from the USA FDA for CombiDiagnost R90. It is a remote-regulated fluoroscopy method, combined with high-end digital radiography.
Additionally, an increasing partnership among players is likely to strengthen the market growth during the forecast period. For instance, in June 2024, Nanoxand SK Telcom inked a strategic partnership to deploy 2,500 Nanoxdigital X-ray Systems into South Korea and Vietnam. Due to all the above-mentioned factors, the market for X-Ray devices market is projected to flourish in the forecast period.
The increasing adoption of digital X-ray systems is expected to offer significant opportunities for market expansion during the forecast period. The rising inclination towards the digital X-ray method to obtain fast results is likely to be the major factor benefitting the industry in the assessment time.
Also, digital radiography controls the radiation exposure by 75%, thereby, making it a preferred method. Moreover, they also eradicate the need for automatic film processors. Due to the aforementioned factors, the digital global X-Ray systems are likely to gain significant traction in the forecast period.
In addition, the launch of innovative products is anticipated to further widen the market growth scopes in the assessment tenure. In April 2025, Samsung introduced a new mobile digital radiograph device, called GM85 Fit. It is a novel product featuring a user-centric design that helps in effective patient care. The equipment recently received 510(k) clearance for the USA FDA for commercial application in the region.
Benefits offered by digital systems such as fine image quality at lesser radiation, flexibility to transfer images through online tools, elimination of the use of chemicals used for developing films, and pocket-friendly model, among others, are expected to boost the industry expansion in the forecast period. Such factors are likely to boost demand for digital X-Ray and expand the market growth scope in the forecast period.
Even though there are several benefits of X-ray devices, x-ray radiations have a harmful impact on human health. The radiation damage the cells of the body. This is expected to be one of the most significant factors impeding the market growth in the forecast period. In addition, lack of infrastructure, especially in developing or underdeveloped regions, and poor reimbursements are other factors hampering the industry growth in the forthcoming period.
The advent of digital x-ray systems has opened avenues of growth for players. However, premium costs associated with the device are expected to limit the market growth in the coming time. Small and medium-sized hospitals find it challenging to procure expensive services like digital x-rays, thereby, slowing down their adoption and hampering the market growth.
As per the analysis, the global X-ray device market is anticipated to be dominated by North America. In the region, the USA is anticipated to take a lead. The country is estimated to hold a market value of USD 14.2 Billion while recording a CAGR of 7.5% during the forecast period from 2025 to 2035.
This domination can be attributed to the growing implementation of modern technology in the healthcare sector. Also, there has been a significant rise in chronic diseases, which are expected to drive the demand for the equipment in the region.
The presence of established players that are active in the market is projected to augment the market size in the forecast period. For instance, in December 2024, Canon Medical System USA, announced the launch of the OMNERA 500A Digital Radiography system.
It comprises modern intelligent auto-positioning specific to enhance functioning. Thus, owing to the aforementioned factors, the market in North America is anticipated to witness significant growth opportunities during the forecast period.
Asia Pacific has been identified as the most lucrative market during the forecast period. As per the analysis, China is expected to lead the regional market, expanding at the highest CAGR of 7.2% while garnering a market share of USD 29.2 Billion by the end of 2035. Other lucrative markets are South Korea and Japan, estimated at USD 876.2 Million and USD 1.4 Billion, respectively.
The development of the regional market can be attributed to the presence of developing countries taking various initiatives to strengthen their healthcare infrastructure. Also, the launch of developed x-ray devices is predicted to be another cause driving the market in the forecast period.
For instance, in May 2025, Imsight Technology, a Chinese company that develops digital radiographic examinations of the chest, rolled out an AI system to offer a computer-aided tomographic diagnostic screening of lungs amid the pandemic.
In another instance, in April 2025, Wipro GE Healthcare launched the ‘Made in India’ CT system to improve accessibility in India. The company says that the CT system is equipped with better imaging intelligence to enhance clinical confidence when diagnosing diseases. Therefore, owing to the aforementioned factors, the market in APAC is projected to expand notably in the assessment period.
| Country | Projected CAGR (2025 to 2035) |
|---|---|
| USA | 7.5% |
| UK | 6.8% |
| China | 7.2% |
| Japan | 6.2% |
| South Korea | 5.5% |
Key players in the global X-ray device market include Bracco Imaging SPA, Hologic Inc., Fujifilm Holdings Corp, KUB Technologies Inc, and GE Healthcare, among others.
Recent developments in the industry are:
The global x-ray device market is estimated to be valued at USD 14.2 billion in 2025.
The market size for the x-ray device market is projected to reach USD 29.2 billion by 2035.
The x-ray device market is expected to grow at a 7.5% CAGR between 2025 and 2035.
The key product types in x-ray device market are portable x-ray devices and fixed x-ray devices.
In terms of application type, x-ray device for orthopedic applications segment to command 29.0% share in the x-ray device market in 2025.


Full Research Suite comprises of:
Market outlook & trends analysis
Interviews & case studies
Strategic recommendations
Vendor profiles & capabilities analysis
5-year forecasts
8 regions and 60+ country-level data splits
Market segment data splits
12 months of continuous data updates
DELIVERED AS:
PDF EXCEL ONLINE
X-Ray Positioning Devices Market Size and Share Forecast Outlook 2025 to 2035
Backscatter X-ray Devices Market Size and Share Forecast Outlook 2025 to 2035
Digital Mobile X-ray Devices Market Analysis - Growth & Forecast 2024 to 2034
Device-Embedded Biometric Authentication Market Size and Share Forecast Outlook 2025 to 2035
IoT Device Management Market Size and Share Forecast Outlook 2025 to 2035
IoT Device Management Platform Market Size and Share Forecast Outlook 2025 to 2035
Drug Device Combination Products Market Size and Share Forecast Outlook 2025 to 2035
FBAR Devices Market
Power Device Analyzer Market Growth – Trends & Forecast 2025 to 2035
Snare devices Market
C-Arms Devices Market Size and Share Forecast Outlook 2025 to 2035
Biopsy Device Market Forecast and Outlook 2025 to 2035
Timing Devices Market Analysis - Size, Growth, & Forecast Outlook 2025 to 2035
Spinal Devices Market Size and Share Forecast Outlook 2025 to 2035
Mobile Device Management Market Analysis by Deployment Type, Solution, Business Size, Vertical, and Region Through 2035
Venous Device Market
Serial Device Servers Market
Medical Device Tester Market Size and Share Forecast Outlook 2025 to 2035
Medical Device Trays Market Size and Share Forecast Outlook 2025 to 2035
Hearing Devices 3D Printing Market Size and Share Forecast Outlook 2025 to 2035

Thank you!
You will receive an email from our Business Development Manager. Please be sure to check your SPAM/JUNK folder too.
Chat With
MaRIA