The Wireless Charging ICs Market is estimated to be valued at USD 3.6 billion in 2025 and is projected to reach USD 12.3 billion by 2035, registering a compound annual growth rate (CAGR) of 13.1% over the forecast period.
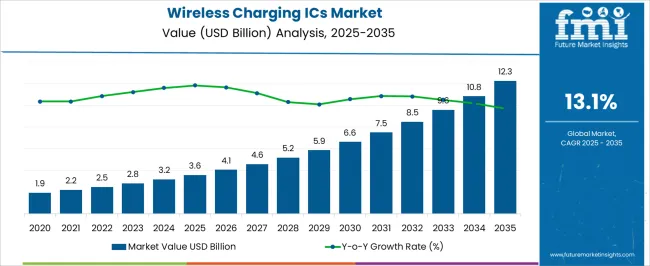
| Metric | Value |
|---|---|
| Wireless Charging ICs Market Estimated Value in (2025 E) | USD 3.6 billion |
| Wireless Charging ICs Market Forecast Value in (2035 F) | USD 12.3 billion |
| Forecast CAGR (2025 to 2035) | 13.1% |
The Wireless Charging ICs market is undergoing significant growth, supported by the rapid evolution of power management technologies and increasing demand for cord-free user experiences. The market is being driven by widespread adoption of wireless charging across consumer devices, wearables, and electric mobility platforms. Industry press releases and investor briefings have highlighted the strategic push by semiconductor firms to develop integrated and energy-efficient charging solutions, which is accelerating market expansion.
Furthermore, the transition toward higher wattage standards and multi-device charging capabilities is creating avenues for innovation. Product announcements and technology media have emphasized how compact designs, heat management improvements, and higher charging speeds are becoming key differentiators.
Regulatory developments focused on safety, interoperability, and energy efficiency are also encouraging manufacturers to adopt smart IC architectures With ongoing advancements in semiconductor integration and the growing ecosystem of wireless power infrastructure, the market is expected to maintain a strong upward trajectory over the next several years.
The market is segmented by Products, Power Range, and Application and region. By Products, the market is divided into Receivers and Transmitters. In terms of Power Range, the market is classified into Medium 16-50 Watt, High >51 Watt, and Low <15 Watt. Based on Application, the market is segmented into Consumer Electronics, Automotive, and Healthcare. Regionally, the market is classified into North America, Latin America, Western Europe, Eastern Europe, Balkan & Baltic Countries, Russia & Belarus, Central Asia, East Asia, South Asia & Pacific, and the Middle East & Africa.
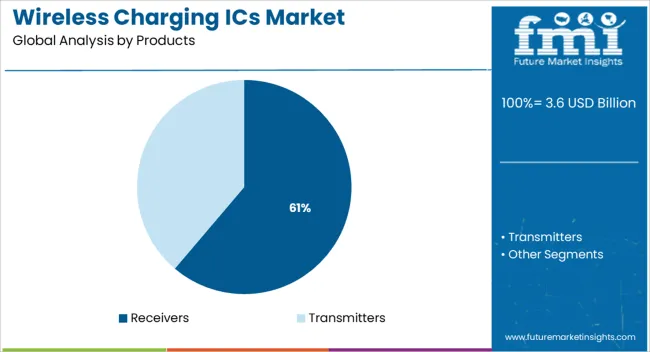
The receivers segment is anticipated to account for 61.2% of the Wireless Charging ICs market revenue share in 2025, making it the leading product category. This dominance is being driven by the high volume of consumer devices such as smartphones, wearables, and wireless earbuds, all of which require integrated power receiving capabilities. Press releases from chipset manufacturers and device makers have highlighted the increasing integration of receiver ICs directly onto system-on-chip platforms, enhancing efficiency and conserving space.
The widespread adoption of the Qi standard has further accelerated receiver deployment, particularly in mobile devices and compact electronics. Demand for backward-compatible and multi-protocol receivers is being supported by the need for universal charging solutions.
Additionally, the miniaturization and low power loss characteristics of these ICs have contributed to their mass adoption These factors, coupled with continued innovation in power conversion efficiency and heat management, have established the receiver segment’s strong position in the overall market landscape.
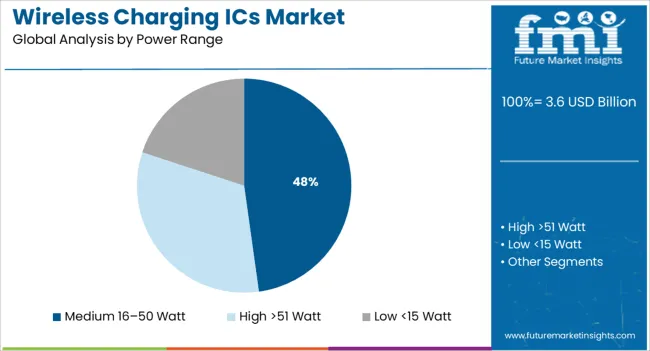
The medium 16-50 watt power range segment is projected to hold 47.8% of the Wireless Charging ICs market revenue share in 2025. Growth in this segment is being propelled by increasing demand for faster wireless charging in tablets, high-end smartphones, laptops, and other mid-power consumer electronics. Industry publications and product datasheets have noted a clear shift in consumer preference toward faster charge cycles without compromising thermal performance.
Manufacturers are embedding intelligent power negotiation protocols into ICs, which has enabled safe and adaptive charging within this power range. Regulatory compliance with electromagnetic safety standards and thermal controls is also encouraging adoption of this segment.
Furthermore, growing penetration of wireless charging furniture and smart home installations is expanding the application of medium-range power solutions With support for bi-directional charging and compatibility across varied voltage architectures, this segment is expected to play a pivotal role in shaping the next phase of wireless charging development.
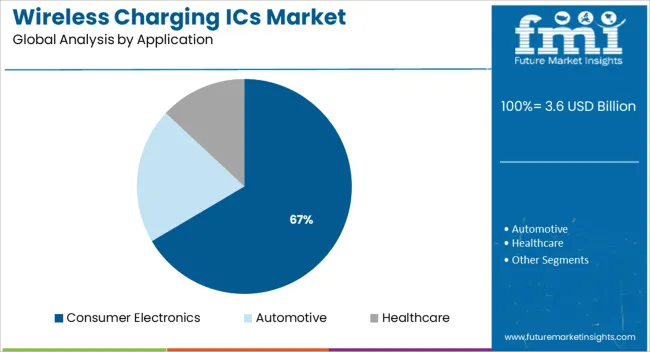
The consumer electronics segment is forecasted to account for 66.5% of the Wireless Charging ICs market revenue share in 2025, positioning it as the most dominant application area. This growth is being led by the surge in wireless power integration across smartphones, smartwatches, wireless earphones, tablets, and gaming accessories.
Public product announcements and investor updates have consistently emphasized the strategic priority placed on cordless convenience and compact charging solutions. As user expectations around portability and seamless charging increase, electronics manufacturers are focusing on embedding smart wireless ICs that support fast charge, thermal efficiency, and device recognition features.
Furthermore, the rise of eco-friendly design mandates is pushing firms to move toward universal wireless charging interfaces, making ICs critical to platform compatibility These innovations are aligning with global trends in mobility, miniaturization, and user-centric design, making consumer electronics the primary catalyst for sustained market expansion.
Short-term Growth: Wireless charging technology earlier was introduced in very rare consumer electronics to enhance the ease of operations along with the higher demand from the healthcare sector.
Mid-term Growth: During this phase, the market took a blow as covid-19 expanded and the research around wireless techniques crashed. Therefore, the phase can be defined as the lowest phase for the market.
Long-term Growth: Wireless charging ICs are now being commonly used in electric as well as fuel-based vehicles, making them exclusive to common masses. The flagship phones and smart devices are adopting wireless power and charging support. The market now thrives at a CAGR of 16.7% during the forecast period.
Users are readily adopting wireless charging pads and wireless charging power banks for a quick charge of their electrical gadgets in a dependable, convenient, and safe way.
By eliminating the use of physical connectors and wires, wireless charging delivers efficient, cost-effective, and safety advantages over traditional charging systems. It also ensures constant power transfer to ensure that all types of devices (handheld industrial gadgets, smartphones phones with wireless charging, heavy-duty equipment, and others) are charged and ready to use.
Increasing applications of wireless charging in heavy-duty industrial devices for continuous power delivery is expected to fuel market expansion in the future. The wireless changing landscape is evolving into a lucrative ecosystem in terms of usability and product design, thanks to drop & charge trends and wireless radiofrequency (RF) energy base chargers.
The market is primarily driven by increased internet usage in smart devices. Furthermore, disruptive technologies and wearable gadgets are paving the way for market growth.
The wireless changing landscape is evolving into a lucrative ecosystem in terms of usability and product design, thanks to drop & charge trends and wireless radiofrequency (RF) energy base chargers. The market is primarily driven by increased internet usage in smart devices. Furthermore, disruptive technologies and wearable gadgets are paving the way for market growth.
The demand for wireless charging solutions is substantially increasing as the electric vehicle (EV) sector continues to evolve. In the whole value chain of electric vehicles, wireless EV charging technology is expanding in tandem with maturing technological standards. Research and Development initiatives in far-field wireless charging technologies are creating profitable opportunities for market players in order to meet the expanding demand.
| Region | Absolute Market Growth |
|---|---|
| USA | 1.1 Billion |
| United Kingdom | 4012.3 Million |
| China | 887.8 Million |
| Japan | 937.3 Million |
| South Korea | 794.9 Million |
Due to the advancements in the electronics sector and increased EV sales, North America is anticipated to contribute significantly from 2025 to 2035.
By region, the wireless charging market trends have been assessed for North America, Europe, Asia-Pacific, and LAMEA. Due to the rise in demand for fuel-efficient and durable charging systems for electronic devices such as power tools and portable gadgets, Europe was the second largest revenue contributor, while North America is predicted to dominate the market throughout the forecast period.
The presence of Major Wireless Technology Players makes it the Biggest Market.
| Region | Attributes |
|---|---|
| USA Market CAGR (2025 to 2035) | 13.5% |
| USA Market Absolute Doller Growth (USD Million/Billion) | USD 1.1 billion |
According to FMI, the USA plays a crucial role in the expansion of wireless charging ICs market size as it holds the major implementation and hardware giants. These players have extended research and development teams that constantly go through the different integration solutions of wireless power delivery to enhance charging operations.
Therefore, the USA market for wireless charging ICs is likely to cross a value of USD 12.3 Billion by 2035.
The Asian Hub for Transforming Technology, South Korea extends its Research while Booming at the Fastest CAGR
| Region | Attributes |
|---|---|
| South Korean Market CAGR (2025 to 2035) | 19.9% |
| South Korean Market Absolute Doller Growth (USD Million/Billion) | 795.9 Million |
South Korea has been the house of innovative technologies such as wireless headphone technology and is known for its niche work based on research. The country is currently developing extensive research for wireless charging ICs to make them faster.
For instance, a South Korean research team has developed a wireless charging method with an operation area of 30 meters. The market is likely to cross a value of USD 949.2 Million by 2035.
In-house Projects of Wireless Power Delivery, China Pushes the Universal Charging Standard for Smartwatches.
| Region | Attributes |
|---|---|
| Chinese Market CAGR (2025 to 2035) | 17% |
| Chinese Market Absolute Doller Growth (USD Million/Billion) | USD 887.8 Million |
According to FMI analysis, China is estimated to reach a value of USD 1.1 Billion by 2035.
Just like South Korea, China also thrives in the technological race with its high manufacturing power. The higher production of ICs in China and Taiwan fuels the export of IC technology, pushing the vendors to implement them according to their needs.
The jump in the production of wireless charging ICs has been witnessed over the last two years and is expected to be the same in the future.
| Segment | Top Product Type |
|---|---|
| Top Sub-segment | Transmitters |
| CAGR (2020 to 2025) | 15.1% |
| CAGR (2025 to 2035) | 16.2% |
| Segment | Top Application |
|---|---|
| Top Sub-segment | Consumer Electronics |
| CAGR (2020 to 2025) | 15.4% |
| CAGR (2025 to 2035) | 16.6% |
The transmitter technology is easy and has a higher bandwidth to support fast wireless charging. The technology can easily be adopted across different power delivery systems. Furthermore, the wider application of this segment makes it grow at a CAGR of 16.2% between 2025 and 2035, while it previously thrived at a CAGR of 15.1%.
The advent of wireless charging ICs for smartphones, smartwatches, and other consumer electronics is fueling the demand for the segment. Furthermore, the flagship category of mobile phones is adopting wireless charging technology.
Wireless charging technology is being more widely adopted in the industrial sector due to its advantages of increased safety and uninterrupted power supply. High demand for wireless charging in a sterile hospital environment is producing new revenue pockets for device manufacturers.
By industry vertical, the market is divided into electronics, automotive, industrial, healthcare, and aerospace & defense. The healthcare wireless charging segment is also predicted to develop at the fastest CAGR between 2025 and 2035.
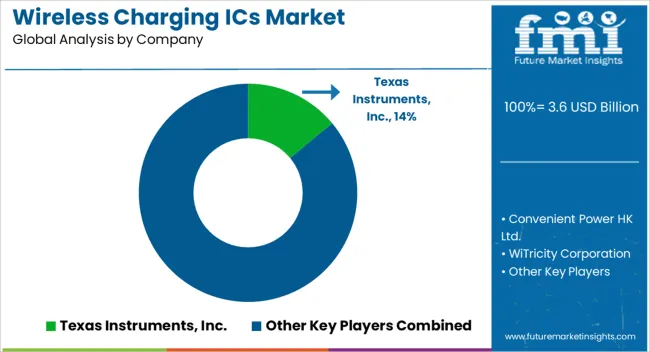
The major companies in the market focus on extending their research and development programs while also making their technology futuristic. Wireless power delivery, wireless transmission, and faster charging are some concepts players focus on. Key players in the market are Convenient Power HK Ltd, WiTricity Corporation, Murata Manufacturing Co. Ltd, and Texas Instruments, Inc.
Latest Developments:
The global wireless charging ICs market is estimated to be valued at USD 3.6 billion in 2025.
The market size for the wireless charging ICs market is projected to reach USD 12.3 billion by 2035.
The wireless charging ICs market is expected to grow at a 13.1% CAGR between 2025 and 2035.
The key product types in wireless charging ICs market are receivers and transmitters.
In terms of power range, medium 16–50 watt segment to command 47.8% share in the wireless charging ICs market in 2025.


Our Research Products

The "Full Research Suite" delivers actionable market intel, deep dives on markets or technologies, so clients act faster, cut risk, and unlock growth.

The Leaderboard benchmarks and ranks top vendors, classifying them as Established Leaders, Leading Challengers, or Disruptors & Challengers.

Locates where complements amplify value and substitutes erode it, forecasting net impact by horizon

We deliver granular, decision-grade intel: market sizing, 5-year forecasts, pricing, adoption, usage, revenue, and operational KPIs—plus competitor tracking, regulation, and value chains—across 60 countries broadly.

Spot the shifts before they hit your P&L. We track inflection points, adoption curves, pricing moves, and ecosystem plays to show where demand is heading, why it is changing, and what to do next across high-growth markets and disruptive tech

Real-time reads of user behavior. We track shifting priorities, perceptions of today’s and next-gen services, and provider experience, then pace how fast tech moves from trial to adoption, blending buyer, consumer, and channel inputs with social signals (#WhySwitch, #UX).

Partner with our analyst team to build a custom report designed around your business priorities. From analysing market trends to assessing competitors or crafting bespoke datasets, we tailor insights to your needs.
Supplier Intelligence
Discovery & Profiling
Capacity & Footprint
Performance & Risk
Compliance & Governance
Commercial Readiness
Who Supplies Whom
Scorecards & Shortlists
Playbooks & Docs
Category Intelligence
Definition & Scope
Demand & Use Cases
Cost Drivers
Market Structure
Supply Chain Map
Trade & Policy
Operating Norms
Deliverables
Buyer Intelligence
Account Basics
Spend & Scope
Procurement Model
Vendor Requirements
Terms & Policies
Entry Strategy
Pain Points & Triggers
Outputs
Pricing Analysis
Benchmarks
Trends
Should-Cost
Indexation
Landed Cost
Commercial Terms
Deliverables
Brand Analysis
Positioning & Value Prop
Share & Presence
Customer Evidence
Go-to-Market
Digital & Reputation
Compliance & Trust
KPIs & Gaps
Outputs
Full Research Suite comprises of:
Market outlook & trends analysis
Interviews & case studies
Strategic recommendations
Vendor profiles & capabilities analysis
5-year forecasts
8 regions and 60+ country-level data splits
Market segment data splits
12 months of continuous data updates
DELIVERED AS:
PDF EXCEL ONLINE
Wireless Charging Market Analysis 2025 to 2035 by Technology, Industry Vertical & Region
Wireless Ev Charging Market Size and Share Forecast Outlook 2025 to 2035
Wireless Refrigerant Charging Scale Market Size and Share Forecast Outlook 2025 to 2035
Demand for Wireless Refrigerant Charging Scale in UK Size and Share Forecast Outlook 2025 to 2035
Wireless EEG Monitoring System Market Size and Share Forecast Outlook 2025 to 2035
Wireless Hydrometer Market Size and Share Forecast Outlook 2025 to 2035
Wireless HDMI Transmitter and Receiver Market Size and Share Forecast Outlook 2025 to 2035
Wireless Access Point Market Size and Share Forecast Outlook 2025 to 2035
Charging Nitrogen Gas Systems Market Size and Share Forecast Outlook 2025 to 2035
Wireless Video - 2.4/5GHz Market Size and Share Forecast Outlook 2025 to 2035
Wireless Polysomnography Market Size and Share Forecast Outlook 2025 to 2035
Wireless Audio Devices Market Size and Share Forecast Outlook 2025 to 2035
Wireless Communication Technologies In Healthcare Market Size and Share Forecast Outlook 2025 to 2035
Wireless Mesh Network Market Size and Share Forecast Outlook 2025 to 2035
Wireless Sensor Tags Market Size and Share Forecast Outlook 2025 to 2035
Wireless Sensor Network Market Size and Share Forecast Outlook 2025 to 2035
Wireless Power Transmission Market Size and Share Forecast Outlook 2025 to 2035
Wireless Home Security Camera Market Size and Share Forecast Outlook 2025 to 2035
Wireless Testing Market Size and Share Forecast Outlook 2025 to 2035
Wireless Power Bank Market Size and Share Forecast Outlook 2025 to 2035

Thank you!
You will receive an email from our Business Development Manager. Please be sure to check your SPAM/JUNK folder too.
Chat With
MaRIA