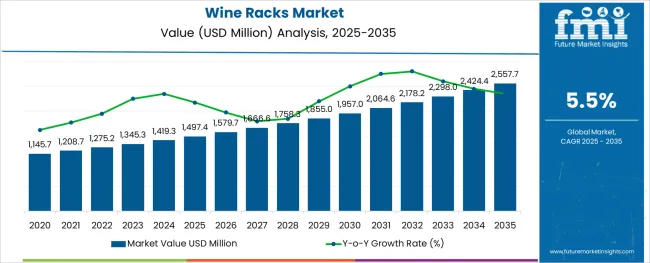
The Wine Racks Market is estimated to be valued at USD 1497.4 million in 2025 and is projected to reach USD 2557.7 million by 2035, registering a compound annual growth rate (CAGR) of 5.5% over the forecast period.
The wine racks market is undergoing steady growth as consumer inclination toward aesthetic storage solutions, rising wine consumption, and interior décor trends converge to shape demand. Increased awareness of proper wine storage techniques and a desire to showcase collections within homes and commercial spaces have driven adoption of innovative and functional rack designs.
Manufacturers are focusing on materials and modular configurations that align with both traditional craftsmanship and contemporary tastes, enhancing the appeal of the products. Future expansion is expected to benefit from premiumization trends in wine culture, a growing hospitality sector, and an increasing preference for customized and space-efficient storage options.
The combination of functional necessity and decorative value continues to create opportunities, with strategic innovations in materials and product formats paving the way for market maturity and deeper penetration across both residential and commercial segments.
The market is segmented by Material, Product Type, Application, and Technology and region. By Material, the market is divided into Wood, Metal, and Plastic. In terms of Product Type, the market is classified into Free Standing, Walk-in Cellars, Built-in, and Countertop. Based on Application, the market is segmented into Residential, Restaurants, Hotels, Wine Retail Stores, and Supermarket. By Technology, the market is divided into Electric and Compressed. Regionally, the market is classified into North America, Latin America, Western Europe, Eastern Europe, Balkan & Baltic Countries, Russia & Belarus, Central Asia, East Asia, South Asia & Pacific, and the Middle East & Africa.
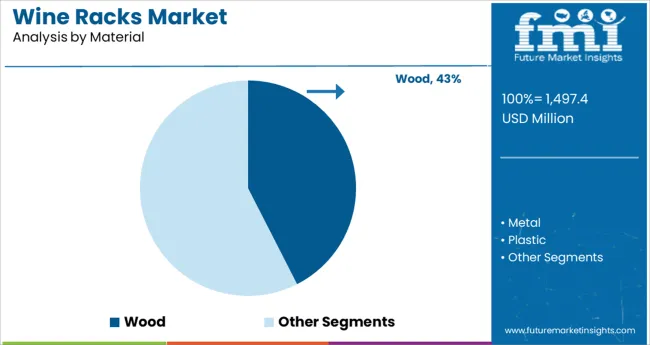
When segmented by material, wood is expected to hold 42.5% of the wine racks market revenue in 2025, establishing itself as the leading material segment. This dominance has been supported by the inherent aesthetic appeal, durability, and craftsmanship associated with wooden racks, which have made them the preferred choice for both traditional and modern settings.
The versatility of wood in accommodating various finishes, colors, and designs has enabled alignment with diverse interior themes, reinforcing its popularity. Manufacturers have capitalized on the ability of wood to convey premium quality and warmth, which resonates with consumers seeking to create a refined ambiance for their wine collections.
Additionally, the availability of sustainable and responsibly sourced wood materials has enhanced its desirability among environmentally conscious buyers, further solidifying its leadership position in the market.
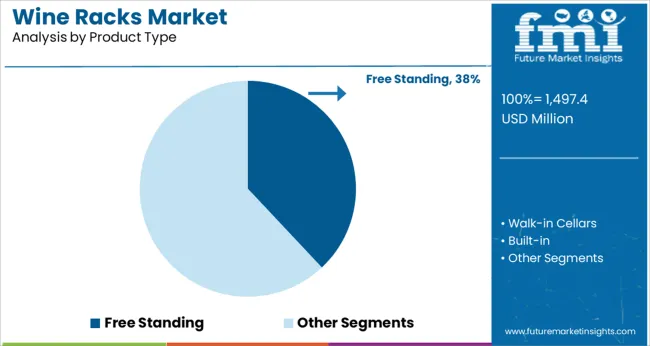
Segmenting by product type reveals that free standing racks are projected to account for 38.0% of the market revenue in 2025, making it the foremost product type. This leadership has been reinforced by the flexibility and convenience that free standing racks offer, allowing consumers to place them in a variety of settings without structural modifications.
The ease of relocation and adaptability to different spaces have increased their appeal among both homeowners and businesses looking for practical storage solutions. Moreover, free standing designs often accommodate larger capacities and creative layouts, enhancing their functional and decorative roles.
Manufacturers have been innovating within this segment by introducing modular, expandable, and customizable options that cater to evolving consumer preferences, thereby strengthening its position as the most sought-after product type in the market.
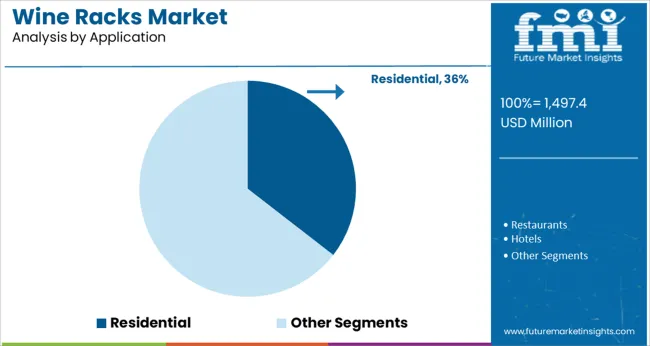
When segmented by application, residential usage is forecast to capture 35.5% of the market revenue in 2025, securing its place as the leading application segment. This prominence has been driven by growing wine culture at home, where consumers are investing in personal collections and seeking appropriate storage solutions to preserve quality and enhance presentation.
The increasing trend of integrating wine racks into kitchen, dining, and living spaces has contributed to their widespread adoption in residential settings. The demand for aesthetically pleasing and space-efficient storage options has encouraged innovation in design and materials, catering specifically to homeowners’ needs.
The emotional value attached to showcasing wine as part of lifestyle and décor has further fueled growth in this segment, establishing it as the primary driver of demand within the wine racks market.
The global demand for wine racks grew at 4.5% CAGR during the historical period from 2020 to 2025 and totaled a valuation of USD 1,275.2 Million by the end of 2025.
However, with rising consumption of wine and increasing adoption of wine racks across restaurants, hotels, wine retail stores, and residential homes, the overall sales of wine racks are poised to rise at 5.5% CAGR between 2025 and 2035.
Wine racks are unique solutions used for storing wine bottles across various end-use sectors. They are generally made from materials like wood, plastic, and metals and allow users to conveniently store wine and preserve its natural aroma and flavor. They are easy to use and install, help to save space, and reduce the chances of dry corks.
Various factors are spurring the growth of the wine racks market. One such factor is the increasing popularity of wine as a drink around the world. Another is the increasing number of households that are purchasing wine racks as part of their home decor.
Similarly, the rapid rise in the number of wineries, restaurants, and wine retail stores is expected to boost the global market for wine racks during the next ten years. The adoption of wine racks across restaurants, hotels, and wine retail stores not only helps these end users to store and protect wine but also enhances the appearance of the wines. This in turn helps them to attract more and more customers.
A number of influential factors have been identified that are expected to spur growth in the global wine racks market during the projection period (2025 to 2035). Besides the proliferating aspects prevailing in the market, the analysts at FMI have also analyzed the restraining elements, lucrative opportunities, and upcoming threats that can somehow influence wine rack sales.
The drivers, restraints, opportunities, and threats (DROTs) identified are as follows:
DRIVERS
RESTRAINTS
OPPORTUNITIES
THREATS
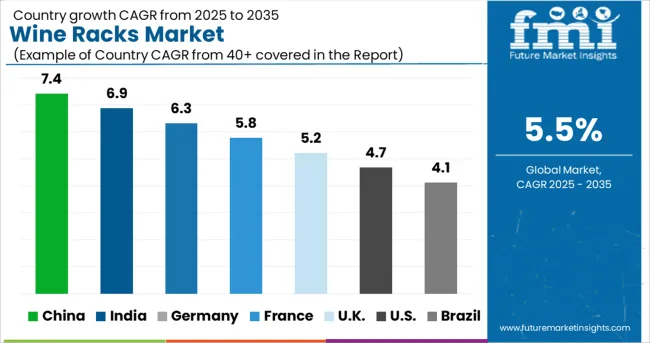
Increasing Wine Consumption Boosting the USA Market
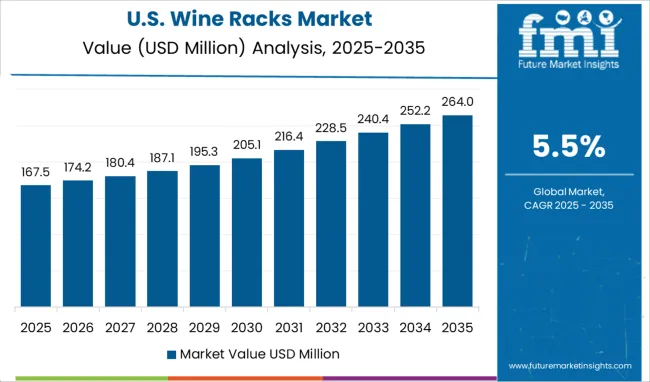
The USA wine racks market accounted for around 33.3% of the global market and it is expected to reach a valuation of USD 1497.4.0 Million in 2025. This can be attributed to the rapid expansion of the wine industry, the increasing number of wineries, a growing interest in wine among consumers, and the rising need for more efficient storage and display options.
Wine consumption across the USA has increased significantly during the last few years and the trend is likely to continue during the forecast period. According to the Wine Institute, the total wine consumption per resident reached 3.18 gals in 2024. This high consumption of wine is creating a conducive environment for the growth of the market for wine racks in the country.
Rising Adoption Across Households Fuelling Sales in the UK
The UK wine racks market is expected to grow at a 6.0% CAGR between 2025 and 2035. This growth can be attributed to the increasing popularity of wine as a drink choice among British consumers. In addition, the growing trend of entertaining at home has also helped to boost demand for wine racks and other storage solutions.
People in the UK are showing a keen inclination toward installing wine racks in their homes for storing wine products for longer durations. This is acting as a catalyst triggering sales of wine racks in the market and the trend is expected to continue during the next ten years.
Growing Number of Restaurants and Wine Retail Stores Propelling Demand in China
As per FMI, China’s wine racks market will grow at 6.2% CAGR during the forecast period (2025 to 2035). There are many reasons why China is emerging as a promising market for wine racks. One reason is the population explosion in the country.
With over 1.3 billion people, there is a huge potential market for wine consumption in China. Hence, there has been a rapid surge in the number of restaurants, hotels, wine retail stores, and supermarkets which are the primary end users of wine racks.
Additionally, the Chinese economy has been growing rapidly in recent years, which has led to an increase in disposable income and a corresponding increase in demand for luxury goods like wine.
Finally, the Chinese government has been supportive of the wine industry, investing heavily in promotion and infrastructure development. This has made China an increasingly attractive market for foreign investors and has helped to spur growth in the sector.
Availability of Innovative Wine Racks Facilitating Market Expansion in Germany
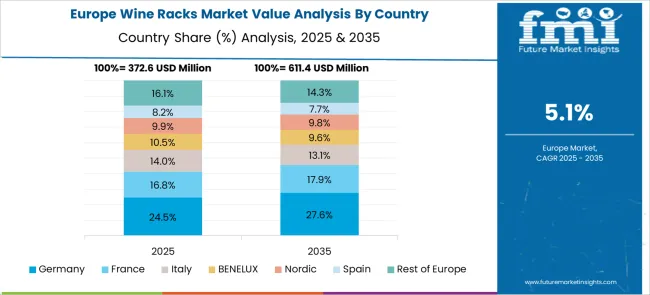
The German wine racks market is expected to surpass a valuation of USD 305.4 Million in 2025 and it will account for around 22.7% share of the global market by the end of 2025. This can be attributed to the easy availability of a wide range of innovative products, the presence of leading players, and the rapid expansion of end-use sectors.
Leading manufacturers based in Germany have developed a number of unique wine racks that are perfect for any home or business. Germany's wine racks are designed to keep wine bottles safe and secure, while also allowing to display of wine collections in a stylish way. They are being increasingly installed across residential and commercial sectors.
Wood Remains the Most Preferred Material
There are many different types of wine racks available in the market today. These products are mostly made from materials like wood, metal, and plastic. Each type has its own unique set of benefits and drawbacks.
However, wood remains the most commonly used material for making wine racks. This can be attributed to the rising end-user preference for wooden wine racks.
Wooden wine racks are typically made from oak or mahogany and can be stained or left natural. They are very durable and easy to care for. As a result, they are gaining wider popularity across end-user sectors.
Free Standing Racks to be the Top Selling Product Type
Based on product type, the global wine racks market is segmented into free-standing, walk-in cellars, and built-in, countertops.
As per FMI, the free-standing racks segment is anticipated to generate maximum revenues during the forecast period. This is because free-standing wine racks are becoming more and more popular with customers who stalk wine bottles in large amounts.
Manufacturers are providing free-standing wine racks that are rust-free and can withstand heavy weight. These cabinets are custom-made to complement the existing home decor.
Electric Wine Racks to be the Most Preferred Among End Users
Based on technology, the electric segment is expected to grow at a significant pace during the next ten years owing to the rising adoption of electric wine racks across various end-use sectors.
An electric wine rack is a type of machinery that helps to store and protect wine bottles. It typically consists of a system of shelves, racks, or bins that are designed to keep the bottles securely in place. In some cases, the electric wine racks may also include a cooling system to help keep the wine at the ideal temperature for storage. This type of equipment is typically used in restaurants, bars, and other commercial establishments.
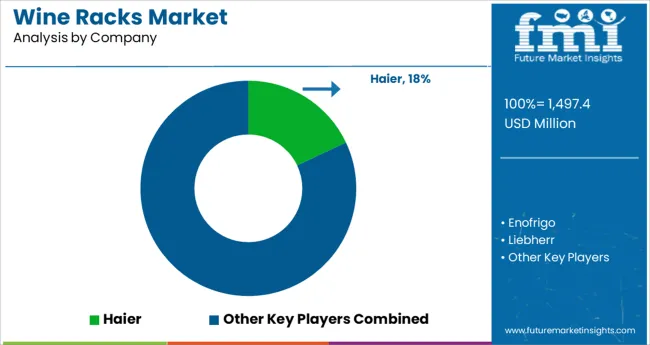
Leading players in the market for wine racks are employing various strategies such as new product launches, mergers, acquisitions, collaborations, partnerships, and strengthening distribution channels to increase their sales and gain a competitive edge in the market. For instance,
| Attribute | Details | |
|---|---|---|
| Estimated Market Size (2025) |
|
|
| Projected Market Size (2035) | USD 2557.7 million | |
| Anticipated Growth Rate (2025 to 2035) | 5.5% CAGR | |
| Forecast Period | 2025 to 2035 | |
| Historical Data Available for | 2020 to 2025 | |
| Market Analysis | million for Value and Units for Volume | |
| Key Regions Covered | North America; Latin America; Europe; Asia Pacific; Oceania; Middle East and Africa (MEA) | |
| Key Countries Covered | USA, Canada, Mexico, Germany, UK, France, Italy, Spain, China, Japan, India, South Korea, Australia, Brazil, Argentina, South Africa, UAE | |
| Key Segments Covered | Material, Product Type, Application, Technology, Region | |
| Key Companies Profiled | HAIER; Enofrigo; Liebherr; Danby; PERLICK; Eurocave; Electrolux; Avanti; SUB-ZERO; EDGESTAR | |
| Report Coverage | Company Share Analysis, Drivers, Restraints, Opportunities and Threats Analysis, Market Dynamics and Challenges, Strategic Growth Initiatives, Market Forecast, Competitive Landscape, |
The global wine racks market is estimated to be valued at USD 1,497.4 million in 2025.
It is projected to reach USD 2,557.7 million by 2035.
The market is expected to grow at a 5.5% CAGR between 2025 and 2035.
The key product types are wood, metal and plastic.
free standing segment is expected to dominate with a 38.0% industry share in 2025.


Full Research Suite comprises of:
Market outlook & trends analysis
Interviews & case studies
Strategic recommendations
Vendor profiles & capabilities analysis
5-year forecasts
8 regions and 60+ country-level data splits
Market segment data splits
12 months of continuous data updates
DELIVERED AS:
PDF EXCEL ONLINE
Wine Packaging Market Size and Share Forecast Outlook 2025 to 2035
Wine Bag Market Forecast and Outlook 2025 to 2035
Wine Cork Market Size and Share Forecast Outlook 2025 to 2035
Wine Barrel Market Size and Share Forecast Outlook 2025 to 2035
Wine Cellar Market Size and Share Forecast Outlook 2025 to 2035
Wine Enzymes Market Analysis Size Share and Forecast Outlook 2025 to 2035
Wine Box Market Size and Share Forecast Outlook 2025 to 2035
Wine Fining Agent Market Size and Share Forecast Outlook 2025 to 2035
Wine, Scotch, and Whiskey Barrels Market Size and Share Forecast Outlook 2025 to 2035
Wine Totes Packaging Market Size and Share Forecast Outlook 2025 to 2035
Wine Fermentation Equipment Market Size and Share Forecast Outlook 2025 to 2035
Wine Processing Equipment Market Size and Share Forecast Outlook 2025 to 2035
Wine Filling Machine Market Size and Share Forecast Outlook 2025 to 2035
Wine Bottle Sterilizer Market Size and Share Forecast Outlook 2025 to 2035
Wine Extract Market Size and Share Forecast Outlook 2025 to 2035
Wine Market Analysis - Size, Share, and Forecast Outlook 2025 to 2035
Wine Tourism Market Analysis - Size, Share, and Forecast Outlook 2025 to 2035
Wine Destemmer Market - Growth & Demand 2025 to 2035
Wine Crusher Market Growth - Winemaking Equipment & Industry Trends 2025 to 2035
Wine Filtering Machine Market Expansion - Filtration & Winemaking Technology 2025 to 2035

Thank you!
You will receive an email from our Business Development Manager. Please be sure to check your SPAM/JUNK folder too.
Chat With
MaRIA