The wildlife tourism market is expanding steadily due to rising interest in nature-based experiences, improved accessibility to wildlife destinations, and growing awareness of ecological conservation. Current dynamics are characterized by an increasing preference for sustainable travel options and diversified tour offerings that integrate education, adventure, and conservation awareness.
Governments and private operators are investing in infrastructure development and wildlife preservation initiatives to enhance visitor engagement while ensuring ecosystem protection. The future outlook indicates robust growth as eco-conscious travelers and adventure seekers continue to drive participation in wildlife experiences across national parks, sanctuaries, and reserves.
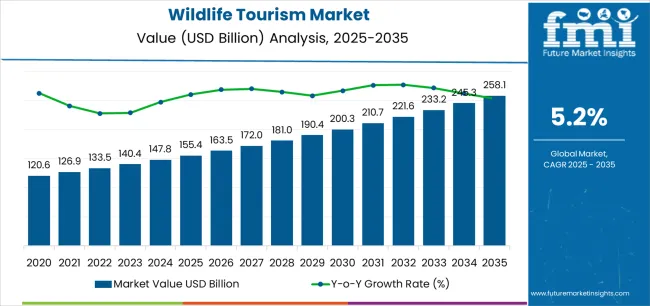
| Metric | Value |
|---|---|
| Wildlife Tourism Market Estimated Value in (2025 E) | USD 155.4 billion |
| Wildlife Tourism Market Forecast Value in (2035 F) | USD 258.1 billion |
| Forecast CAGR (2025 to 2035) | 5.2% |
Market growth is further supported by advancements in guided tour services, digital marketing, and destination management practices that improve tourist satisfaction and safety The overall growth rationale is grounded in expanding disposable incomes, supportive regulatory frameworks promoting responsible tourism, and technological tools enhancing visitor experiences through real-time tracking, virtual booking, and customized itinerary planning.
The market is segmented by Wildlife Tour Types, Age Group, Tourist Type, and Consumer Orientation and region. By Wildlife Tour Types, the market is divided into Forest Wildlife Tours and Marine Wildlife Tours. In terms of Age Group, the market is classified into 26 to 35 Years, 15 to 25 Years, 36 to 45 Years, 46 to 55 Years, and 66 to 75 Years. Based on Tourist Type, the market is segmented into Domestic and International. By Consumer Orientation, the market is divided into Men, Women, and Children. Regionally, the market is classified into North America, Latin America, Western Europe, Eastern Europe, Balkan & Baltic Countries, Russia & Belarus, Central Asia, East Asia, South Asia & Pacific, and the Middle East & Africa.
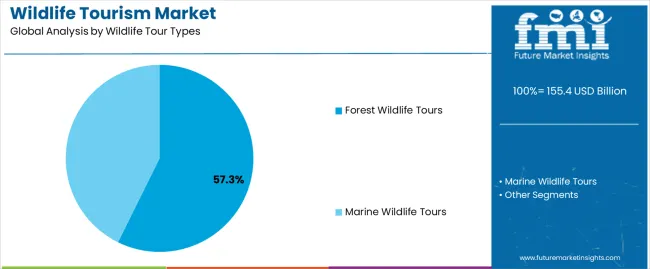
The forest wildlife tours segment, holding 57.3% of the wildlife tour types category, has been leading the market due to its immersive nature and the diversity of flora and fauna it offers to tourists. Demand has been reinforced by the rising popularity of eco-tourism and conservation-driven travel, which emphasize authentic interactions with natural habitats.
Well-maintained forest reserves and national parks have become key attractions, supported by government initiatives and international collaborations for biodiversity conservation. Tour operators have enhanced the overall experience through guided safaris, sustainable lodging, and eco-friendly transportation.
Accessibility improvements and safety protocols have strengthened traveler confidence, while digital platforms promoting responsible tourism have increased visibility for forest tour packages Continued focus on conservation awareness and sustainable tourism practices is expected to sustain this segment’s dominant position and encourage higher participation from both domestic and international travelers.
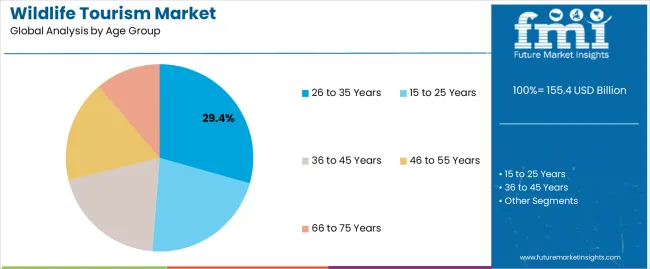
The 26 to 35 years segment, representing 29.4% of the age group category, has emerged as the most active demographic in wildlife tourism. This age group is characterized by high travel enthusiasm, digital connectivity, and a strong inclination toward experiential and adventure-based travel.
The segment’s growth has been driven by increased disposable incomes, work-life balance priorities, and social media influence that promotes wildlife destinations as aspirational travel experiences. Customized tour packages catering to younger travelers, including budget-friendly and sustainable travel options, have enhanced accessibility.
Moreover, flexible travel planning supported by online booking systems and mobile applications has improved convenience for this demographic As awareness of sustainable and ethical tourism continues to rise, the 26 to 35 years age group is expected to remain a key driver of market expansion through repeat visits and advocacy for eco-friendly travel behavior.
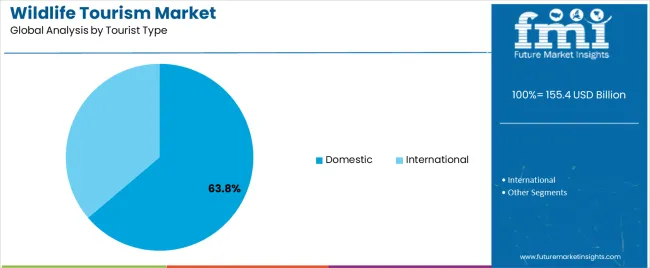
The domestic tourist segment, accounting for 63.8% of the tourist type category, has been leading the market owing to strong local interest in nature exploration and increasing government initiatives promoting domestic tourism. The segment’s dominance is supported by improved transportation networks, regional travel affordability, and the growth of short-haul weekend travel trends.
Domestic travelers have shown heightened interest in visiting protected reserves and wildlife sanctuaries within reachable distances, encouraged by awareness campaigns and favorable tourism policies. Local tour operators have strengthened service quality and safety measures, increasing participation rates across all income levels.
Post-pandemic recovery has also accelerated domestic travel as tourists seek safe, open-air experiences closer to home Continued government investments in eco-lodges, digital booking platforms, and conservation-linked tourism programs are expected to sustain the segment’s leadership and further boost participation in wildlife tourism activities.
Underwater Wildlife Exploration Tourism Gains Popularity in the Market
Underwater wildlife tourism uses technological breakthroughs to provide immersive experiences that allow visitors to explore marine habitats and biodiversity.
Businesses that offer submarines, underwater observatories, and expert diving excursions serve a niche clientele passionate about underwater exploration and marine conservation. This development is consistent with rising consumer interest in adventure wildlife tourism and environmental consciousness, resulting in a higher demand for unique and informative underwater experiences.
Capitalizing on this growing interest, in December 2025, the state government of Gujarat, India, announced its plans to launch India’s first submarine-based underwater tourism facility in Dwarka. The operations are likely to begin by October 2025.
Community-based Tourism Witnesses a Surge in the Market
The demand for community-based wildlife tourism experiences is on the rise, and this trend indicates a strategic connection with ethical and sustainable business practices. Through proactively engaging local communities in tourist endeavors, businesses establish a mutually beneficial partnership that advances conservation efforts and fosters community development.
This approach aligns with the rising customer appetite for ethical and responsible travel while also enhancing the industry's social effect. Businesses can develop strong brand connections, stand out from the competition, and support the long-term viability of wildlife tourism destinations by effectively engaging with local people.
For instance, in March 2025, the Kathu District Community Development Office initiated a fresh initiative centered around community-based wildlife tourism in Kamala, Thailand. The project intends to raise locals' wages and highlight the region's rich cultural diversity.
Rise of Social Media Platforms is Pivotal for Market Growth
Companies must acknowledge the significant impact that visual material and social media have in promoting wildlife tourism. Using social media channels, promoting user-generated material, and developing specialist photography tours all help brands become more visible and draw in photography enthusiasts.
This strategy promotes organic marketing through social sharing while increasing brand loyalty and consumer involvement. Using influencers to increase business visibility across digital platforms, developing user engagement tactics, and strategically organizing content are necessary to effectively implement photography and social media potential.
| Segment | Forest (Wildlife Tour Type) |
|---|---|
| Value Share (2025) | 59.40% |
Based on wildlife tour type, the forest segment holds than 59.40% of the wildlife tourism market shares in 2035.
The demand for forest wildlife tourism is prominent mostly due to the large appeal of premier destinations. Nature-based tourism like the Yellowstone National Park in North America, African savannah and rainforests, and other attract a lot of tourists each year.
Because of their critical role in protecting species, forests are a wise choice for tourism-related initiatives. Engaging in forest-based wildlife excursions gives tourists a feeling of purpose and draws in socially aware visitors by directly sponsoring conservation efforts and research projects.
For photographers and birdwatchers, forests are perfect locations. There are plenty of chances to capture special moments because of the diversified landscapes, rich flora and animals, and potential to observe uncommon bird species. The increasing demand for excursions centered around forests can be attributed to the increased interest of wildlife photography and bird watching.
| Segment | International (Tourist Type) |
|---|---|
| Value Share (2025) | 53.00% |
Based on tourist type, the international segment captured 53.00% of market shares in 2025.
Improving global connection and transport networks have made international travel simpler, allowing tourists to visit various wildlife locations. Improved air routes, airport facilities, and ground transit choices have lowered travel restrictions and broadened the scope of international wildlife tourism.
In an age of social media and mainstream tourism, tourists are increasingly seeking unique and original experiences. Increase in disposable income in various parts of the world have allowed more individuals to participate in foreign travel experiences, such as wildlife tourism. As disposable incomes increase, tourists are ready to devote a bigger percentage of their incomes to deep and unforgettable wildlife encounters overseas.
| Countries | Value CAGR (2025 to 2035) |
|---|---|
| United States | 5.30% |
| Germany | 5.70% |
| Japan | 5.30% |
| China | 8.40% |
| India | 7.40% |
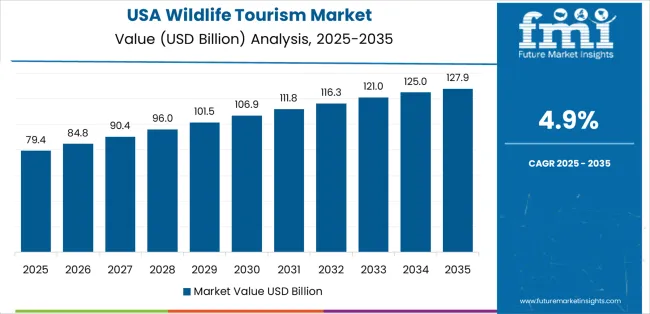
The demand for wildlife tourism in the United States is predicted to surge at a 5.30% CAGR through 2035.
The wildlife tourism industry in the United States is experiencing an increase in multi-destination packages that provide various wildlife encounters. Tour operators and travel companies are carefully creating itineraries that highlight a diverse range of ecosystems to provide travelers with a thorough and enticing wildlife trip.
Wildlife tourism firms in the United States use unique marketing and branding methods for distinguishing themselves and attracting visitors. Businesses use digital marketing platforms, experiential branding strategies, and strategic alliances with influencers and travel bloggers to increase brand awareness and appeal to specific groups. This helps in driving market expansion.
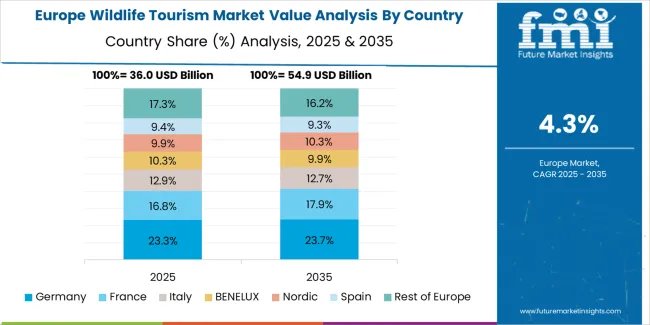
Wildlife tourism market growth in Germany is estimated at a 5.70% CAGR through 2035.
Initiatives promoting sustainable tourism, such as wildlife tourism, receive significant support from the German government. Policies that place a high priority on conservation, sustainable growth, and environmental preservation foster the kind of regulatory atmosphere that makes market expansion possible. Growth in the industry is fueled by government grants, subsidies, and incentives that push companies to participate in animal conservation and eco-friendly activities.
Germany is a popular destination for wildlife tourism because of its advantageous geographic position and various habitats. There are several biodiversity hotspots in the country, including national parks, natural reserves, and UNESCO World Heritage sites, which provide lots of chances to see animals.
Businesses profit from the popularity of these locations by utilizing their natural resources to draw visitors from both domestic and foreign countries who are looking for up-close experiences with nature.
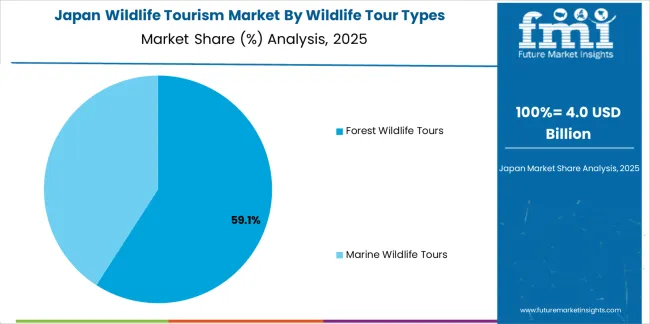
Wildlife tourism demand in Japan is projected to rise at a 5.30% CAGR through 2035.
Numerous rare and indigenous animal species are often found across the archipelago of Japan. The abundance of iconic species like as the red-crowned crane, Japanese serow, and Japanese macaque adds a unique charm to wildlife tourism offers. Companies take advantage of this diversity by creating customized trips that highlight Japan's distinctive wildlife and satisfy the increasing desire for unique wildlife experiences.
Event-driven wildlife tourism in Japan is fueled by the country's unique seasons and the presence of seasonal natural occurrences, such snow monkey bathing and cherry blossom gazing. Businesses that provide wildlife tourism take advantage of these natural occurrences by creating themed tours and seasonal packages that align with the peak times for wildlife activities. Seasonality gives the market additional drive and promotes steady revenue all year round.
Wildlife tourism market growth in China is estimated at an 8.40% CAGR through 2035.
China's persistent infrastructural development and improved access to isolated wildlife sites increase the accessibility and appeal of wildlife tourism activities. Investments in transport networks, accommodation, and tourist amenities make it easier for travelers to visit natural reserves, national parks, and animal habitats.
China's domestic vacation marketing programs and regional development plans are helping to develop the wildlife tourism industry. The government promotes domestic tourism to lesser-known places, including as rural districts and natural reserves, through incentives, infrastructure investment, and marketing efforts.
The demand for wildlife tourism in India is anticipated to surge at a 7.40% CAGR through 2035.
India is famous for numerous ecosystems, which include thick forests, huge grasslands, and coastal areas. The presence of several animal species, particularly the Royal Bengal tigers, Asiatic lions, and elephants, provides a unique advantage for wildlife tourism firms. Businesses capitalize on India's biodiversity hotspot designation to offer distinctive wildlife experiences, drawing both domestic and foreign tourists.
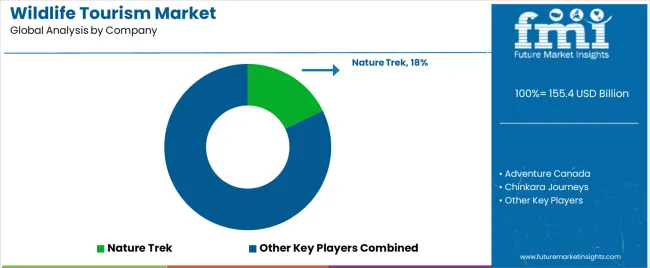
The competitive environment of the wildlife tourism market is defined by a dynamic interaction of numerous firms vying for market share in this rapidly growing domain. Tour operators and travel firms play an important role in organising personalized wildlife encounters for discriminating travellers. These operators differentiate themselves by creating unique, immersive itineraries that appeal to a wide range of tourist interests, from luxury safaris to low-cost tours.
Recent Developments
The global wildlife tourism market is estimated to be valued at USD 155.4 billion in 2025.
The market size for the wildlife tourism market is projected to reach USD 258.1 billion by 2035.
The wildlife tourism market is expected to grow at a 5.2% CAGR between 2025 and 2035.
The key product types in wildlife tourism market are forest wildlife tours and marine wildlife tours.
In terms of age group, 26 to 35 years segment to command 29.4% share in the wildlife tourism market in 2025.


Our Research Products

The "Full Research Suite" delivers actionable market intel, deep dives on markets or technologies, so clients act faster, cut risk, and unlock growth.

The Leaderboard benchmarks and ranks top vendors, classifying them as Established Leaders, Leading Challengers, or Disruptors & Challengers.

Locates where complements amplify value and substitutes erode it, forecasting net impact by horizon

We deliver granular, decision-grade intel: market sizing, 5-year forecasts, pricing, adoption, usage, revenue, and operational KPIs—plus competitor tracking, regulation, and value chains—across 60 countries broadly.

Spot the shifts before they hit your P&L. We track inflection points, adoption curves, pricing moves, and ecosystem plays to show where demand is heading, why it is changing, and what to do next across high-growth markets and disruptive tech

Real-time reads of user behavior. We track shifting priorities, perceptions of today’s and next-gen services, and provider experience, then pace how fast tech moves from trial to adoption, blending buyer, consumer, and channel inputs with social signals (#WhySwitch, #UX).

Partner with our analyst team to build a custom report designed around your business priorities. From analysing market trends to assessing competitors or crafting bespoke datasets, we tailor insights to your needs.
Supplier Intelligence
Discovery & Profiling
Capacity & Footprint
Performance & Risk
Compliance & Governance
Commercial Readiness
Who Supplies Whom
Scorecards & Shortlists
Playbooks & Docs
Category Intelligence
Definition & Scope
Demand & Use Cases
Cost Drivers
Market Structure
Supply Chain Map
Trade & Policy
Operating Norms
Deliverables
Buyer Intelligence
Account Basics
Spend & Scope
Procurement Model
Vendor Requirements
Terms & Policies
Entry Strategy
Pain Points & Triggers
Outputs
Pricing Analysis
Benchmarks
Trends
Should-Cost
Indexation
Landed Cost
Commercial Terms
Deliverables
Brand Analysis
Positioning & Value Prop
Share & Presence
Customer Evidence
Go-to-Market
Digital & Reputation
Compliance & Trust
KPIs & Gaps
Outputs
Full Research Suite comprises of:
Market outlook & trends analysis
Interviews & case studies
Strategic recommendations
Vendor profiles & capabilities analysis
5-year forecasts
8 regions and 60+ country-level data splits
Market segment data splits
12 months of continuous data updates
DELIVERED AS:
PDF EXCEL ONLINE
Wildlife Health Market Size and Share Forecast Outlook 2025 to 2035
Tourism Independent Contractor Model Market Size and Share Forecast Outlook 2025 to 2035
Tourism Industry Analysis in Japan - Size, Share, & Forecast Outlook 2025 to 2035
Tourism Market Trends – Growth & Forecast 2025 to 2035
Tourism Industry Big Data Analytics Market Analysis by Application, by End, by Region – Forecast for 2025 to 2035
Assessing Tourism Industry Loyalty Program Market Share & Industry Trends
Tourism Industry Loyalty Programs Sector Analysis by Program Type by Traveler Profile by Region - Forecast for 2025 to 2035
Market Share Insights of Tourism Security Service Providers
Tourism Security Market Analysis by Service Type, by End User, and by Region – Forecast for 2025 to 2035
Competitive Overview of Geotourism Market Share
Geotourism Market Insights - Growth & Trends 2025 to 2035
Global Ecotourism Market Insights – Growth & Demand 2025–2035
Agritourism Market Size and Share Forecast Outlook 2025 to 2035
Art Tourism Market Analysis by, by Service Category, by End, by Booking Channel by Region Forecast: 2025 to 2035
Analyzing War Tourism Market Share & Industry Leaders
War Tourism Market Insights - Size, Trends & Forecast 2025 to 2035
Dark Tourism Market Forecast and Outlook 2025 to 2035
Food Tourism Sector Market Size and Share Forecast Outlook 2025 to 2035
Wine Tourism Market Analysis - Size, Share, and Forecast Outlook 2025 to 2035
Film Tourism Industry Analysis by Type, by End User, by Tourist Type, by Booking Channel, and by Region - Forecast for 2025 to 2035

Thank you!
You will receive an email from our Business Development Manager. Please be sure to check your SPAM/JUNK folder too.
Chat With
MaRIA