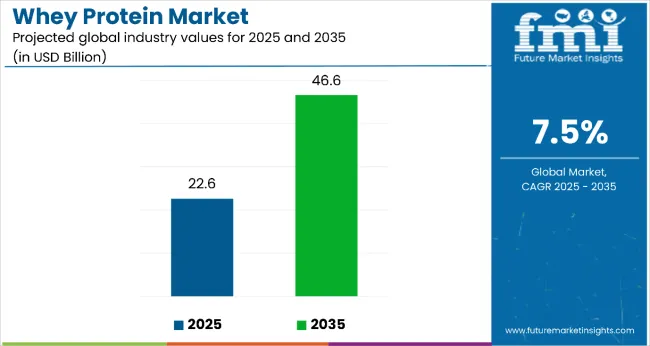
The whey protein market is estimated to be valued at USD 22.6 billion in 2025 and is projected to reach USD 46.6 billion by 2035, registering a CAGR of 7.5% over the forecast period. The market is projected to add an absolute dollar opportunity of USD 23.1 billion over the forecast period. This reflects a 2.06 times growth at a compound annual growth rate of 7.5%. The market's evolution is expected to be shaped by rising demand for high-protein diets in sports nutrition, dietary supplements, and functional foods, particularly where muscle building and weight management benefits are required.
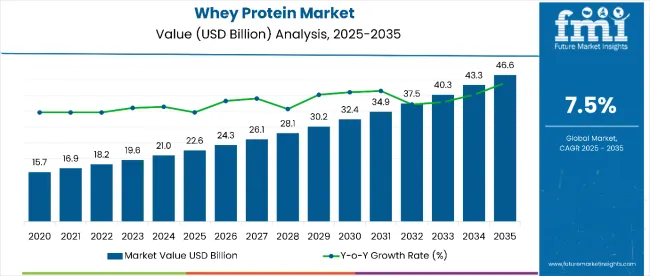
By 2030, the market is likely to reach approximately USD 31.4 billion, accounting for USD 9.6 billion in incremental value over the first half of the decade. The remaining USD 13.5 billion is expected during the second half, suggesting a moderately back-loaded growth pattern. Product innovation in protein concentrates and isolates is gaining traction due to whey protein's favorable amino acid profile and bioavailability properties.
Companies such as Glanbia and Hilmar Cheese Company are advancing their competitive positions through investment in processing technologies and scalable filtration systems. Quality-driven procurement models are supporting expansion into functional beverages, protein bars, and nutritional supplements. Market performance will remain anchored in regulatory compliance, protein purity standards, and nutritional efficacy benchmarks.
The market holds approximately 65% of the dairy protein market, driven by its superior biological value, complete amino acid profile, and rapid absorption properties. It accounts for around 45% of the sports nutrition ingredients market, supported by its muscle-building efficacy and performance enhancement benefits. The market contributes nearly 38% to the functional food proteins market, particularly for protein fortification in beverages, bars, and supplements. It holds close to 28% of the weight management ingredients market, where whey proteins are used for satiety and lean muscle preservation. The share in the infant nutrition market reaches about 15%, reflecting its use in specialized formulas and growing-up milks for enhanced protein quality.
The market is undergoing structural change driven by rising demand for clean-label and natural protein sources. Advanced processing methods using membrane filtration and spray-drying technologies have enhanced protein concentration, reduced lactose content, and improved solubility, making whey protein more versatile for food and beverage applications. Manufacturers are introducing flavored protein powders and ready-to-drink formats tailored for convenience and taste preferences, expanding their role beyond traditional supplements.
Whey protein's complete amino acid profile, high biological value, and rapid absorption make it an attractive choice for health-conscious consumers, athletes, and fitness enthusiasts seeking optimal nutrition and performance benefits.
Growing awareness of protein's role in muscle synthesis, weight management, and healthy aging is further propelling adoption, especially among millennials and older adults prioritizing wellness. Government support for dairy industry development, along with innovations in processing technology, are also enhancing product quality and application versatility.
As fitness culture expands globally and protein consumption becomes mainstream, the market outlook remains favorable. With consumers and manufacturers prioritizing functional nutrition, clean-label ingredients, and convenient formats, whey protein is well-positioned to expand across various food, beverage, and supplement applications.
The market is segmented into product type, nature, end use, and region. By product type, the market is divided into concentrate (WPC 35, WPC 80), isolate, and hydrolysates. Based on nature, the market is bifurcated into organic and conventional. In terms of end use, the market is classified into infant formula and baby foods, dietary supplements, food processing, sports nutrition, beverages, and others (bakery products, confectionery, and medical nutrition). Regionally, the market is characterized into North America, Latin America, Europe, East Asia, South Asia, Oceania, and the Middle East & Africa.
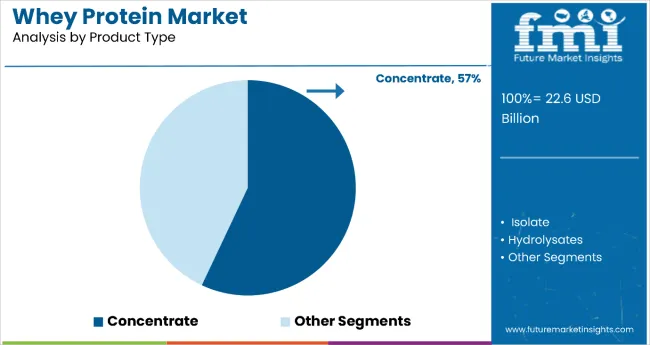
The concentrate segment dominates the whey protein market with 57% of the global market share, led by its cost-effectiveness, broad availability, and balanced nutritional profile. WPC 80 offers higher commercial value than WPC 35 due to its superior protein content (~80%), enhanced solubility, and preferred use in sports nutrition and dietary supplements.
Concentrates retain key bioactive compounds like lactoferrin and immunoglobulins, making them attractive for use in infant formula, bakery, and ready-to-drink applications. Their affordability and formulation flexibility allow penetration into both premium and budget segments.
While isolates and hydrolysates are gaining traction in specialized health niches, concentrates continue to be the primary revenue driver due to their strong global demand across both mature and emerging economies. Manufacturers leverage the segment's scalability and application breadth to maintain growth and profitability.
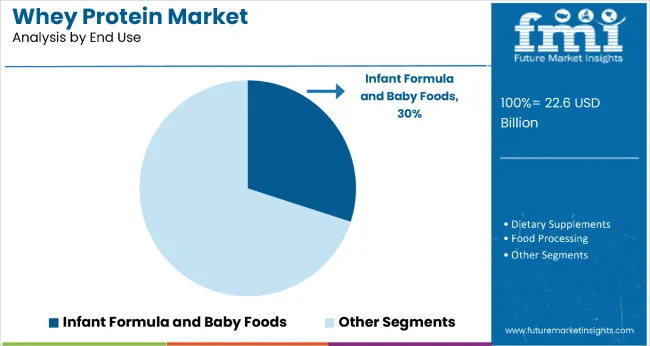
Infant formula and baby foods represent the most lucrative end-use segment in the global whey protein market, with a 30% market share. The segment benefits from whey protein’s nutritional similarity to human milk, rapid digestibility, and essential amino acid profile.
Its growth is driven by rising urbanization, growing female workforce participation, and increased disposable incomes, especially in emerging markets like China, India, and Brazil.
Looking forward, premiumization through organic labeling, clean-label claims, and enhanced functional attributes (e.g., DHA, probiotics) will shape product innovation. Expansion into toddler nutrition and follow-on formulas will further broaden the revenue potential in this segment.
In 2024, the global whey protein market saw strong integration with functional beverage platforms, as ready-to-drink protein beverages became prominent in convenience retail, enabling on-the-go nutrition and expanding beyond traditional supplement channels. By 2025, this shift allowed manufacturers of shelf-stable, flavored whey beverages to secure recurring revenue and penetrate mainstream grocery and convenience sectors.
Key drivers include increasing demand for high-quality protein, rising health awareness, and growing incorporation into functional food formats. Restraints relate to pricing volatility, plant-based competition, and supply chain pressure. Key trends highlight the evolution of whey protein from a supplement to a multifunctional food ingredient in bars, breakfast items, and meal replacements, enabling expansion across diverse consumer categories.
Key Drivers Fueling Whey Protein Market Expansion
Rising health consciousness and the need for functional, high-quality protein are primary drivers of whey protein demand. In 2024, heightened attention to immune support and muscle preservation led consumers and healthcare professionals to include whey protein in daily wellness routines.
By 2025, fitness centers and nutritionists increasingly recommended whey for weight management, sports recovery, and healthy aging. Demand is supported by urban lifestyles, greater protein awareness, and its complete amino acid profile, making whey a preferred choice in supplements, beverages, and fortified foods.
Major Restraints Challenging Whey Protein Market Development
The whey protein market faces challenges linked to raw material pricing, rising competition from plant-based proteins, and specialized processing infrastructure. Fluctuating milk prices impact whey production economics, while the need for advanced filtration, flavor masking, and solubility enhancement adds to development costs.
Additionally, plant-based alternatives such as pea, soy, and rice proteins are capturing share among vegan and lactose-intolerant consumers. Regulatory pressures and sustainability concerns regarding dairy sourcing also influence procurement and long-term strategic planning for manufacturers.
Emerging Key Trends Influencing Whey Protein Market Direction
Whey protein is transitioning into a mainstream functional ingredient across food and beverage categories. In 2025, manufacturers increasingly incorporated whey into high-protein snacks, meal replacements, and breakfast foods to align with consumer demand for convenience and nutrition.
Clean label trends are pushing innovation in natural flavoring, reduced ingredient lists, and minimal processing. Shelf-stable whey beverages and blended nutritional formats are gaining momentum, supported by co-manufacturing partnerships and private-label expansion. The shift from supplement aisles to everyday grocery formats signals a broader lifestyle adoption of whey protein across demographics and regions.
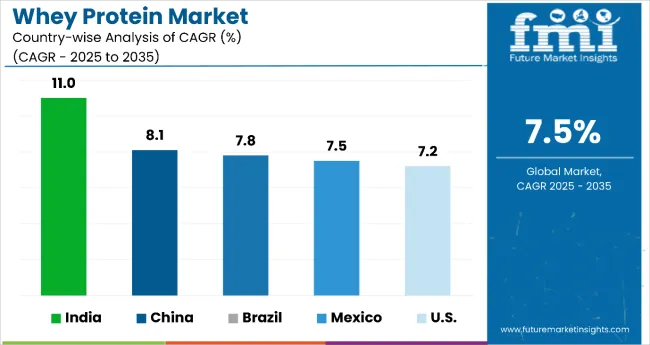
The global whey protein market is projected to grow at a CAGR of 7.5% from 2025 to 2035. China leads with 9.2%, followed by India at 8.7% and Germany at 7.8%. France posts 7.1%, while the United Kingdom records 6.4%. China and India drive demand through expanding fitness culture, rising disposable incomes, and growing awareness of protein supplementation benefits. Germany focuses on premium sports nutrition and functional foods, while France and the UK emphasize clean-label protein products and wellness-oriented consumption patterns.
The report covers an in depth analysis of 40+ countries; five top performing OECD countries are highlighted below.
Whey protein market in India is projected to be the fastest-growing whey protein market globally, expanding at a CAGR of 11%. Growth is driven by rapid fitness industry development, increasing sports participation, and rising awareness of protein deficiency. Domestic dairy companies are investing heavily in whey processing facilities, while international brands are entering through local partnerships.
Whey protein revenue in China is growing at 8.1% CAGR, supported by urbanization, rising middle-class health awareness, and expanding fitness participation. International players are establishing local manufacturing to reduce costs and increase availability, while domestic brands are scaling production. Premium isolates are gaining traction in urban centers, while concentrates dominate price-sensitive markets.
Sales of whey protein in Brazil are forecast to grow at 7.8% CAGR, fueled by a strong sports culture, gym expansion, and health-conscious eating habits. Sports nutrition remains the primary demand driver, with whey protein integrated into functional foods and beverages. Local manufacturers are increasing production while imports from the USA and Europe supplement high-quality supply.
Sales of whey protein in Mexico are set to grow at 7.5% CAGR, driven by fitness lifestyle adoption, functional food innovation, and rising awareness of protein’s role in wellness. Proximity to the USA supports cost-efficient imports and collaboration with North American brands.
The USA whey protein demand remains a mature yet profitable whey protein market, growing at 7.2% CAGR. Innovation in flavors, convenience formats, and functional blends drives continued consumer interest. Sports nutrition, meal replacements, and medical nutrition remain the largest application areas.
The whey protein market is moderately consolidated, led by Glanbia plc with a 14.2% market share. The company holds a dominant position through its integrated dairy processing operations, extensive ingredient portfolio, and strong presence in sports nutrition and clinical applications.
Dominant player status is held exclusively by Glanbia plc. Key players include Hilmar Cheese Company, Fonterra Co-operative Group Ltd, Saputo Inc, Davisco Foods International Inc, Arla Foods, Carbery Group, Leprino Foods Company, Milk Specialties Global, and Alpavit, each providing specialized whey protein ingredients for sports nutrition, food processing, and nutritional supplement applications, supported by advanced processing technologies and quality certifications.
Emerging players are currently limited in this market due to high capital requirements for processing facilities and the dominance of established dairy companies with integrated supply chains. Market demand is driven by rising health consciousness, expanding fitness culture, and growing application of protein ingredients across food and beverage industries.
| Item | Value |
|---|---|
| Quantitative Units | USD 22.6 Billion |
| Product Type | Whey Protein Concentrate ( WPC 35, WPC 80 ), Whey Protein Isolate, and Whey Protein Hydrolysate |
| Nature | Organic and Conventional |
| End Use | Sports Nutrition, Dietary Supplements, Food Processing, Infant Formula, Beverages, and Others (including animal feed, pharmaceutical uses, and medical nutrition) |
| Regions Covered | North America, Europe, East Asia, South Asia, Oceania, Latin America, Middle East & Africa |
| Country Covered | United States, Canada, Germany, France, United Kingdom, China, Japan, India, Brazil, South Africa, Australia, and 40+ countries |
| Key Companies Profiled | Alpavit, Arla Foods, Carbery Group, Davisco Foods International, Inc., Fonterra Co-operative Group Ltd, Glanbia plc, Hilmar Cheese Company, Inc., LACTALIS Ingredients, Leprino Foods Company, Maple Island Inc., Milk Specialties, Milkaut SA, Olam International, Saputo Inc., Wheyco GmbH. |
| Additional Attributes | Dollar sales by product type and end-use sector, growing usage in sports nutrition and clinical applications, stable demand in food processing and infant nutrition, innovations in membrane filtration and flavor systems improve functionality, purity, and consumer acceptance |
The global whey protein market is estimated to be valued at USD 22.6 billion in 2025.
The market size for the whey protein market is projected to reach USD 46.6 billion by 2035.
The whey protein market is expected to grow at a 7.5% CAGR between 2025 and 2035.
The key product types in whey protein market are whey protein concentrate, wpc 35, wpc 80, whey protein isolate and whey protein hydrolysates.
In terms of nature, organic segment to command 37.4% share in the whey protein market in 2025.


Full Research Suite comprises of:
Market outlook & trends analysis
Interviews & case studies
Strategic recommendations
Vendor profiles & capabilities analysis
5-year forecasts
8 regions and 60+ country-level data splits
Market segment data splits
12 months of continuous data updates
DELIVERED AS:
PDF EXCEL ONLINE
Whey Protein Ingredients Market Size and Share Forecast Outlook 2025 to 2035
Whey Protein Isolate Market Growth - Trends & Forecast through 2025 to 2035
Analysis and Growth Projections for Native Whey Protein Market
Native Whey Protein Ingredients Market
Acidified Whey Protein Market Analysis - Size, Share & Trends 2025 to 2035
Hydrolyzed Whey Protein Market Analysis by Product Form, Application, Sales Channel and Region through 2035
Microparticulated Whey Protein Market Analysis by Application, Form & Region Through 2035
Whey Permeate Market Analysis by End user and Packaging Through 2035
Whey Hydrolysates Market
Condensed Whey Market Size and Share Forecast Outlook 2025 to 2035
Demand for Whey Hydrolysates for Medical Nutrition Drinks in CIS Analysis Size and Share Forecast Outlook 2025 to 2035
Demand for Whey-plus-Prebiotic Stacks for RTD Shakes in CIS Analysis Size and Share Forecast Outlook 2025 to 2035
Concentrated Whey Market
Demineralized Whey Powder Market Size, Growth, and Forecast for 2025 to 2035
Demand for RTD Whey Deployments for Shelf-stable Drinks in CIS Size and Share Forecast Outlook 2025 to 2035
Reduced Lactose Whey Market Size and Share Forecast Outlook 2025 to 2035
Demand of No-acid Whey Strained Dairy Processing Concepts in European Union Size and Share Forecast Outlook 2025 to 2035
Demand of Heat Stable Whey for RTD Performance Drinks in EU Size and Share Forecast Outlook 2025 to 2035
Protein-Coating Line Market Forecast Outlook 2025 to 2035
Protein Labelling Market Size and Share Forecast Outlook 2025 to 2035

Thank you!
You will receive an email from our Business Development Manager. Please be sure to check your SPAM/JUNK folder too.
Chat With
MaRIA