Wavelength Division Multiplexing (WDM) Equipment Market Size and Share Forecast Outlook 2025 to 2035

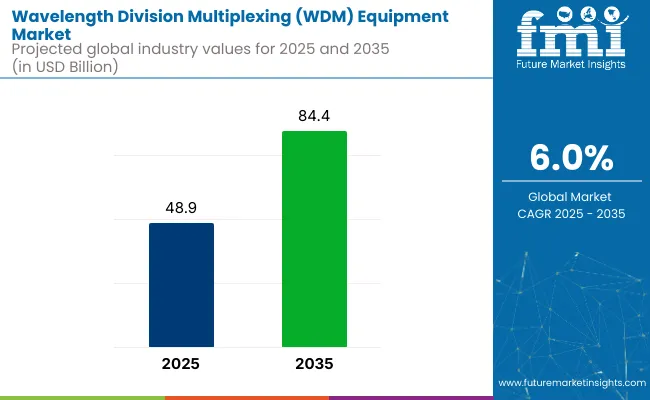
The global wavelength division multiplexing (WDM) equipment market is valued at USD 48.9 billion in 2025 and is expected to reach USD 84.4 billion by 2035, reflecting a CAGR of 6.0%.
Quick Stats for Wavelength Division Multiplexing (WDM) Equipment Market

  • Market Value (2025): USD 48.9 billion
  • Forecast Value (2035): USD 84.4 billion
  • Forecast CAGR: 6.0%
  • Multiplexer Type Leader in 2025: Coarse Wavelength Division Multiplexer (CWDM) (55% Market Share)
  • Top Vertical: IT & Telecom (60% Market Share)
  • Key Growth Region: Asia Pacific (fastest-growing Japanese market with 5.2% CAGR)

Wavelength Division Multiplexing Equipment Market

Metric Value
Estimated Size (2025) USD 48.9 billion
Projected value (2035) USD 84.4 billion
CAGR (2025 to 2035) 6.0%

Growth is being driven by rising data traffic fueled by expanding cloud computing, rapid 5G deployments, and the increasing adoption of AI-driven applications. Additionally, significant investments in high-speed data transmission infrastructure and optical network upgrades across major economies are expected to support market expansion over the forecast period.

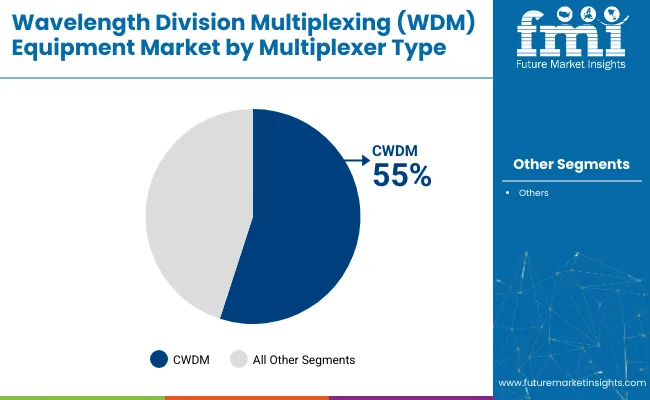
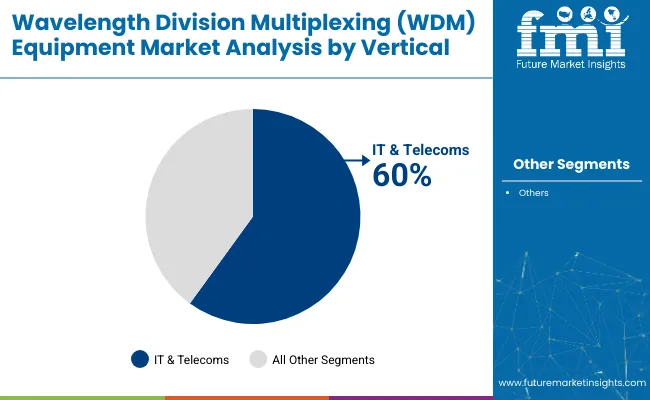
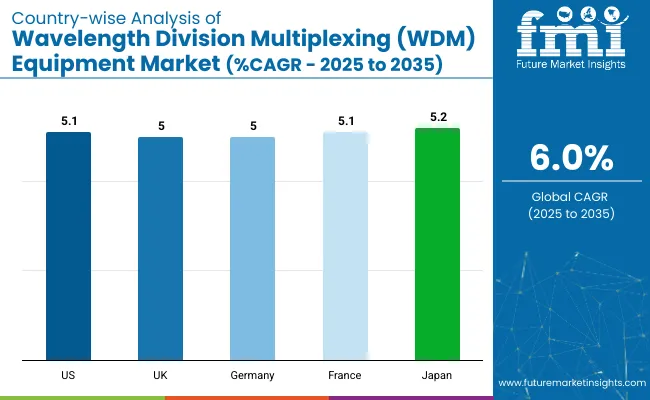
North America is projected to hold the largest market share by 2035 due to significant investments in data center expansions and advanced optical technologies, especially with the USA growing at a robust CAGR of 5.1%. Meanwhile, Japan and France closely follow this rapid growth with CAGRs of 5.2% and 5.1% respectively. Within multiplexer types, CWDM is expected to account for 55% of the market share. The IT and telecom vertical will continue leading the end-use market with 60% of the market share.

The wavelength division multiplexing (WDM) equipment market holds a significant share across its parent markets. In the optical networking equipment market, it accounts for approximately 35-40%, as WDM is essential for maximizing fiber bandwidth. Within the fiber optic communication market, its share is around 25-30%, due to its widespread use in long-haul and metro networks.

It represents about 20% of the telecommunications equipment market, supporting high-capacity data transfer. In data center networking, WDM equipment contributes 15-18%, driven by cloud scalability demands. Overall, WDM technology is a cornerstone of high-speed, scalable, and efficient data transmission across modern network infrastructures.

Looking ahead, the market is expected to be driven by innovations in silicon photonics, terabit-scale WDM solutions, and quantum-secured technologies to address increasing cybersecurity concerns. Partnerships between telecom operators, cloud providers, and technology vendors are anticipated to intensify as companies seek to integrate software-defined optical networks (SDON) for greater scalability and flexibility.

Furthermore, sustainability trends, including the use of energy-efficient and recyclable components, are likely to remain central to future product development and market differentiation. Investments in AI-driven wavelength optimization and automated network management are also expected to accelerate to enhance operational efficiency and reduce latency.

Analyzing Wavelength Division Multiplexing (WDM) Equipment Market by Top Investment Segments

The wavelength division multiplexing (WDM) equipment market is segmented into multiplexer type, vertical and region. By multiplexer type, it is segmented into coarse wavelength division multiplexers (CWDM) and dense wavelength division multiplexers (DWDM).

By vertical, it includes IT & telecoms, healthcare, manufacturing, financial services, and others (including education, retail, logistics), and by region, it covers North America, Latin America, Western Europe, Eastern Europe, South Asia and Pacific, East Asia, Middle East and Africa.

By Multiplexer Type, CWDM Segment holds 55% of the Market Share

The CWDM segment is anticipated to continue holding a dominant share of approximately 55% through 2035. Its growth is being driven by the increasing demand for cost-effective and scalable optical networking solutions in urban and regional networks. The segment’s appeal is underpinned by its simpler design and lower implementation costs compared to DWDM systems, enabling broadband service providers and data centers to expand capacity efficiently, especially in price-sensitive emerging markets.
  • CWDM systems are favoured for metro and access networks.
  • Lower power consumption enhances operational efficiency.
  • Ideal for short to medium distance transmission applications.
  • Demand is supported by rising broadband penetration in Asia-Pacific.

Wavelength Division Multiplexing Equipment Market By Multiplexer Type

By Vertical, the IT & Telecoms Segment Accounts for 60% of the Market Share

The IT & telecoms vertical is projected to account for nearly 60% of the market share by 2035. Growth is being driven by surging demand for high-speed data transmission to support cloud computing, AI applications, and 5G rollout. Telecom operators and data centers continue to upgrade optical infrastructure to accommodate the exponential increase in data traffic while ensuring low latency and scalable network performance.
  • Telecom operators prioritize DWDM for backbone networks.
  • Data centers invest in WDM to enable edge computing.
  • Continuous upgrades aligned with SDN and automation trends.
  • Growing 5G deployments boost segment investments globally.

Wavelength Division Multiplexing Equipment Market Analysis By Vertical

Top Wavelength Division Multiplexing (WDM) Equipment Market Dynamics
Recent Trends in the Wavelength Division Multiplexing (WDM) Equipment Market

  • Increasing adoption of software-defined optical networks (SDON) for improved flexibility and automation.
  • Growing deployment of 400G and 800G coherent optics to meet high data traffic demands.
  • Rising investments in silicon photonics for compact, energy-efficient WDM solutions.
  • Expansion of hybrid optical networks integrating DWDM and CWDM technologies for scalability.

Challenges in the Wavelength Division Multiplexing (WDM) Equipment Market

  • Persistent semiconductor shortages are impacting silicon photonics supply chains.
  • Integration complexity with legacy infrastructure is hindering rapid technology upgrades.
  • High capital expenditure required for advanced WDM system deployments.
  • Regulatory compliance variations across regions are delaying product approvals and installations.

Analyzing Top Countries Manufacturing and Supplying Wavelength Division Multiplexing (WDM) Equipment

Country Wise Analysis Of Wavelength Division Multiplexing Equipment Market

The USA leads the WDM equipment market with robust growth driven by hyperscale data centers, 5G rollout, and strong telecom investments. China follows closely, fueled by aggressive network expansion, urban connectivity projects, and government-backed digital infrastructure initiatives.

Germany and Japan show steady growth, driven by industrial automation, 5G adoption, and enterprise demand for high-speed networks. The UK maintains moderate growth due to cloud service expansion and smart city initiatives. Overall, North America and East Asia dominate WDM adoption due to technological maturity and digital transformation investments, while European countries follow with strong momentum in enterprise and broadband infrastructure upgrades.

The report covers in-depth analysis of 40+ countries; five top-performing OECD countries are highlighted below.

USA Wavelength Division Multiplexing (WDM) Equipment Market Analysis

The WDM equipment market in the USA is projected to grow at a CAGR of 5.1% from 2025 to 2035. Growth is being driven by extensive investments in hyperscale data centers, cloud computing infrastructure expansion, and widespread 5G deployments. Strong technological advancements, coupled with a focus on software-defined networks, continue to position the country as a leader in high-capacity optical networking solutions across the telecom and IT sectors.

  • Accelerated roll-out of 5G networks supporting WDM demand.
  • Robust investments in AI-ready data center infrastructure.
  • Increasing preference for energy-efficient and compact WDM systems.

Wavelength Division Multiplexing (WDM) Equipment Sales Analysis in the UK

The WDM equipment sales in the UK are estimated to grow at a CAGR of 5.0% between 2025 and 2035. Expansion is supported by government initiatives like the National Infrastructure Strategy and the UK Gigabit Program that promote digital infrastructure upgrades. Demand is further enhanced by rapid urbanization, smart city initiatives, and the country’s commitment to sustainable and energy-efficient optical networks.

  • Strong focus on fibre-optic broadband infrastructure upgrades.
  • Government policies encouraging carbon-neutral telecom solutions.
  • Rising integration of WDM systems in IoT-enabled urban networks.

Germany Wavelength Division Multiplexing (WDM) Equipment Market Analysis

The WDM equipment demand in Germany is expected to grow at a CAGR of 5.0% from 2025 to 2035. This is driven by the rapid roll-out of 5G networks and Industry 4.0 initiatives demanding low-latency, high-capacity optical networks. Significant government investments in digital infrastructure, particularly in rural and industrial areas, continue to support market expansion and advanced network deployments.

  • Increasing deployment of DWDM for backbone optical networks.
  • Growing emphasis on sustainable and energy-efficient solutions.
  • Industry 4.0 is driving the adoption of programmable WDM technologies.

Wavelength Division Multiplexing (WDM) Equipment Demand Analysis in France

The WDM equipment market in France is projected to expand at a CAGR of 5.1% between 2025 and 2035. Growth is driven by a strong government focus on digital transformation and fibre-optic broadband expansion, particularly under EU green initiatives. Rising demand for scalable, high-speed optical networks to support AI, cloud computing, and 5G is further fueling market demand in the country.

  • Extensive rural broadband network deployment initiatives.
  • Preference for energy-efficient WDM solutions under EU policies.
  • Strong telecom sector investments in advanced optical systems.

Japan Wavelength Division Multiplexing (WDM) Equipment Market Analysis

The WDM equipment industry in Japan is anticipated to grow at a CAGR of 5.2% from 2025 to 2035. Growth is supported by the country’s mature telecom infrastructure, strong focus on technological innovation, and increasing investments in AI and smart city applications. The market benefits from the demand for compact, cost-efficient, and high-performance WDM systems across dense urban networks.

  • Expansion of 5G and AI-integrated telecom networks.
  • Rising investments in energy-efficient and compact WDM systems.
  • Government support for sustainable digital infrastructure upgrades.

Leading Wavelength Division Multiplexing (WDM) Equipment Suppliers

The WDM equipment market is moderately consolidated, with a few global leaders accounting for a significant share of revenues. Companies such as Huawei Technologies, Ciena Corporation, Nokia, Infinera, and Cisco Systems dominate based on their technological leadership in coherent optics, photonic services, and software-defined optical networking solutions. These firms focus on continuous innovation to enhance bandwidth capacities, reduce latency, and integrate WDM systems into software-defined and automated network architectures.

Company strategies revolve around competitive pricing for emerging markets, partnerships with telecom operators and data centers, and expanding R&D in silicon photonics and terabit-scale systems. Firms like Huawei and ZTE leverage competitive pricing and government-backed projects to expand in Asia and Africa, while Ciena and Nokia invest in advanced 400G/800G solutions to cater to North American and European hyperscale data center deployments. Cisco Systems is prioritizing SDN integration and cloud-ready WDM solutions, whereas Infinera focuses on subsea and long-haul transmission system innovations.

Recent Wavelength Division Multiplexing Equipment Industry News

In February 2025, Juniper Networks partnered with Turkcell to pilot IPoDWDM over 248 km between their data centers.

Wavelength Division Multiplexing (WDM) Equipment Market Report Scope

Report Attributes Details
Current Total Market Size (2025) USD 48.9 billion
Projected Market Size (2035) USD 84.4 billion
CAGR (2025 to 2035) 6.0%
Base Year for Estimation 2024
Historical Period 2020 to 2024
Projections Period 2025 to 2035
Market Analysis Parameters Revenue in USD billions/Volume in Units
By Multiplexer Type Coarse Wavelength Division Multiplexer (CWDM), Dense Wavelength Division Multiplexer (DWDM)
By Vertical IT & Telecoms, Healthcare, Manufacturing, Financial Services, Others (including education, retail, logistics)
Regions Covered North America, Latin America, Western Europe, Eastern Europe, South Asia , Pacific, East Asia, Middle East and Africa
Countries Covered United States, United Kingdom, Germany, France, Japan, South Korea, China, Australia, India, Brazil
Key Players ADTRAN, Inc., Aliathon Technology Ltd, Ciena Corporation, Cisco Systems, Fujitsu Ltd., Huawei Technologies, Infinera , Nokia, ZTE Corporation, ALCATEL-LUCENT, ADVA Optical Networking, FiberHome Networks, Juniper Networks
Additional Attributes Dollar sales by value, market share analysis by segment, region-wise and country-wise analysis

Key Segmentation

By Multiplexer Type:

It is bifurcated into coarse wavelength division multiplexer (CWDM), dense wavelength division multiplexer (DWDM).

By Vertical:

It is segmented into IT & telecoms, healthcare, manufacturing, financial services, and other.

By Region:

The industry is studied across North America, Latin America, Western Europe, Eastern Europe, South Asia and Pacific, East Asia, and the Middle East & Africa.

Table of Content

  1. Executive Summary
    • Global Market Outlook
    • Demand-side Trends
    • Supply-side Trends
    • Technology Roadmap Analysis
    • Analysis and Recommendations
  2. Market Overview
    • Market Coverage / Taxonomy
    • Market Definition / Scope / Limitations
  3. Market Background
    • Market Dynamics
      • Drivers
      • Restraints
      • Opportunity
      • Trends
    • Scenario Forecast
      • Demand in Optimistic Scenario
      • Demand in Likely Scenario
      • Demand in Conservative Scenario
    • Opportunity Map Analysis
    • Product Life Cycle Analysis
    • Supply Chain Analysis
      • Supply Side Participants and their Roles
        • Producers
        • Mid-Level Participants (Traders/ Agents/ Brokers)
        • Wholesalers and Distributors
      • Value Added and Value Created at Node in the Supply Chain
      • List of Raw Material Suppliers
      • List of Existing and Potential Buyer’s
    • Investment Feasibility Matrix
    • Value Chain Analysis
      • Profit Margin Analysis
      • Wholesalers and Distributors
      • Retailers
    • PESTLE and Porter’s Analysis
    • Regulatory Landscape
      • By Key Regions
      • By Key Countries
    • Regional Parent Market Outlook
    • Production and Consumption Statistics
    • Import and Export Statistics
  4. Global Market Analysis 2020 to 2024 and Forecast, 2025 to 2035
    • Historical Market Size Value (USD Billion) & Volume (Units) Analysis, 2020 to 2024
    • Current and Future Market Size Value (USD Billion) & Volume (Units) Projections, 2025 to 2035
      • Y-o-Y Growth Trend Analysis
      • Absolute $ Opportunity Analysis
  5. Global Market Pricing Analysis 2020 to 2024 and Forecast 2025 to 2035
  6. Global Market Analysis 2020 to 2024 and Forecast 2025 to 2035, By Multiplexer Type
    • Introduction / Key Findings
    • Historical Market Size Value (USD Billion) & Volume (Units) Analysis By Multiplexer Type, 2020 to 2024
    • Current and Future Market Size Value (USD Billion) & Volume (Units) Analysis and Forecast By Multiplexer Type, 2025 to 2035
      • Coarse Wavelength Division Multiplexer (CWDM)
      • Dense Wavelength Division Multiplexer (DWDM)
    • Y-o-Y Growth Trend Analysis By Multiplexer Type, 2020 to 2024
    • Absolute $ Opportunity Analysis By Multiplexer Type, 2025 to 2035
  7. Global Market Analysis 2020 to 2024 and Forecast 2025 to 2035, By Vertical
    • Introduction / Key Findings
    • Historical Market Size Value (USD Billion) & Volume (Units) Analysis By Vertical, 2020 to 2024
    • Current and Future Market Size Value (USD Billion) & Volume (Units) Analysis and Forecast By Vertical, 2025 to 2035
      • IT & Telecoms
      • Healthcare
      • Manufacturing
      • Financial Services
      • Other
    • Y-o-Y Growth Trend Analysis By Vertical, 2020 to 2024
    • Absolute $ Opportunity Analysis By Vertical, 2025 to 2035
  8. Global Market Analysis 2020 to 2024 and Forecast 2025 to 2035, By Region
    • Introduction
    • Historical Market Size Value (USD Billion) & Volume (Units) Analysis By Region, 2020 to 2024
    • Current Market Size Value (USD Billion) & Volume (Units) Analysis and Forecast By Region, 2025 to 2035
      • North America
      • Latin America
      • Western Europe
      • Eastern Europe
      • East Asia
      • South Asia & Pacific
      • Middle East and Africa
    • Market Attractiveness Analysis By Region
  9. North America Market Analysis 2020 to 2024 and Forecast 2025 to 2035, By Country
    • Historical Market Size Value (USD Billion) & Volume (Units) Trend Analysis By Market Taxonomy, 2020 to 2024
    • Market Size Value (USD Billion) & Volume (Units) Forecast By Market Taxonomy, 2025 to 2035
      • By Country
        • USA
        • Canada
        • Mexico
      • By Multiplexer Type
      • By Vertical
    • Market Attractiveness Analysis
      • By Country
      • By Multiplexer Type
      • By Vertical
    • Key Takeaways
  10. Latin America Market Analysis 2020 to 2024 and Forecast 2025 to 2035, By Country
    • Historical Market Size Value (USD Billion) & Volume (Units) Trend Analysis By Market Taxonomy, 2020 to 2024
    • Market Size Value (USD Billion) & Volume (Units) Forecast By Market Taxonomy, 2025 to 2035
      • By Country
        • Brazil
        • Argentina
        • Rest of LATAM
      • By Multiplexer Type
      • By Vertical
    • Market Attractiveness Analysis
      • By Country
      • By Multiplexer Type
      • By Vertical
    • Key Takeaways
  11. Western Europe Market Analysis 2020 to 2024 and Forecast 2025 to 2035, By Country
    • Historical Market Size Value (USD Billion) & Volume (Units) Trend Analysis By Market Taxonomy, 2020 to 2024
    • Market Size Value (USD Billion) & Volume (Units) Forecast By Market Taxonomy, 2025 to 2035
      • By Country
        • Germany
        • Italy
        • France
        • UK
        • Spain
        • BENELUX
        • Nordic
        • Rest of W.Europe
      • By Multiplexer Type
      • By Vertical
    • Market Attractiveness Analysis
      • By Country
      • By Multiplexer Type
      • By Vertical
    • Key Takeaways
  12. Eastern Europe Market Analysis 2020 to 2024 and Forecast 2025 to 2035, By Country
    • Historical Market Size Value (USD Billion) & Volume (Units) Trend Analysis By Market Taxonomy, 2020 to 2024
    • Market Size Value (USD Billion) & Volume (Units) Forecast By Market Taxonomy, 2025 to 2035
      • By Country
        • Russia
        • Hungary
        • Poland
        • Balkan & Baltics
        • Rest of E. Europe
      • By Multiplexer Type
      • By Vertical
    • Market Attractiveness Analysis
      • By Country
      • By Multiplexer Type
      • By Vertical
    • Key Takeaways
  13. East Asia Market Analysis 2020 to 2024 and Forecast 2025 to 2035, By Country
    • Historical Market Size Value (USD Billion) & Volume (Units) Trend Analysis By Market Taxonomy, 2020 to 2024
    • Market Size Value (USD Billion) & Volume (Units) Forecast By Market Taxonomy, 2025 to 2035
      • By Country
        • China
        • Japan
        • South Korea
      • By Multiplexer Type
      • By Vertical
    • Market Attractiveness Analysis
      • By Country
      • By Multiplexer Type
      • By Vertical
    • Key Takeaways
  14. South Asia & Pacific Market Analysis 2020 to 2024 and Forecast 2025 to 2035, By Country
    • Historical Market Size Value (USD Billion) & Volume (Units) Trend Analysis By Market Taxonomy, 2020 to 2024
    • Market Size Value (USD Billion) & Volume (Units) Forecast By Market Taxonomy, 2025 to 2035
      • By Country
        • India
        • Australia & New Zealand
        • ASEAN
        • Rest of SAP
      • By Multiplexer Type
      • By Vertical
    • Market Attractiveness Analysis
      • By Country
      • By Multiplexer Type
      • By Vertical
    • Key Takeaways
  15. Middle East and Africa Market Analysis 2020 to 2024 and Forecast 2025 to 2035, By Country
    • Historical Market Size Value (USD Billion) & Volume (Units) Trend Analysis By Market Taxonomy, 2020 to 2024
    • Market Size Value (USD Billion) & Volume (Units) Forecast By Market Taxonomy, 2025 to 2035
      • By Country
        • GCC Countries
        • Northern Africa
        • South Africa
        • Turkiye
        • Rest of MEA
      • By Multiplexer Type
      • By Vertical
    • Market Attractiveness Analysis
      • By Country
      • By Multiplexer Type
      • By Vertical
    • Key Takeaways
  16. Key Countries Market Analysis
    • USA
      • Pricing Analysis
      • Market Share Analysis, 2024
        • By Multiplexer Type
        • By Vertical
    • Canada
      • Pricing Analysis
      • Market Share Analysis, 2024
        • By Multiplexer Type
        • By Vertical
    • Brazil
      • Pricing Analysis
      • Market Share Analysis, 2024
        • By Multiplexer Type
        • By Vertical
    • Mexico
      • Pricing Analysis
      • Market Share Analysis, 2024
        • By Multiplexer Type
        • By Vertical
    • Argentina
      • Pricing Analysis
      • Market Share Analysis, 2024
        • By Multiplexer Type
        • By Vertical
  17. Market Structure Analysis
    • Competition Dashboard
    • Competition Benchmarking
    • Market Share Analysis of Top Players
      • By Regional
      • By Multiplexer Type
      • By Vertical
  18. Competition Analysis
    • Competition Deep Dive
      • ADTRAN, Inc.
        • Overview
        • Product Portfolio
        • Profitability by Market Segments (Product/Age /Sales Channel/Region)
        • Sales Footprint
        • Strategy Overview
          • Marketing Strategy
          • Product Strategy
          • Channel Strategy
      • Aliathon Technology Ltd
        • Overview
        • Product Portfolio
        • Profitability by Market Segments (Product/Age /Sales Channel/Region)
        • Sales Footprint
        • Strategy Overview
          • Marketing Strategy
          • Product Strategy
          • Channel Strategy
      • Ciena Corporation
        • Overview
        • Product Portfolio
        • Profitability by Market Segments (Product/Age /Sales Channel/Region)
        • Sales Footprint
        • Strategy Overview
          • Marketing Strategy
          • Product Strategy
          • Channel Strategy
      • Cisco Systems
        • Overview
        • Product Portfolio
        • Profitability by Market Segments (Product/Age /Sales Channel/Region)
        • Sales Footprint
        • Strategy Overview
          • Marketing Strategy
          • Product Strategy
          • Channel Strategy
      • Fujitsu Ltd.
        • Overview
        • Product Portfolio
        • Profitability by Market Segments (Product/Age /Sales Channel/Region)
        • Sales Footprint
        • Strategy Overview
          • Marketing Strategy
          • Product Strategy
          • Channel Strategy
      • Huawei Technologies
        • Overview
        • Product Portfolio
        • Profitability by Market Segments (Product/Age /Sales Channel/Region)
        • Sales Footprint
        • Strategy Overview
          • Marketing Strategy
          • Product Strategy
          • Channel Strategy
      • Infinera
        • Overview
        • Product Portfolio
        • Profitability by Market Segments (Product/Age /Sales Channel/Region)
        • Sales Footprint
        • Strategy Overview
          • Marketing Strategy
          • Product Strategy
          • Channel Strategy
      • Nokia
        • Overview
        • Product Portfolio
        • Profitability by Market Segments (Product/Age /Sales Channel/Region)
        • Sales Footprint
        • Strategy Overview
          • Marketing Strategy
          • Product Strategy
          • Channel Strategy
      • ZTE Corporation
        • Overview
        • Product Portfolio
        • Profitability by Market Segments (Product/Age /Sales Channel/Region)
        • Sales Footprint
        • Strategy Overview
          • Marketing Strategy
          • Product Strategy
          • Channel Strategy
      • ALCATEL-LUCENT
        • Overview
        • Product Portfolio
        • Profitability by Market Segments (Product/Age /Sales Channel/Region)
        • Sales Footprint
        • Strategy Overview
          • Marketing Strategy
          • Product Strategy
          • Channel Strategy
      • ADVA Optical Networking
        • Overview
        • Product Portfolio
        • Profitability by Market Segments (Product/Age /Sales Channel/Region)
        • Sales Footprint
        • Strategy Overview
          • Marketing Strategy
          • Product Strategy
          • Channel Strategy
      • FiberHome Networks
        • Overview
        • Product Portfolio
        • Profitability by Market Segments (Product/Age /Sales Channel/Region)
        • Sales Footprint
        • Strategy Overview
          • Marketing Strategy
          • Product Strategy
          • Channel Strategy
      • Juniper Networks
        • Overview
        • Product Portfolio
        • Profitability by Market Segments (Product/Age /Sales Channel/Region)
        • Sales Footprint
        • Strategy Overview
          • Marketing Strategy
          • Product Strategy
          • Channel Strategy
  19. Assumptions & Acronyms Used
  20. Research Methodology

List of Tables

  • Table 1: Global Market Value (USD Billion) Forecast by Region, 2020 to 2035
  • Table 2: Global Market Volume (Units) Forecast by Region, 2020 to 2035
  • Table 3: Global Market Value (USD Billion) Forecast by Multiplexer Type, 2020 to 2035
  • Table 4: Global Market Volume (Units) Forecast by Multiplexer Type, 2020 to 2035
  • Table 5: Global Market Value (USD Billion) Forecast by Vertical, 2020 to 2035
  • Table 6: Global Market Volume (Units) Forecast by Vertical, 2020 to 2035
  • Table 7: North America Market Value (USD Billion) Forecast by Country, 2020 to 2035
  • Table 8: North America Market Volume (Units) Forecast by Country, 2020 to 2035
  • Table 9: North America Market Value (USD Billion) Forecast by Multiplexer Type, 2020 to 2035
  • Table 10: North America Market Volume (Units) Forecast by Multiplexer Type, 2020 to 2035
  • Table 11: North America Market Value (USD Billion) Forecast by Vertical, 2020 to 2035
  • Table 12: North America Market Volume (Units) Forecast by Vertical, 2020 to 2035
  • Table 13: Latin America Market Value (USD Billion) Forecast by Country, 2020 to 2035
  • Table 14: Latin America Market Volume (Units) Forecast by Country, 2020 to 2035
  • Table 15: Latin America Market Value (USD Billion) Forecast by Multiplexer Type, 2020 to 2035
  • Table 16: Latin America Market Volume (Units) Forecast by Multiplexer Type, 2020 to 2035
  • Table 17: Latin America Market Value (USD Billion) Forecast by Vertical, 2020 to 2035
  • Table 18: Latin America Market Volume (Units) Forecast by Vertical, 2020 to 2035
  • Table 19: Western Europe Market Value (USD Billion) Forecast by Country, 2020 to 2035
  • Table 20: Western Europe Market Volume (Units) Forecast by Country, 2020 to 2035
  • Table 21: Western Europe Market Value (USD Billion) Forecast by Multiplexer Type, 2020 to 2035
  • Table 22: Western Europe Market Volume (Units) Forecast by Multiplexer Type, 2020 to 2035
  • Table 23: Western Europe Market Value (USD Billion) Forecast by Vertical, 2020 to 2035
  • Table 24: Western Europe Market Volume (Units) Forecast by Vertical, 2020 to 2035
  • Table 25: Eastern Europe Market Value (USD Billion) Forecast by Country, 2020 to 2035
  • Table 26: Eastern Europe Market Volume (Units) Forecast by Country, 2020 to 2035
  • Table 27: Eastern Europe Market Value (USD Billion) Forecast by Multiplexer Type, 2020 to 2035
  • Table 28: Eastern Europe Market Volume (Units) Forecast by Multiplexer Type, 2020 to 2035
  • Table 29: Eastern Europe Market Value (USD Billion) Forecast by Vertical, 2020 to 2035
  • Table 30: Eastern Europe Market Volume (Units) Forecast by Vertical, 2020 to 2035
  • Table 31: East Asia Market Value (USD Billion) Forecast by Country, 2020 to 2035
  • Table 32: East Asia Market Volume (Units) Forecast by Country, 2020 to 2035
  • Table 33: East Asia Market Value (USD Billion) Forecast by Multiplexer Type, 2020 to 2035
  • Table 34: East Asia Market Volume (Units) Forecast by Multiplexer Type, 2020 to 2035
  • Table 35: East Asia Market Value (USD Billion) Forecast by Vertical, 2020 to 2035
  • Table 36: East Asia Market Volume (Units) Forecast by Vertical, 2020 to 2035
  • Table 37: South Asia & Pacific Market Value (USD Billion) Forecast by Country, 2020 to 2035
  • Table 38: South Asia & Pacific Market Volume (Units) Forecast by Country, 2020 to 2035
  • Table 39: South Asia & Pacific Market Value (USD Billion) Forecast by Multiplexer Type, 2020 to 2035
  • Table 40: South Asia & Pacific Market Volume (Units) Forecast by Multiplexer Type, 2020 to 2035
  • Table 41: South Asia & Pacific Market Value (USD Billion) Forecast by Vertical, 2020 to 2035
  • Table 42: South Asia & Pacific Market Volume (Units) Forecast by Vertical, 2020 to 2035
  • Table 43: Middle East and Africa Market Value (USD Billion) Forecast by Country, 2020 to 2035
  • Table 44: Middle East and Africa Market Volume (Units) Forecast by Country, 2020 to 2035
  • Table 45: Middle East and Africa Market Value (USD Billion) Forecast by Multiplexer Type, 2020 to 2035
  • Table 46: Middle East and Africa Market Volume (Units) Forecast by Multiplexer Type, 2020 to 2035
  • Table 47: Middle East and Africa Market Value (USD Billion) Forecast by Vertical, 2020 to 2035
  • Table 48: Middle East and Africa Market Volume (Units) Forecast by Vertical, 2020 to 2035

List of Figures

  • Figure 1: Global Market Volume (Units) Forecast 2020 to 2035
  • Figure 2: Global Market Pricing Analysis
  • Figure 3: Global Market Value (USD Billion) Forecast 2020 to 2035
  • Figure 4: Global Market Value Share and BPS Analysis by Multiplexer Type, 2025 and 2035
  • Figure 5: Global Market Y-o-Y Growth Comparison by Multiplexer Type, 2025 to 2035
  • Figure 6: Global Market Attractiveness Analysis by Multiplexer Type
  • Figure 7: Global Market Value Share and BPS Analysis by Vertical, 2025 and 2035
  • Figure 8: Global Market Y-o-Y Growth Comparison by Vertical, 2025 to 2035
  • Figure 9: Global Market Attractiveness Analysis by Vertical
  • Figure 10: Global Market Value (USD Billion) Share and BPS Analysis by Region, 2025 and 2035
  • Figure 11: Global Market Y-o-Y Growth Comparison by Region, 2025 to 2035
  • Figure 12: Global Market Attractiveness Analysis by Region
  • Figure 13: North America Market Incremental $ Opportunity, 2025 to 2035
  • Figure 14: Latin America Market Incremental $ Opportunity, 2025 to 2035
  • Figure 15: Western Europe Market Incremental $ Opportunity, 2025 to 2035
  • Figure 16: Eastern Europe Market Incremental $ Opportunity, 2025 to 2035
  • Figure 17: East Asia Market Incremental $ Opportunity, 2025 to 2035
  • Figure 18: South Asia & Pacific Market Incremental $ Opportunity, 2025 to 2035
  • Figure 19: Middle East and Africa Market Incremental $ Opportunity, 2025 to 2035
  • Figure 20: North America Market Value Share and BPS Analysis by Country, 2025 and 2035
  • Figure 21: North America Market Value Share and BPS Analysis by Multiplexer Type, 2025 and 2035
  • Figure 22: North America Market Y-o-Y Growth Comparison by Multiplexer Type, 2025 to 2035
  • Figure 23: North America Market Attractiveness Analysis by Multiplexer Type
  • Figure 24: North America Market Value Share and BPS Analysis by Vertical, 2025 and 2035
  • Figure 25: North America Market Y-o-Y Growth Comparison by Vertical, 2025 to 2035
  • Figure 26: North America Market Attractiveness Analysis by Vertical
  • Figure 27: Latin America Market Value Share and BPS Analysis by Country, 2025 and 2035
  • Figure 28: Latin America Market Value Share and BPS Analysis by Multiplexer Type, 2025 and 2035
  • Figure 29: Latin America Market Y-o-Y Growth Comparison by Multiplexer Type, 2025 to 2035
  • Figure 30: Latin America Market Attractiveness Analysis by Multiplexer Type
  • Figure 31: Latin America Market Value Share and BPS Analysis by Vertical, 2025 and 2035
  • Figure 32: Latin America Market Y-o-Y Growth Comparison by Vertical, 2025 to 2035
  • Figure 33: Latin America Market Attractiveness Analysis by Vertical
  • Figure 34: Western Europe Market Value Share and BPS Analysis by Country, 2025 and 2035
  • Figure 35: Western Europe Market Value Share and BPS Analysis by Multiplexer Type, 2025 and 2035
  • Figure 36: Western Europe Market Y-o-Y Growth Comparison by Multiplexer Type, 2025 to 2035
  • Figure 37: Western Europe Market Attractiveness Analysis by Multiplexer Type
  • Figure 38: Western Europe Market Value Share and BPS Analysis by Vertical, 2025 and 2035
  • Figure 39: Western Europe Market Y-o-Y Growth Comparison by Vertical, 2025 to 2035
  • Figure 40: Western Europe Market Attractiveness Analysis by Vertical
  • Figure 41: Eastern Europe Market Value Share and BPS Analysis by Country, 2025 and 2035
  • Figure 42: Eastern Europe Market Value Share and BPS Analysis by Multiplexer Type, 2025 and 2035
  • Figure 43: Eastern Europe Market Y-o-Y Growth Comparison by Multiplexer Type, 2025 to 2035
  • Figure 44: Eastern Europe Market Attractiveness Analysis by Multiplexer Type
  • Figure 45: Eastern Europe Market Value Share and BPS Analysis by Vertical, 2025 and 2035
  • Figure 46: Eastern Europe Market Y-o-Y Growth Comparison by Vertical, 2025 to 2035
  • Figure 47: Eastern Europe Market Attractiveness Analysis by Vertical
  • Figure 48: East Asia Market Value Share and BPS Analysis by Country, 2025 and 2035
  • Figure 49: East Asia Market Value Share and BPS Analysis by Multiplexer Type, 2025 and 2035
  • Figure 50: East Asia Market Y-o-Y Growth Comparison by Multiplexer Type, 2025 to 2035
  • Figure 51: East Asia Market Attractiveness Analysis by Multiplexer Type
  • Figure 52: East Asia Market Value Share and BPS Analysis by Vertical, 2025 and 2035
  • Figure 53: East Asia Market Y-o-Y Growth Comparison by Vertical, 2025 to 2035
  • Figure 54: East Asia Market Attractiveness Analysis by Vertical
  • Figure 55: South Asia & Pacific Market Value Share and BPS Analysis by Country, 2025 and 2035
  • Figure 56: South Asia & Pacific Market Value Share and BPS Analysis by Multiplexer Type, 2025 and 2035
  • Figure 57: South Asia & Pacific Market Y-o-Y Growth Comparison by Multiplexer Type, 2025 to 2035
  • Figure 58: South Asia & Pacific Market Attractiveness Analysis by Multiplexer Type
  • Figure 59: South Asia & Pacific Market Value Share and BPS Analysis by Vertical, 2025 and 2035
  • Figure 60: South Asia & Pacific Market Y-o-Y Growth Comparison by Vertical, 2025 to 2035
  • Figure 61: South Asia & Pacific Market Attractiveness Analysis by Vertical
  • Figure 62: Middle East and Africa Market Value Share and BPS Analysis by Country, 2025 and 2035
  • Figure 63: Middle East and Africa Market Value Share and BPS Analysis by Multiplexer Type, 2025 and 2035
  • Figure 64: Middle East and Africa Market Y-o-Y Growth Comparison by Multiplexer Type, 2025 to 2035
  • Figure 65: Middle East and Africa Market Attractiveness Analysis by Multiplexer Type
  • Figure 66: Middle East and Africa Market Value Share and BPS Analysis by Vertical, 2025 and 2035
  • Figure 67: Middle East and Africa Market Y-o-Y Growth Comparison by Vertical, 2025 to 2035
  • Figure 68: Middle East and Africa Market Attractiveness Analysis by Vertical
  • Figure 69: Global Market - Tier Structure Analysis
  • Figure 70: Global Market - Company Share Analysis

Frequently Asked Questions

What is the projected size of the WDM equipment market in 2025?

The market is valued at USD 48.9 billion in 2025.

What is the outlook on WDM equipment demand by 2035?

The market is forecasted to reach USD 84.4 billion by 2035, reflecting a CAGR of 6.0%.

Which multiplexer type leads the WDM equipment market in 2025?

The coarse wavelength division multiplexer (CWDM) segment is expected to lead with a 55% market share in 2025.

What is the projected share of IT & Telecoms in the vertical segment of the WDM equipment market by 2035?

The IT & Telecoms segment is expected to hold nearly 60% of the market share by 2035.

Which country is projected to have the fastest-growing WDM equipment market?

Japan is anticipated to be the fastest-growing market with a CAGR of 5.2% from 2025 to 2035.

Explore Similar Insights

Future Market Insights

Wavelength Division Multiplexing (WDM) Equipment Market