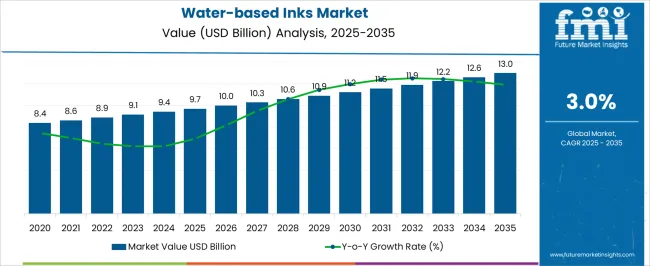
The water-based inks market size is projected to be worth US$ 9,120.0 million in 2023. The market is likely to surpass US$ 12,415.0 million by 2033 at a CAGR of 3.1% during the forecast period. Water-based inks are now widely utilized in nearly all printing processes and on most materials for a wide range of applications. Owing to the development of novel printing techniques and additives.
The water-based inks market is experiencing steady growth and gaining prominence as a sustainable alternative to solvent-based inks. These are formulated using water as a primary solvent, making them less harmful to the environment and human health.
Other Drivers Propelling the Demand for Water-based Inks include:
Challenges for Companies /Manufacturers in the Market:
Opportunities in the Water-based Inks Industry:
Recent Market Trends in the Water-based Inks:
Attribute | Details |
---|---|
Market Size (2023) | US$ 9,120 million |
Market Projected Size (2033) | US$ 12,415 million |
Value CAGR (2023 to 2033) | 3.1% |
Don't pay for what you don't need
Customize your report by selecting specific countries or regions and save 30%!
The historical sales of water-based inks have demonstrated a positive growth trajectory of 2.0%. Driven by factors such as environmental regulations, sustainability initiatives, and consumer demand for eco-friendly products. As the market continues to evolve, the future demand for water-based inks is expected to further increase.
The Future Sales Outlook for the Market is Optimistic, Driven by Several Factors
Environmental regulations are expected to become even more stringent in the future, favoring the use of water-based inks. Governments and regulatory bodies are likely to promote the adoption of sustainable inks to reduce the environmental impact of printing processes.
The water-based inks market is witnessing growth in emerging markets and applications. Industries such as textiles, industrial printing, and digital printing are adopting water-based inks due to their eco-friendly nature and improved performance.
Based on these factors the market is likely to record a CAGR of 3.1% in the analysis period of 2023 to 2033.
The United States has stringent environmental regulations that have influenced the adoption of water-based inks. Regulations by agencies such as the Environmental Protection Agency (EPA) and state-specific agencies focus on reducing VOC emissions and promoting the use of environmentally friendly alternatives.
Consumer awareness of environmental issues and their preference for sustainable products have played a significant role in the adoption of water-based inks. Consumers in the United States are increasingly seeking products that align with their values and have a lower environmental impact.
Europe is one of the influential markets for water-based inks, capturing a market share of 17.9% in 2022. The region has witnessed a shift towards sustainable packaging materials, driven by consumer preferences and regulatory requirements. European countries actively promote collaboration between industry players, research institutions, and governmental bodies to drive sustainability initiatives in the printing industry. These collaborations foster innovation, knowledge sharing, and the development of environmentally friendly solutions like water-based inks. Such initiatives have created a supportive ecosystem for the growth of the water-based inks market in Europe.
India has a significant share in the water-based inks market and has been experiencing steady growth. Factors driving this growth include increasing environmental awareness, the expansion of the packaging industry, regulatory support, technological advancements, and the demand for sustainable printing solutions. The government's focus on reducing VOC emissions and promoting eco-friendly practices has further fueled the adoption of water-based inks in India. The market is expected to continue expanding as more businesses and consumers prioritize environmentally friendly printing solutions.
The United Kingdom is witnessing a growth of 2.1% between 2023 to 2033. The market has experienced steady growth, driven by factors such as environmental regulations, sustainability initiatives, and the increasing demand for eco-friendly printing solutions.
Consumer awareness and demand for sustainable products have played a significant role in the adoption of water-based inks in the United Kingdom. Consumers are increasingly seeking environmentally friendly options, and businesses are responding by adopting water-based inks to meet this demand.
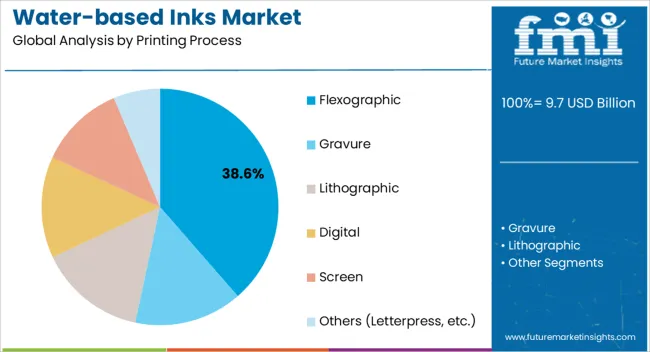
Flexography is a popular printing process used for various applications such as packaging, labels, and corrugated materials. The use of water-based inks in flexographic printing has gained traction due to their eco-friendliness, low VOC emissions, and compliance with regulatory standards. The ability of water-based inks to adhere well to a wide range of substrates makes them suitable for flexographic printing on materials like paper, cardboard, and flexible packaging. As the demand for sustainable and environmentally friendly printing solutions continues to rise, the flexographic segment is expected to contribute significantly to the growth of the water-based inks market.
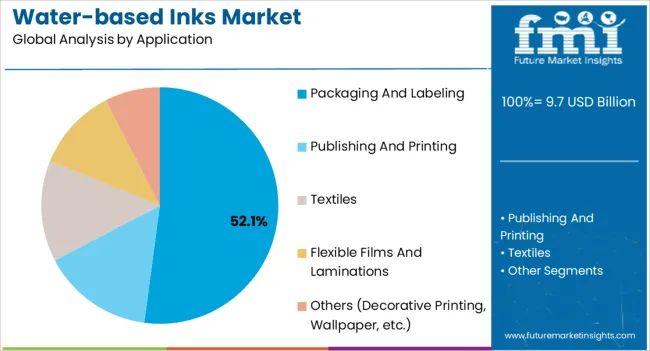
The food and beverage sector holds a prominent share of 43.2% in the global market. Water-based inks are widely used for printing on food packaging materials, including cartons, labels, flexible packaging, and beverage cans.
The stringent safety and regulatory requirements for food contact materials make water-based inks a preferred choice. They offer low levels of migration, ensuring that the ink does not transfer to the food or beverage product, thereby maintaining its safety and quality. Additionally, water-based inks are non-toxic, odorless, and environmentally friendly, aligning with the industry's increasing focus on sustainability. As consumer demand for safe and sustainable food packaging grows, the food and beverages segment is expected to continue driving the demand for water-based inks.
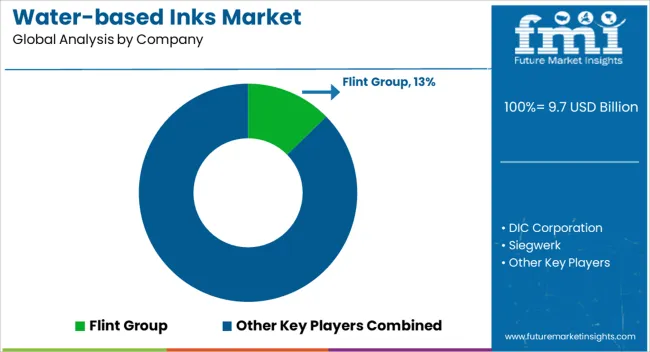
The competitive landscape in the water-based inks market is characterized by the presence of several key players, both global and regional, vying for market share. These companies compete based on factors such as product offerings, technological advancements, pricing strategies, distribution networks, and customer relationships.
Key market players operating in the water-based inks market include DIC Corporation; Flint Group; Hubergroup; Sakata Inx Corporation; Siegwerk Druckfarben AG & Co. KGaA; T&K TOKA Co. Ltd.; Toyo Ink SC Holdings Co., Ltd.; Fujifilm Holdings Corporation; American Inks & Technology; and Wikoff Color Corporation.
Recent Developments:
Get the data you need at a Fraction of the cost
Personalize your report by choosing insights you need
and save 40%!
The growth potential of the market is 3.1% through 2033.
Expensive costs are likely to limit market growth.
Rising technological advancements are fueling Japan’s growth by 2033.
The market is estimated to attain a valuation of US$ 9,120 million in 2023.
The United Kingdom, the United States, and India may witness significant growth in the market.
1. Executive Summary 1.1. Global Market Outlook 1.2. Demand-side Trends 1.3. Supply-side Trends 1.4. Technology Roadmap Analysis 1.5. Analysis and Recommendations 2. Market Overview 2.1. Market Coverage / Taxonomy 2.2. Market Definition / Scope / Limitations 3. Market Background 3.1. Market Dynamics 3.1.1. Drivers 3.1.2. Restraints 3.1.3. Opportunity 3.1.4. Trends 3.2. Scenario Forecast 3.2.1. Demand in Optimistic Scenario 3.2.2. Demand in Likely Scenario 3.2.3. Demand in Conservative Scenario 3.3. Product launches & Recent Developments 3.4. Product Life Cycle Analysis 3.5. Value Chain Analysis 3.5.1. Supply Side Participants and their Roles 3.5.1.1. Producers 3.5.1.2. Mid-Level Participants (Traders/ Agents/ Brokers) 3.5.1.3. Wholesalers and Distributors 3.5.2. % of Operating Margin Analysis 3.5.3. List of Existing and Potential Buyer’s 3.6. Pricing Analysis 3.6.1. Price Point Assessment by Region 3.6.2. Price Point Assessment by production 3.6.3. Price Forecast till 2033 3.6.4. Factors affecting pricing 3.7. Forecast Factors - Relevance & Impact 3.8. Regulatory Landscape 3.9. Regional Parent Market Outlook 3.10. Production and Consumption Statistics 3.11. Consumers Survey Analysis 3.12. Macro-Economic Factors 4. Global Analysis 2018 to 2022 and Forecast, 2023 to 2033 4.1. Historical Market Size Value (US$ Million) & Volume (Tonnes) Analysis, 2018 to 2022 4.2. Current and Future Market Size Value (US$ Million) & Volume (Tonnes) Projections, 2023 to 2033 4.2.1. Y-o-Y Growth Trend Analysis 4.2.2. Absolute $ Opportunity Analysis 5. Global Analysis 2018 to 2022 and Forecast 2023 to 2033, By Printing Process 5.1. Introduction / Key Findings 5.2. Historical Market Size Value (US$ Million) & Volume (Tonnes) Analysis By Printing Process, 2018 to 2022 5.3. Current and Future Market Size Value (US$ Million) & Volume (Tonnes) Analysis and Forecast By 5.3.1. Printing Process, 2023 to 2033 5.3.2. Flexographic 5.3.3. Gravure 5.3.4. Lithographic 5.3.5. Digital 5.3.6. Screen 5.3.7. Others (Letterpress, etc.) 5.4. Y-o-Y Growth Trend Analysis By Printing Process, 2018 to 2022 5.5. Absolute $ Opportunity Analysis By Printing Process, 2023 to 2033 6. Global Analysis 2018 to 2022 and Forecast 2023 to 2033, By Application 6.1. Introduction / Key Findings 6.2. Historical Market Size Value (US$ Million) & Volume (Tonnes) Analysis By Application, 2018 to 2022 6.3. Current and Future Market Size Value (US$ Million) & Volume (Tonnes) Analysis and Forecast By 6.3.1. Application, 2023 to 2033 6.3.2. Packaging and Labeling 6.3.3. Publishing and Printing 6.3.4. Textiles 6.3.5. Flexible Films and Laminations 6.3.6. Others (Decorative Printing, Wallpaper, etc.) 6.4. Y-o-Y Growth Trend Analysis By Application, 2018 to 2022 6.5. Absolute $ Opportunity Analysis By Application, 2023 to 2033 7. Global Analysis 2018 to 2022 and Forecast 2023 to 2033, By Colorants 7.1. Introduction / Key Findings 7.2. Historical Market Size Value (US$ Million) & Volume (Tonnes) Analysis By Colorants, 2018 to 2022 7.3. Current and Future Market Size Value (US$ Million) & Volume (Tonnes) Analysis and Forecast By Colorants, 7.3.1. 2023 to 2033 7.3.2. Organic water-based inks 7.3.3. Inorganic water-based inks 7.3.4. Metallic water-based inks 7.3.5. Fluorescent water-based inks 7.3.6. Specialty water-based inks 7.4. Y-o-Y Growth Trend Analysis By Colorants, 2018 to 2022 7.5. Absolute $ Opportunity Analysis By Colorants, 2023 to 2033 8. Global Analysis 2018 to 2022 and Forecast 2023 to 2033, By End Use 8.1. Introduction / Key Findings 8.2. Historical Market Size Value (US$ Million) & Volume (Tonnes) Analysis By End Use, 2018 to 2022 8.3. Current and Future Market Size Value (US$ Million) & Volume (Tonnes) Analysis and Forecast By End Use, 8.3.1. 2023 to 2033 8.3.2. Food and Beverage 8.3.3. Pharmaceuticals and Healthcare 8.3.4. Personal Care and Cosmetics 8.3.5. Textiles and Apparel 8.3.6. Paper and Packaging 8.3.7. Others (Automotive, Electronics, etc.) 8.4. Y-o-Y Growth Trend Analysis By End Use, 2018 to 2022 8.5. Absolute $ Opportunity Analysis By End Use, 2023 to 2033 9. Global Analysis 2018 to 2022 and Forecast 2023 to 2033, By Region 9.1. Introduction 9.2. Historical Market Size Value (US$ Million) & Volume (Tonnes) Analysis By Region, 2018 to 2022 9.3. Current Market Size Value (US$ Million) & Volume (Tonnes) Analysis and Forecast By Region, 2023 to 2033 9.3.1. North America 9.3.2. Latin America 9.3.3. Europe 9.3.4. East Asia 9.3.5. South Asia 9.3.6. Oceania 9.3.7. MEA 9.4. Market Attractiveness Analysis By Region 10. North America Analysis 2018 to 2022 and Forecast 2023 to 2033, By Country 10.1. Historical Market Size Value (US$ Million) & Volume (Tonnes) Trend Analysis By Market Taxonomy, 2018 to 2022 10.2. Market Size Value (US$ Million) & Volume (Tonnes) Forecast By Market Taxonomy, 2023 to 2033 10.2.1. By Country 10.2.1.1. USA 10.2.1.2. Canada 10.2.2. By Printing Process 10.2.3. By Application 10.2.4. By Colorants 10.2.5. By End Use 10.3. Market Attractiveness Analysis 10.3.1. By Country 10.3.2. By Printing Process 10.3.3. By Application 10.3.4. By Colorants 10.3.5. By End Use 10.4. Key Takeaways 11. Latin America Analysis 2018 to 2022 and Forecast 2023 to 2033, By Country 11.1. Historical Market Size Value (US$ Million) & Volume (Tonnes) Trend Analysis By Market Taxonomy, 2018 to 2022 11.2. Market Size Value (US$ Million) & Volume (Tonnes) Forecast By Market Taxonomy, 2023 to 2033 11.2.1. By Country 11.2.1.1. Brazil 11.2.1.2. Mexico 11.2.1.3. Argentina 11.2.1.4. Chile 11.2.1.5. Peru 11.2.1.6. Rest of Latin America 11.2.2. By Printing Process 11.2.3. By Application 11.2.4. By Colorants 11.2.5. By End Use 11.3. Market Attractiveness Analysis 11.3.1. By Country 11.3.2. By Printing Process 11.3.3. By Application 11.3.4. By Colorants 11.3.5. By End Use 11.4. Key Takeaways 12. Europe Analysis 2018 to 2022 and Forecast 2023 to 2033, By Country 12.1. Historical Market Size Value (US$ Million) & Volume (Tonnes) Trend Analysis By Market Taxonomy, 2018 to 2022 12.2. Market Size Value (US$ Million) & Volume (Tonnes) Forecast By Market Taxonomy, 2023 to 2033 12.2.1. By Country 12.2.1.1. Germany 12.2.1.2. Italy 12.2.1.3. France 12.2.1.4. UK 12.2.1.5. Spain 12.2.1.6. Russia 12.2.1.7. BENELUX 12.2.1.8. Poland 12.2.1.9. Nordic Countries 12.2.1.10. Rest of Europe 12.2.2. By Printing Process 12.2.3. By Application 12.2.4. By Colorants 12.2.5. By End Use 12.3. Market Attractiveness Analysis 12.3.1. By Country 12.3.2. By Printing Process 12.3.3. By Application 12.3.4. By Colorants 12.3.5. By End Use 12.4. Key Takeaways 13. East Asia Analysis 2018 to 2022 and Forecast 2023 to 2033, By Country 13.1. Historical Market Size Value (US$ Million) & Volume (Tonnes) Trend Analysis By Market Taxonomy, 2018 to 2022 13.2. Market Size Value (US$ Million) & Volume (Tonnes) Forecast By Market Taxonomy, 2023 to 2033 13.2.1. By Country 13.2.1.1. China 13.2.1.2. Japan 13.2.1.3. South Korea 13.2.2. By Printing Process 13.2.3. By Application 13.2.4. By Colorants 13.2.5. By End Use 13.3. Market Attractiveness Analysis 13.3.1. By Country 13.3.2. By Printing Process 13.3.3. By Application 13.3.4. By Colorants 13.3.5. By End Use 13.4. Key Takeaways 14. South Asia Analysis 2018 to 2022 and Forecast 2023 to 2033, By Country 14.1. Historical Market Size Value (US$ Million) & Volume (Tonnes) Trend Analysis By Market Taxonomy, 2018 to 2022 14.2. Market Size Value (US$ Million) & Volume (Tonnes) Forecast By Market Taxonomy, 2023 to 2033 14.2.1. By Country 14.2.1.1. India 14.2.1.2. Thailand 14.2.1.3. Malaysia 14.2.1.4. Indonesia 14.2.1.5. Singapore 14.2.1.6. Rest of South Asia 14.2.2. By Printing Process 14.2.3. By Application 14.2.4. By Colorants 14.2.5. By End Use 14.3. Market Attractiveness Analysis 14.3.1. By Country 14.3.2. By Printing Process 14.3.3. By Application 14.3.4. By Colorants 14.3.5. By End Use 14.4. Key Takeaways 15. Oceania Analysis 2018 to 2022 and Forecast 2023 to 2033, By Country 15.1. Historical Market Size Value (US$ Million) & Volume (Tonnes) Trend Analysis By Market Taxonomy, 2018 to 2022 15.2. Market Size Value (US$ Million) & Volume (Tonnes) Forecast By Market Taxonomy, 2023 to 2033 15.2.1. By Country 15.2.1.1. Australia 15.2.1.2. New Zealand 15.2.2. By Printing Process 15.2.3. By Application 15.2.4. By Colorants 15.2.5. By End Use 15.3. Market Attractiveness Analysis 15.3.1. By Country 15.3.2. By Printing Process 15.3.3. By Application 15.3.4. By Colorants 15.3.5. By End Use 15.4. Key Takeaways 16. MEA Analysis 2018 to 2022 and Forecast 2023 to 2033, By Country 16.1. Historical Market Size Value (US$ Million) & Volume (Tonnes) Trend Analysis By Market Taxonomy, 2018 to 2022 16.2. Market Size Value (US$ Million) & Volume (Tonnes) Forecast By Market Taxonomy, 2023 to 2033 16.2.1. By Country 16.2.1.1. GCC Countries 16.2.1.2. South Africa 16.2.1.3. Central Africa 16.2.1.4. North Africa 16.2.2. By Printing Process 16.2.3. By Application 16.2.4. By Colorants 16.2.5. By End Use 16.3. Market Attractiveness Analysis 16.3.1. By Country 16.3.2. By Printing Process 16.3.3. By Application 16.3.4. By Colorants 16.3.5. By End Use 16.4. Key Takeaways 17. Key Countries Analysis 17.1. USA 17.1.1. Pricing Analysis 17.1.2. Market Share Analysis, 2023 17.1.2.1. By Printing Process 17.1.2.2. By Application 17.1.2.3. By Colorants 17.1.2.4. By End Use 17.2. Canada 17.2.1. Pricing Analysis 17.2.2. Market Share Analysis, 2023 17.2.2.1. By Printing Process 17.2.2.2. By Application 17.2.2.3. By Colorants 17.2.2.4. By End Use 17.3. Brazil 17.3.1. Pricing Analysis 17.3.2. Market Share Analysis, 2023 17.3.2.1. By Printing Process 17.3.2.2. By Application 17.3.2.3. By Colorants 17.3.2.4. By End Use 17.4. Mexico 17.4.1. Pricing Analysis 17.4.2. Market Share Analysis, 2023 17.4.2.1. By Printing Process 17.4.2.2. By Application 17.4.2.3. By Colorants 17.4.2.4. By End Use 17.5. Argentina 17.5.1. Pricing Analysis 17.5.2. Market Share Analysis, 2023 17.5.2.1. By Printing Process 17.5.2.2. By Application 17.5.2.3. By Colorants 17.5.2.4. By End Use 17.6. Chile 17.6.1. Pricing Analysis 17.6.2. Market Share Analysis, 2023 17.6.2.1. By Printing Process 17.6.2.2. By Application 17.6.2.3. By Colorants 17.6.2.4. By End Use 17.7. Peru 17.7.1. Pricing Analysis 17.7.2. Market Share Analysis, 2023 17.7.2.1. By Printing Process 17.7.2.2. By Application 17.7.2.3. By Colorants 17.7.2.4. By End Use 17.8. Germany 17.8.1. Pricing Analysis 17.8.2. Market Share Analysis, 2023 17.8.2.1. By Printing Process 17.8.2.2. By Application 17.8.2.3. By Colorants 17.8.2.4. By End Use 17.9. Italy 17.9.1. Pricing Analysis 17.9.2. Market Share Analysis, 2023 17.9.2.1. By Printing Process 17.9.2.2. By Application 17.9.2.3. By Colorants 17.9.2.4. By End Use 17.10. France 17.10.1. Pricing Analysis 17.10.2. Market Share Analysis, 2023 17.10.2.1. By Printing Process 17.10.2.2. By Application 17.10.2.3. By Colorants 17.10.2.4. By End Use 17.11. Spain 17.11.1. Pricing Analysis 17.11.2. Market Share Analysis, 2023 17.11.2.1. By Printing Process 17.11.2.2. By Application 17.11.2.3. By Colorants 17.11.2.4. By End Use 17.12. UK 17.12.1. Pricing Analysis 17.12.2. Market Share Analysis, 2023 17.12.2.1. By Printing Process 17.12.2.2. By Application 17.12.2.3. By Colorants 17.12.2.4. By End Use 17.13. Russia 17.13.1. Pricing Analysis 17.13.2. Market Share Analysis, 2023 17.13.2.1. By Printing Process 17.13.2.2. By Application 17.13.2.3. By Colorants 17.13.2.4. By End Use 17.14. Poland 17.14.1. Pricing Analysis 17.14.2. Market Share Analysis, 2023 17.14.2.1. By Printing Process 17.14.2.2. By Application 17.14.2.3. By Colorants 17.14.2.4. By End Use 17.15. BENELUX 17.15.1. Pricing Analysis 17.15.2. Market Share Analysis, 2023 17.15.2.1. By Printing Process 17.15.2.2. By Application 17.15.2.3. By Colorants 17.15.2.4. By End Use 17.16. Nordic Countries 17.16.1. Pricing Analysis 17.16.2. Market Share Analysis, 2023 17.16.2.1. By Printing Process 17.16.2.2. By Application 17.16.2.3. By Colorants 17.16.2.4. By End Use 17.17. China 17.17.1. Pricing Analysis 17.17.2. Market Share Analysis, 2023 17.17.2.1. By Printing Process 17.17.2.2. By Application 17.17.2.3. By Colorants 17.17.2.4. By End Use 17.18. Japan 17.18.1. Pricing Analysis 17.18.2. Market Share Analysis, 2023 17.18.2.1. By Printing Process 17.18.2.2. By Application 17.18.2.3. By Colorants 17.18.2.4. By End Use 17.19. South Korea 17.19.1. Pricing Analysis 17.19.2. Market Share Analysis, 2023 17.19.2.1. By Printing Process 17.19.2.2. By Application 17.19.2.3. By Colorants 17.19.2.4. By End Use 17.20. India 17.20.1. Pricing Analysis 17.20.2. Market Share Analysis, 2023 17.20.2.1. By Printing Process 17.20.2.2. By Application 17.20.2.3. By Colorants 17.20.2.4. By End Use 17.21. Thailand 17.21.1. Pricing Analysis 17.21.2. Market Share Analysis, 2023 17.21.2.1. By Printing Process 17.21.2.2. By Application 17.21.2.3. By Colorants 17.21.2.4. By End Use 17.22. Indonesia 17.22.1. Pricing Analysis 17.22.2. Market Share Analysis, 2023 17.22.2.1. By Printing Process 17.22.2.2. By Application 17.22.2.3. By Colorants 17.22.2.4. By End Use 17.23. Malaysia 17.23.1. Pricing Analysis 17.23.2. Market Share Analysis, 2023 17.23.2.1. By Printing Process 17.23.2.2. By Application 17.23.2.3. By Colorants 17.23.2.4. By End Use 17.24. Singapore 17.24.1. Pricing Analysis 17.24.2. Market Share Analysis, 2023 17.24.2.1. By Printing Process 17.24.2.2. By Application 17.24.2.3. By Colorants 17.24.2.4. By End Use 17.25. Australia 17.25.1. Pricing Analysis 17.25.2. Market Share Analysis, 2023 17.25.2.1. By Printing Process 17.25.2.2. By Application 17.25.2.3. By Colorants 17.25.2.4. By End Use 17.26. New Zealand 17.26.1. Pricing Analysis 17.26.2. Market Share Analysis, 2023 17.26.2.1. By Printing Process 17.26.2.2. By Application 17.26.2.3. By Colorants 17.26.2.4. By End Use 17.27. GCC Countries 17.27.1. Pricing Analysis 17.27.2. Market Share Analysis, 2023 17.27.2.1. By Printing Process 17.27.2.2. By Application 17.27.2.3. By Colorants 17.27.2.4. By End Use 17.28. South Africa 17.28.1. Pricing Analysis 17.28.2. Market Share Analysis, 2023 17.28.2.1. By Printing Process 17.28.2.2. By Application 17.28.2.3. By Colorants 17.28.2.4. By End Use 17.29. North Africa 17.29.1. Pricing Analysis 17.29.2. Market Share Analysis, 2023 17.29.2.1. By Printing Process 17.29.2.2. By Application 17.29.2.3. By Colorants 17.29.2.4. By End Use 17.30. Central Africa 17.30.1. Pricing Analysis 17.30.2. Market Share Analysis, 2023 17.30.2.1. By Printing Process 17.30.2.2. By Application 17.30.2.3. By Colorants 17.30.2.4. By End Use 18. Market Structure Analysis 18.1. Competition Dashboard 18.2. Competition Benchmarking 18.3. Market Share Analysis of Top Players 18.3.1. By Regional 18.3.2. By Printing Process 18.3.3. By Application 18.3.4. By Colorants 18.3.5. By End Use 19. Competition Analysis 19.1. Competition Deep Dive 19.1.1. Flint Group 19.1.1.1. Overview 19.1.1.2. Product Portfolio 19.1.1.3. Profitability by Market Segments (Product/Age /Sales Channel/Region) 19.1.1.4. Sales Footprint 19.1.1.5. Strategy Overview 19.1.1.5.1. Marketing Strategy 19.1.1.5.2. Product Strategy 19.1.1.5.3. Channel Strategy 19.1.2. DIC Corporation 19.1.2.1. Overview 19.1.2.2. Product Portfolio 19.1.2.3. Profitability by Market Segments (Product/Age /Sales Channel/Region) 19.1.2.4. Sales Footprint 19.1.2.5. Strategy Overview 19.1.2.5.1. Marketing Strategy 19.1.2.5.2. Product Strategy 19.1.2.5.3. Channel Strategy 19.1.3. Siegwerk 19.1.3.1. Overview 19.1.3.2. Product Portfolio 19.1.3.3. Profitability by Market Segments (Product/Age /Sales Channel/Region) 19.1.3.4. Sales Footprint 19.1.3.5. Strategy Overview 19.1.3.5.1. Marketing Strategy 19.1.3.5.2. Product Strategy 19.1.3.5.3. Channel Strategy 19.1.4. TOYO INK CO., LTD. 19.1.4.1. Overview 19.1.4.2. Product Portfolio 19.1.4.3. Profitability by Market Segments (Product/Age /Sales Channel/Region) 19.1.4.4. Sales Footprint 19.1.4.5. Strategy Overview 19.1.4.5.1. Marketing Strategy 19.1.4.5.2. Product Strategy 19.1.4.5.3. Channel Strategy 19.1.5. T & K Toka Co., Ltd 19.1.5.1. Overview 19.1.5.2. Product Portfolio 19.1.5.3. Profitability by Market Segments (Product/Age /Sales Channel/Region) 19.1.5.4. Sales Footprint 19.1.5.5. Strategy Overview 19.1.5.5.1. Marketing Strategy 19.1.5.5.2. Product Strategy 19.1.5.5.3. Channel Strategy 19.1.6. Huber Group 19.1.6.1. Overview 19.1.6.2. Product Portfolio 19.1.6.3. Profitability by Market Segments (Product/Age /Sales Channel/Region) 19.1.6.4. Sales Footprint 19.1.6.5. Strategy Overview 19.1.6.5.1. Marketing Strategy 19.1.6.5.2. Product Strategy 19.1.6.5.3. Channel Strategy 19.1.7. Color Resolution International 19.1.7.1. Overview 19.1.7.2. Product Portfolio 19.1.7.3. Profitability by Market Segments (Product/Age /Sales Channel/Region) 19.1.7.4. Sales Footprint 19.1.7.5. Strategy Overview 19.1.7.5.1. Marketing Strategy 19.1.7.5.2. Product Strategy 19.1.7.5.3. Channel Strategy 19.1.8. Dow Corning Corporation 19.1.8.1. Overview 19.1.8.2. Product Portfolio 19.1.8.3. Profitability by Market Segments (Product/Age /Sales Channel/Region) 19.1.8.4. Sales Footprint 19.1.8.5. Strategy Overview 19.1.8.5.1. Marketing Strategy 19.1.8.5.2. Product Strategy 19.1.8.5.3. Channel Strategy 19.1.9. American Ink & Technology 19.1.9.1. Overview 19.1.9.2. Product Portfolio 19.1.9.3. Profitability by Market Segments (Product/Age /Sales Channel/Region) 19.1.9.4. Sales Footprint 19.1.9.5. Strategy Overview 19.1.9.5.1. Marketing Strategy 19.1.9.5.2. Product Strategy 19.1.9.5.3. Channel Strategy 19.1.10. Sun Chemical 19.1.10.1. Overview 19.1.10.2. Product Portfolio 19.1.10.3. Profitability by Market Segments (Product/Age /Sales Channel/Region) 19.1.10.4. Sales Footprint 19.1.10.5. Strategy Overview 19.1.10.5.1. Marketing Strategy 19.1.10.5.2. Product Strategy 19.1.10.5.3. Channel Strategy 19.1.11. INX International Ink Co. 19.1.11.1. Overview 19.1.11.2. Product Portfolio 19.1.11.3. Profitability by Market Segments (Product/Age /Sales Channel/Region) 19.1.11.4. Sales Footprint 19.1.11.5. Strategy Overview 19.1.11.5.1. Marketing Strategy 19.1.11.5.2. Product Strategy 19.1.11.5.3. Channel Strategy 19.1.12. Inknovators 19.1.12.1. Overview 19.1.12.2. Product Portfolio 19.1.12.3. Profitability by Market Segments (Product/Age /Sales Channel/Region) 19.1.12.4. Sales Footprint 19.1.12.5. Strategy Overview 19.1.12.5.1. Marketing Strategy 19.1.12.5.2. Product Strategy 19.1.12.5.3. Channel Strategy 19.1.13. Agfa-Gevaert Group 19.1.13.1. Overview 19.1.13.2. Product Portfolio 19.1.13.3. Profitability by Market Segments (Product/Age /Sales Channel/Region) 19.1.13.4. Sales Footprint 19.1.13.5. Strategy Overview 19.1.13.5.1. Marketing Strategy 19.1.13.5.2. Product Strategy 19.1.13.5.3. Channel Strategy 20. Assumptions & Acronyms Used 21. Research Methodology
Explore Packaging Insights
View Reports