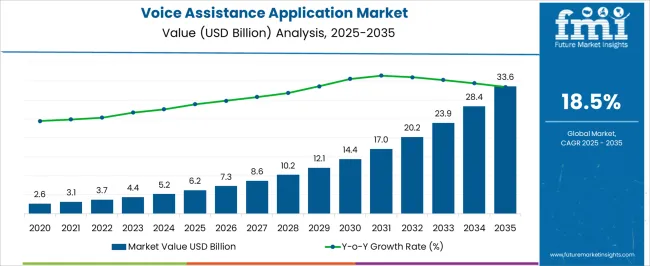
The Voice Assistance Application Market is estimated to be valued at USD 6.2 billion in 2025 and is projected to reach USD 33.6 billion by 2035, registering a compound annual growth rate (CAGR) of 18.5% over the forecast period.
| Metric | Value |
|---|---|
| Voice Assistance Application Market Estimated Value in (2025 E) | USD 6.2 billion |
| Voice Assistance Application Market Forecast Value in (2035 F) | USD 33.6 billion |
| Forecast CAGR (2025 to 2035) | 18.5% |
The voice assistance application market is witnessing accelerated growth driven by widespread digitization, rising demand for contactless interfaces, and the evolution of natural language processing technologies. Enterprises and consumers alike are adopting voice-based platforms for enhanced convenience, speed, and personalization. The integration of AI-powered speech recognition, intent prediction, and contextual understanding is redefining how users interact with digital systems.
Cloud-based deployment is being increasingly favored due to its scalability, flexibility, and ease of integration with diverse enterprise ecosystems. Meanwhile, companies are leveraging voice assistants to enhance customer service, streamline operations, and improve accessibility. Investments from major technology firms in voice-enabled ecosystems are further propelling innovation and market penetration.
Regulatory support for digital accessibility and multilingual capabilities is unlocking new user bases globally. As voice continues to emerge as a primary interface in both business and consumer environments, the market is poised for long-term growth driven by AI maturity and expanding enterprise use cases.
The market is segmented by Component, Deployment Mode, Organisation Size, and Channel Integration and region. By Component, the market is divided into Solutions and Services. In terms of Deployment Mode, the market is classified into Cloud and On-Premises. Based on Organisation Size, the market is segmented into Large Enterprises and SMEs. By Channel Integration, the market is divided into Contact Centers, Smart Speakers, Social Media, Websites, and Mobile applications. Regionally, the market is classified into North America, Latin America, Western Europe, Eastern Europe, Balkan & Baltic Countries, Russia & Belarus, Central Asia, East Asia, South Asia & Pacific, and the Middle East & Africa.
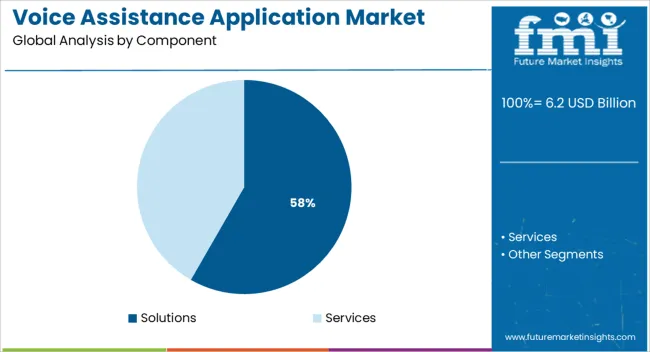
The solutions component is projected to account for 58.3% of total market revenue in 2025, securing its lead over services in the component category. This dominance is being driven by growing enterprise demand for end-to-end voice assistance platforms that deliver speech recognition, command execution, integration with CRM systems, and personalized user experiences.
Pre-configured solutions are being favored for their faster time to deployment, lower customization burden, and ability to scale across customer support, internal automation, and voice commerce functions. Enterprises are prioritizing investments in solution-based offerings to reduce development time and enhance performance consistency.
Continuous improvements in speech accuracy, multi-language support, and emotion recognition within these platforms are also contributing to their sustained adoption. As organizations transition toward digital-first engagement strategies, prebuilt and customizable solutions are expected to remain the backbone of voice assistant implementation.
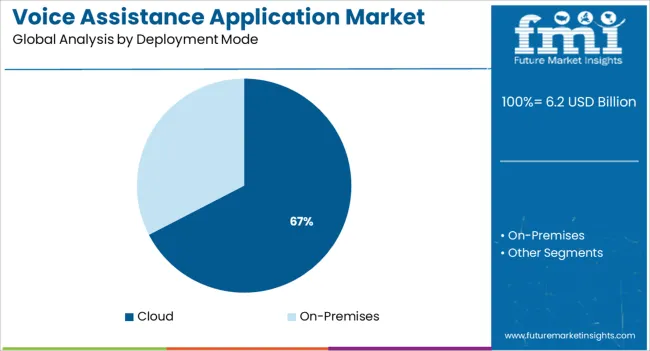
Cloud deployment is anticipated to lead the market with a 67.4% revenue share in 2025, positioning it as the preferred mode across industries. Its dominance is supported by the need for flexible, scalable, and cost-efficient voice solutions that can integrate across devices, channels, and geographies.
The cloud enables continuous platform updates, real-time analytics, and easier access to AI services, making it ideal for both startups and established enterprises. As voice data processing often involves large volumes of unstructured data, cloud-native environments provide the required computing power and storage without infrastructure constraints.
Security enhancements and compliance-ready cloud environments have further reinforced enterprise confidence in deploying mission-critical voice services. The growing ecosystem of cloud-based APIs and SDKs has simplified development and integration, ensuring that the cloud continues to be the foundation for voice assistant growth across consumer and enterprise applications.
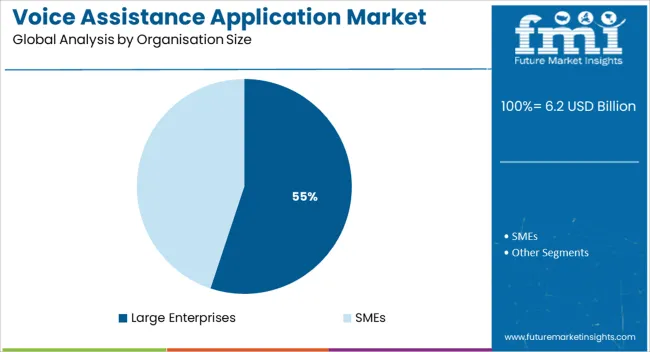
Large enterprises are projected to capture 55.1% of total market revenue in 2025 within the organization size category, maintaining their lead over small and medium-sized businesses. This lead has been supported by their ability to deploy sophisticated voice applications across multiple business functions including customer service, sales enablement, workforce productivity, and process automation.
These enterprises often operate in competitive markets where differentiated customer engagement strategies are essential, and voice assistance offers a seamless channel for interaction. Large-scale operations also require voice systems that integrate with existing enterprise software such as ERPs and CRMs, which is more efficiently handled through scalable platforms.
With access to larger budgets, these organizations are also more likely to invest in proprietary or hybrid voice ecosystems, advanced analytics, and multilingual support. As digital transformation continues to deepen across sectors, large enterprises are expected to drive sustained demand for enterprise-grade voice assistance platforms.
As per the Voice Assistance Application Market research by Future Market Insights - a market research and competitive intelligence provider, historically, from 2020 to 2024, the market value of the Voice Assistance Application Market increased by around 32% CAGR.
Voice Assistance Application uses speech recognition technology, voice commands, and computational linguistics to help users with a variety of tasks in their homes, automobiles, educational institutions, healthcare services, and telecommunication settings. Increased market demand for voice assistant apps has stemmed from the growing usage of the Internet of Things including linked devices. AI, language processing, robotic support, and pattern recognition have all advanced owing to technological developments, lower technology costs, and the capacity to improve existing business processes.
Cerence ARK Assistance, a modern turnkey automotive voice-enabled assistant in USA English, was presented by Cerence Inc. This new solution is based on Cerence's speech and AI technologies, and it builds on the company's first off-the-shelf assistance for the Chinese market, which was released late last year. Terence intends to provide the solution in a variety of languages.
Terence ARK Assistant enables OEMs to swiftly design, implement, and maintain an automotive digital assistant. It is a turnkey solution that blends in-car technology with cloud assistance to support automakers speed up the development of voice assistants. Terence ARK Assistant meets a unique market demand by merging decades of development, knowledge, as well as service into a ready-to-use assistant for mainstream automobiles.
The voice assistant applications market is projected to grow significantly as computational linguistics and robotic speech-based technologies progress. Voice Assistants aid in the interpretation of natural language and may assist with tasks such as scheduling meetings, providing sports scores, and sharing weather forecasts. The surging widespread use of smartphones, along with the growing need for advanced assistive devices, will provide significant development potential for such voice assistant applications.
Saykara has released Kara 2.0, the AI-powered medical assistant that makes data gathering for doctors easier. Kara 2.0, which includes Ambient Mode, is an AI-powered voice software for a healthcare system that allows doctors and patients to interact as usual while Saykara needs to listen, transcribe to the message, decode text into structured information, and intelligently fulfills each structure in a patient's electronic medical record.
Saykara then creates a clinic note that includes the patient's medical history, physical examination, evaluation, plan, orders, as well as recommendations. Saykara seems to be the only digital medical assistant which can be utilized passively 'inside the room' throughout physician-patient consultations with no vocal instructions, owing to the debut of Ambient Mode. Ambient Mode expands Saykara's diversity and agnostic capabilities, providing it to improve up to 18 different healthcare disciplines, such as primary care, pediatrics, internal medicine, orthopedics, and urology, among others.
The voice assistant is built on natural language processing technology, which allows for easier interaction between gadgets and humans while also resolving inquiries in real time. Voice assistants aid call centers in obtaining information about consumers' opinions, interests, and purchasing habits. The data is processed using voice assistant technology, allowing businesses to offer consumers with a more customized experience and proactive product and service suggestions.
Oracle officially released a new version of Oracle Digital Assistant, which includes an AI-trained voice. With this the consumers can interface with their corporate apps using voice control to drive specific actions and outcomes, enhancing the overall consumer experience through conversational AI, automating interactions, and increasing productivity. Oracle Digital Assistance uses AI using semantically processing for natural language processing, and natural language understanding, including bespoke machine learning algorithms, and therefore, is built on Oracle's upcoming infrastructure. This combination enables Oracle Digital Assistant to deduce purpose from a user's natural dialogue, build compositional logical forms, and recognize and recall user behavioral traits in order to take prompt measures on the user's behalf. Oracle Digital Assistant is a no-code method that enables businesses to create conversational interactions. It can also interface with human agent workflows and business operations without requiring any coding.
North America dominates the global voice assistant applications market. Smart speakers are used by over 20% of individuals in the USA. The country uses voice-enabled PCs, cell phones, and other devices. Furthermore, the growing popularity and acceptance of voice-first technology, along with a well-established framework that enables greater penetration of devices that deliver high-speed internet, is likely to boost regional growth in the coming years.
Avaya, a provider of communication and collaborative technologies, has revised its advertising architecture to bring its entire portfolio under the Avaya OneCloud banner. The company's multi-cloud applications platform and its speed in bringing innovative solutions to market, providing the potential for employee and customer engagement, are reflected in the new identity.
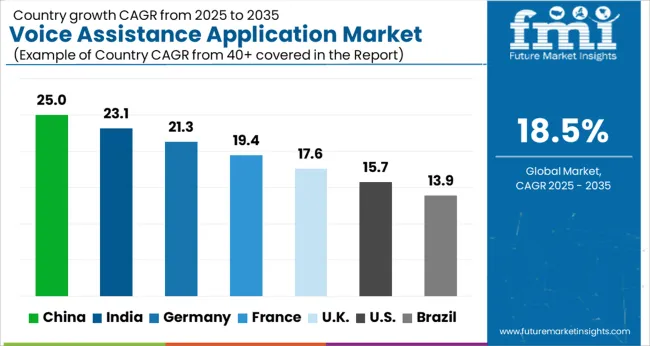
The USA is expected to have the highest market of USD 33.6 Billion by the end of 2035. CTIntegrations, a specialist contact center technology development and system integration firm located in Texas, is acquired by Avaya, a provider of solutions that improve and automate communication and collaboration. Avaya's large contact center client base will benefit from CTIntegrations' expanded digital capabilities, which will be added to the Avaya OneCloud artificial intelligence experience platform. CTIntegrations, the firm powering CT Suite and its connections have long been a member of the Avaya DevConnect provider network, offering comprehensive knowledge of the Avaya OneCloud system as well as a grasp of its clients' changing demands. CT Suite technologies that interact with Avaya contact centers are available to many current Avaya customers.
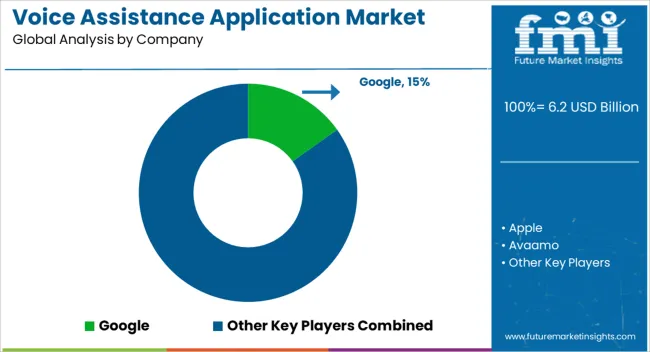
Among the leading players in the global Voice Assistance Application market are Amazon Web Services., Apple Inc., Avaya Inc., Baidu, Inc., Cisco, Google, IBM Corporation, Microsoft Corporation, Nuance Communications, Oracle Corporation, Salesforce.com, Inc., Samsung, Google LLC, SAP, and Verbio Technologies.
Similarly, recent developments related to companies in Voice Assistance Application services have been tracked by the team at Future Market Insights, which are available in the full report.
The global voice assistance application market is estimated to be valued at USD 6.2 billion in 2025.
The market size for the voice assistance application market is projected to reach USD 33.6 billion by 2035.
The voice assistance application market is expected to grow at a 18.5% CAGR between 2025 and 2035.
The key product types in voice assistance application market are solutions, _standalone, _integrated, services, _consulting, _implementation and _support and maintenance.
In terms of deployment mode, cloud segment to command 67.4% share in the voice assistance application market in 2025.


Our Research Products

The "Full Research Suite" delivers actionable market intel, deep dives on markets or technologies, so clients act faster, cut risk, and unlock growth.

The Leaderboard benchmarks and ranks top vendors, classifying them as Established Leaders, Leading Challengers, or Disruptors & Challengers.

Locates where complements amplify value and substitutes erode it, forecasting net impact by horizon

We deliver granular, decision-grade intel: market sizing, 5-year forecasts, pricing, adoption, usage, revenue, and operational KPIs—plus competitor tracking, regulation, and value chains—across 60 countries broadly.

Spot the shifts before they hit your P&L. We track inflection points, adoption curves, pricing moves, and ecosystem plays to show where demand is heading, why it is changing, and what to do next across high-growth markets and disruptive tech

Real-time reads of user behavior. We track shifting priorities, perceptions of today’s and next-gen services, and provider experience, then pace how fast tech moves from trial to adoption, blending buyer, consumer, and channel inputs with social signals (#WhySwitch, #UX).

Partner with our analyst team to build a custom report designed around your business priorities. From analysing market trends to assessing competitors or crafting bespoke datasets, we tailor insights to your needs.
Supplier Intelligence
Discovery & Profiling
Capacity & Footprint
Performance & Risk
Compliance & Governance
Commercial Readiness
Who Supplies Whom
Scorecards & Shortlists
Playbooks & Docs
Category Intelligence
Definition & Scope
Demand & Use Cases
Cost Drivers
Market Structure
Supply Chain Map
Trade & Policy
Operating Norms
Deliverables
Buyer Intelligence
Account Basics
Spend & Scope
Procurement Model
Vendor Requirements
Terms & Policies
Entry Strategy
Pain Points & Triggers
Outputs
Pricing Analysis
Benchmarks
Trends
Should-Cost
Indexation
Landed Cost
Commercial Terms
Deliverables
Brand Analysis
Positioning & Value Prop
Share & Presence
Customer Evidence
Go-to-Market
Digital & Reputation
Compliance & Trust
KPIs & Gaps
Outputs
Full Research Suite comprises of:
Market outlook & trends analysis
Interviews & case studies
Strategic recommendations
Vendor profiles & capabilities analysis
5-year forecasts
8 regions and 60+ country-level data splits
Market segment data splits
12 months of continuous data updates
DELIVERED AS:
PDF EXCEL ONLINE
Voice Analyser Market Size and Share Forecast Outlook 2025 to 2035
Voice Over Internet Protocol (VoIP) Over WLAN (VoWLAN) Market Size and Share Forecast Outlook 2025 to 2035
Voice over Internet Protocol (VoIP) Market Size and Share Forecast Outlook 2025 to 2035
Voice Clinic Services Market Analysis - Size and Share Forecast Outlook 2025 to 2035
Voice Commerce Services Market Analysis - Size, and Share, Forecast Outlook 2025 to 2035
Voice to Text on Mobile Devices Market Size and Share Forecast Outlook 2025 to 2035
Voice Assistants Market Analysis - Size and Share Forecast Outlook 2025 to 2035
Voice Over LTE Market Analysis – Trends & Industry Forecast 2025 to 2035
Voice Over WLAN Market Report – Growth & Forecast 2025 to 2035
Voice Picking Solution Market Analysis by Component, Industry Vertical, Technology, Deployment Mode and Region from 2025 to 2035
Analyzing Voice Over LTE (VOLTE) and Voice Over Wi-Fi Market Share & Insights
VoLTE and Voice Over Wi-Fi Market Outlook 2025 to 2035
Invoice Processing Software Market Size and Share Forecast Outlook 2025 to 2035
UK Voice Over LTE & Voice Over Wi-Fi Market Outlook - Share, Growth & Forecast 2025 to 2035
USA Voice Over LTE (VoLTE) and Voice Over Wi-Fi (VoWi-Fi) Market Report – Demand, Growth & Forecast 2025-2035
Japan Voice Over LTE & Voice Over Wi-Fi Market Report - Trends & Innovations 2025 to 2035
Digital Voice Recorder Market Size and Share Forecast Outlook 2025 to 2035
Germany Voice Over LTE & Voice Over Wi-Fi Market Trends - Growth, Demand & Forecast 2025 to 2035
Speech and Voice Analytics Market Size and Share Forecast Outlook 2025 to 2035
GCC Countries Voice Over LTE & Voice Over Wi-Fi Market Analysis Size, Share & Forecast 2025 to 2035

Thank you!
You will receive an email from our Business Development Manager. Please be sure to check your SPAM/JUNK folder too.
Chat With
MaRIA