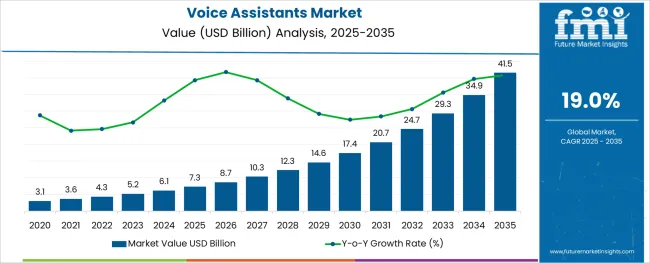
The Voice Assistants Market is estimated to be valued at USD 7.3 billion in 2025 and is projected to reach USD 41.5 billion by 2035, registering a compound annual growth rate (CAGR) of 19.0% over the forecast period.

The voice assistants market is undergoing dynamic growth as enterprises and consumers increasingly prioritize touchless interfaces, real-time command execution, and personalized experiences. The proliferation of connected devices and integration of voice-enabled platforms across smartphones, smart speakers, wearables, and enterprise tools have significantly expanded usage scenarios.
Advancements in machine learning, natural language processing, and contextual AI have made voice assistants more intuitive, secure, and multilingual, enhancing their role in everyday functions. Strategic investments by major tech firms into neural voice models, voice cloning, and edge-based processing are strengthening infrastructure for faster response times and privacy assurance.
Additionally, the enterprise landscape is seeing rising deployment of voice interfaces in customer service, workflow automation, and internal communication systems. With rising digitalization, global language support, and AI-enhanced personalization, the market is expected to sustain upward momentum as organizations and consumers continue to embrace voice-first technologies across daily interactions and business processes.
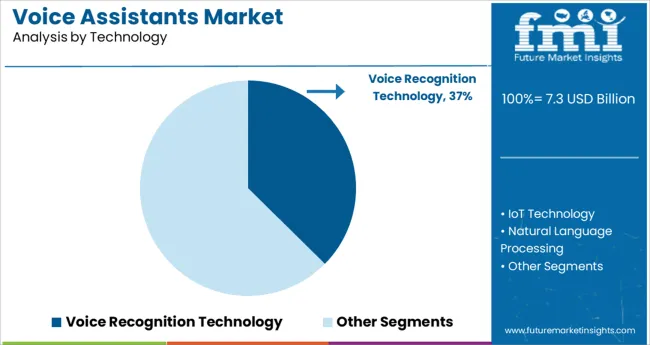
The market is segmented by Technology and End-Use Application and region. By Technology, the market is divided into Voice Recognition Technology, IoT Technology, Natural Language Processing, and Others. In terms of End-Use Application, the market is classified into Corporate Office, Residential Application, Institutional Areas Such As School, Colleges, and Others. Regionally, the market is classified into North America, Latin America, Western Europe, Eastern Europe, Balkan & Baltic Countries, Russia & Belarus, Central Asia, East Asia, South Asia & Pacific, and the Middle East & Africa.

Voice recognition technology is expected to account for 37.4% of revenue within the technology category in 2025, positioning it as the leading technological foundation in the voice assistants market. This dominance has been supported by continuous improvements in speech accuracy, language adaptability, and real-time processing. Enhanced voice biometric systems have improved user authentication and security, enabling broader adoption across banking, healthcare, and enterprise communication platforms.
The shift toward on-device processing is minimizing latency and improving data privacy, further boosting end-user confidence. Integration with AI and NLP tools has enabled context-aware responses, making interactions more seamless and user-friendly.
Voice recognition also offers multilingual flexibility, making it a practical choice for global applications. As organizations focus on creating accessible, hands-free, and efficient digital experiences, the role of voice recognition technology is expected to remain central to future innovation and system architecture.

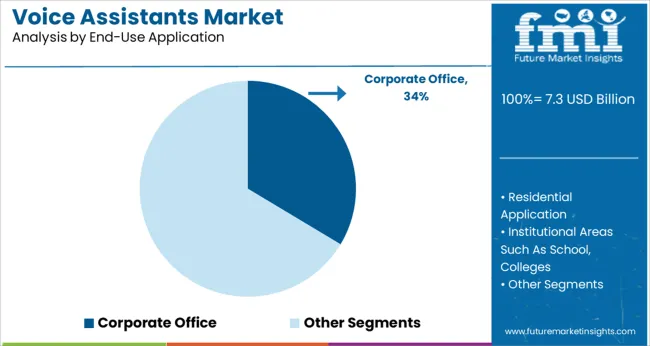
Corporate office applications are projected to hold 33.6% of total market revenue in 2025, making it the dominant end-use application segment. This leadership is driven by the growing emphasis on digital workplace transformation, productivity optimization, and seamless communication tools. Voice assistants are being integrated into virtual meeting platforms, smart scheduling systems, enterprise resource planning, and voice-to-text transcription services to streamline workflow.
The rise of hybrid and remote work environments has accelerated the demand for touchless, voice-controlled collaboration tools that enhance convenience while maintaining efficiency. Enterprises are deploying voice-enabled devices for internal knowledge queries, task automation, and document handling, thereby reducing manual dependency and operational delays.
Additionally, voice technology is playing a critical role in creating inclusive workplaces by supporting accessibility features for differently-abled employees. As corporate infrastructures modernize and prioritize real-time, AI-driven interaction layers, the corporate office segment is expected to maintain its leading position in the voice assistants market.
The demand for voice assistants, as well as sales of voice assistants, is anticipated to increase in recent years. Natural language processing integrated with artificial intelligence is assisting humans in carrying out various activities such as turning on/off lights and other routine work.
Additionally, voice assistants for home automation can be used to control voice activated home devices like Google Home smart voice activated speakers, computers, laptops, washing machines, mobile phones, etc. The demand for voice assistants is therefore anticipated to increase in the upcoming years in order to improve user interaction with the smart assistants escalating the voice assistants market future trends.
Voice assistants holds the potential to revolutionize the way consumers shop to prevent app-hopping.
The Internet of Things has increased the possibility for machine-to-machine and machine-to-human interaction, which is anticipated to create new voice assistant market growth. People's purchasing habits are evolving in both developed and developing nations. There is a shift in favour of online shopping, which has resulted in an increase in sales of voice assistants to cater to the demand for voice assistants.
Customers research products from the comfort of their homes, asking questions about costs and features. This process can be made even more frictionless and interactive by using voice assistants to strengthen the voice assistants adoption trends.
Customers' accelerated adoption of voice assistants, smart assistants, home automation and demand for voice assistants, along with an increase in online shopping, creates opportunities for smart assistants for those who offer voice assistants application solutions and services.
The natural language processing segment held the largest voice assistants market share in terms of technology in 2025. This is primarily attributable to natural language processing's ability to combine statistical, machine learning, and deep learning models with computational linguistics rule-based modelling of human language in the form of text or speech data and "understand" its full meaning, including the speaker's or writer's intent and sentiment.
In contrast, the speech/voice recognition sector ranked second in the voice assistants market size. The segment for text-to-speech recognition is anticipated to have the highest CAGR in the voice assistants market. In terms of end users, the segment for individual users held the largest market share. This was primarily caused by the ongoing shift in consumer preference for smart home appliances and the rising demand for IoT-enabled smart appliances.
Additionally, the need to lessen the human load and make routine tasks more manageable, with the help of home automation, particularly across large enterprises, made the large enterprises segment the second-largest voice assistants market.
The largest voice assistants market share, estimated to be 33.5%, is in North America. Due to the presence of major players associated with voice-activated smart assistant providers in the region, as well as the fact that countries like the United States are quick to adopt new and smart technology, the North American region is predicted to dominate the voice assistants market.
With a projected voice assistants market share of 23.6%, Europe leads the way. The voice assistants market is anticipated to grow significantly in Asia Pacific as a result of the region's rising demand for smart assistants and growing IoT device connectivity across a variety of applications, including homes and offices.
The start-up companies are intensifying their focus on their innovation capabilities and resorting to mergers and acquisitions to develop compact yet high-performance voice assistants.
Avaya purchased CTIntegrations, specialised software development and system integration company in Texas, the USA, in August 2024. In addition to enhancing the Avaya OneCloud AI-powered experience platform, this acquisition is likely to give Avaya's sizable customer base of contact centres access to more digital capabilities.

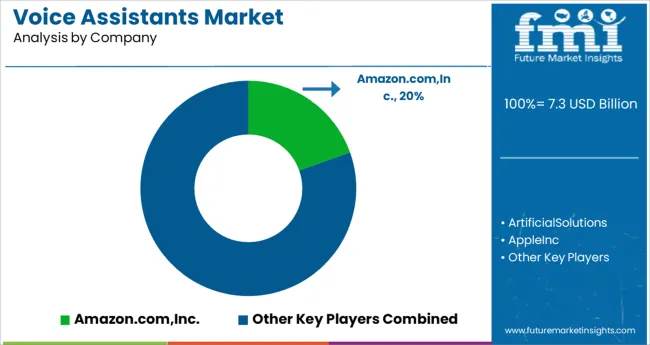
There are several well-known key voice assistant market players, and they compete fiercely by making significant capital investments and spending a lot on advertising.
Google home automation can make a dent in online shopping while also ensuring that Google voice assistants users are directed to its search and YouTube video services. While accelerating voice assistants, Amazon can move beyond commerce into search and attention.
Samsung may surpass its current lead in smartphone sales of voice assistants by offering home automation services. The major tech firms are keenly aware of their own and their competitors' comparative advantages, and they see voice as a chance to fortify their defences while also potentially gaining new, lucrative ground.
Upgrades:
IBM Corporation announced in September 2024 that new features had been added to IBM Watson to improve it as a smart assistant for call centres and other businesses. In order to provide Watson to contact centres as a white label voice assistant without coding, it collaborated with enterprise communications platform IntelePeer.
The inclusion of IntelePeer in the majority of significant contact centre platforms significantly speeds up the creation and deployment process when compared to manually coding a new AI.
Introduction:
The voice-activated Echo device was introduced in 2014 by Amazon.com, Inc. It can play music; provide information about current events, sports scores, and the weather.
Launch:
Samsung has launched the Bixby 3.0 voice assistant in India in April 2024, along with a number of features tailored specifically for that country.
Purchase:
Microsoft Corporation purchased Nuance Communications, Inc. in April 2024. It is a leader and innovator in cloud-based ambient clinical intelligence for healthcare providers and conversational AI.
| Report Attribute | Details |
|---|---|
| Growth rate | CAGR of 19.0% from 2025 to 2035 |
| Base year for estimation | 2024 |
| Historical data | 2020 to 2024 |
| Forecast period | 2025 to 2035 |
| Quantitative units | Revenue in USD million and CAGR from 2025 to 2035 |
| Report coverage | Revenue forecast, volume forecast, company ranking, competitive landscape, growth factors, and trends, Pricing Analysis, |
| Segments covered | Technology, End-use Application, Region |
| Regional scope | North America; Western Europe, Eastern Europe, Middle East, Africa, ASEAN, South Asia, Rest of Asia, Australia and New Zealand |
| Country scope | USA; Canada; Mexico; Germany; UK; France; Italy; Spain; Russia; Belgium; Poland; Czech Republic; China; India; Japan; Australia; Brazil; Argentina; Colombia; Saudi Arabia; UAE; Iran; South Africa |
| Key companies profiled | Amazon.com, Inc., Artificial Solutions, Apple Inc., Honeywell Corporation, Samsung Electronics Co., Ltd., Google Corporation, Interactive Voice Inc., Athom B.V., IBM Corporation, and Nuance Communications, Inc. |
| Customization scope | Free report customization (equivalent to up to 8 analysts’ working days) with purchase. Addition or alteration to country, regional & segment scope. |
| Pricing and purchase options | Avail customized purchase options to meet your exact research needs. |
The global voice assistants market is estimated to be valued at USD 7.3 billion in 2025.
It is projected to reach USD 41.5 billion by 2035.
The market is expected to grow at a 19.0% CAGR between 2025 and 2035.
The key product types are voice recognition technology, iot technology, natural language processing and others.
corporate office segment is expected to dominate with a 33.6% industry share in 2025.


Full Research Suite comprises of:
Market outlook & trends analysis
Interviews & case studies
Strategic recommendations
Vendor profiles & capabilities analysis
5-year forecasts
8 regions and 60+ country-level data splits
Market segment data splits
12 months of continuous data updates
DELIVERED AS:
PDF EXCEL ONLINE
Voice Analyser Market Size and Share Forecast Outlook 2025 to 2035
Voice Over Internet Protocol (VoIP) Over WLAN (VoWLAN) Market Size and Share Forecast Outlook 2025 to 2035
Voice over Internet Protocol (VoIP) Market Size and Share Forecast Outlook 2025 to 2035
Voice Clinic Services Market Analysis - Size and Share Forecast Outlook 2025 to 2035
Voice Commerce Services Market Analysis - Size, and Share, Forecast Outlook 2025 to 2035
Voice to Text on Mobile Devices Market Size and Share Forecast Outlook 2025 to 2035
Voice Assistance Application Market Size and Share Forecast Outlook 2025 to 2035
Voice Over WLAN Market Report – Growth & Forecast 2025 to 2035
Voice Over LTE Market Analysis – Trends & Industry Forecast 2025 to 2035
Voice Picking Solution Market Analysis by Component, Industry Vertical, Technology, Deployment Mode and Region from 2025 to 2035
Analyzing Voice Over LTE (VOLTE) and Voice Over Wi-Fi Market Share & Insights
VoLTE and Voice Over Wi-Fi Market Outlook 2025 to 2035
Invoice Processing Software Market Size and Share Forecast Outlook 2025 to 2035
UK Voice Over LTE & Voice Over Wi-Fi Market Outlook - Share, Growth & Forecast 2025 to 2035
USA Voice Over LTE (VoLTE) and Voice Over Wi-Fi (VoWi-Fi) Market Report – Demand, Growth & Forecast 2025-2035
Japan Voice Over LTE & Voice Over Wi-Fi Market Report - Trends & Innovations 2025 to 2035
Digital Voice Recorder Market Size and Share Forecast Outlook 2025 to 2035
Germany Voice Over LTE & Voice Over Wi-Fi Market Trends - Growth, Demand & Forecast 2025 to 2035
Speech and Voice Analytics Market Size and Share Forecast Outlook 2025 to 2035
GCC Countries Voice Over LTE & Voice Over Wi-Fi Market Analysis Size, Share & Forecast 2025 to 2035

Thank you!
You will receive an email from our Business Development Manager. Please be sure to check your SPAM/JUNK folder too.
Chat With
MaRIA