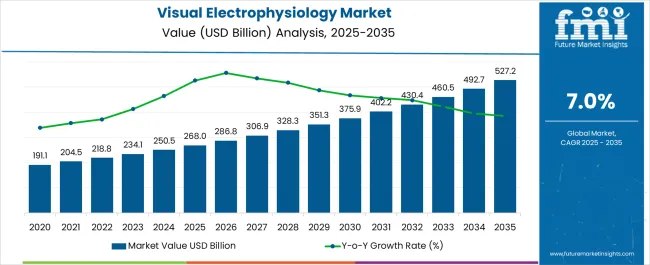
The visual electrophysiology market is anticipated to flourish at a steady CAGR of 7.0% between 2023 and 2033. The market is expected to hold a market share of USD 458.9 million by 2033 while the market is likely to reach a value of USD 234.1 million in 2023.
New technology, materials, and techniques to produce innovative practice solutions significantly contribute to global market growth. In addition to this, the ease of handling visual electrophysiology devices is surging its adoption in home and alternate care settings.
There is spreading awareness of the requirement for occasional eye examinations for early diagnosis of visual disorders. Therefore retinal electrophysiology is expected to surge the demand for visual electrophysiology.
The market size is expected to increase due to the device’s portability and frequent technological advances. The versatility of visual electrophysiology devices for use on adults, children, or animals of all sizes for clinical and research purposes propels its demand.
Attributes | Details |
---|---|
Visual Electrophysiology Market CAGR (2023 to 2033) | 7.0% |
Visual Electrophysiology Market Size (2023) | USD 234.1 million |
Visual Electrophysiology Market Size (2033) | USD 458.9 million |
Rising technological developments and increasing investments in visual electrophysiology devices are expected to boost market growth. Furthermore, the increasing geriatric population in various parts of the world surges the demand for visual electrophysiology.
Rising expenditures in healthcare advancements and growing adoption practice for visual electrophysiology diagnosis are likely to expand the market size. Moreover, the rising prevalence of neurological and eye disorders are key factors that drive the market growth.
Influx funding for research studies, government initiatives, and awareness programs are growing awareness of the benefits of visual electrophysiology. Additionally, using an electroretinogram (ERG) to eliminate any ophthalmic diseases and establishing correct diagnoses are likely to drive the visual electrophysiology adoption trends.
High costs associated with the diagnosis and treatment procedures, along with the lack of experience in using advanced technologies, pose a threat to this market. Moreover, rigid regulations by the government for recording electrical signals in the electrophysiological test are further expected to hinder market growth.
The absence of skilled professionals and the availability of property healthcare infrastructure in developing economies might hamper the visual electrophysiology market.
Growing awareness about the adverse effects of visual and neurological disorders is likely to generate revenue opportunities for the market. Furthermore, increasing research and development (R&D) activities, and technological developments, are expected to accelerate market growth.
Modernization in healthcare devices creates significant opportunities for the market. Additionally, the increasing funding by various governments worldwide is expected to provide growth opportunities. It is important to note that authorities across the world are conducting awareness programs regarding such kinds of tests. This is expected to change the visual electrophysiology market outlook.
Countries | Revenue Share % (2022) |
---|---|
The United States | 33.4% |
Germany | 5.3% |
Japan | 3.9% |
North America | 36.1% |
Europe | 25.9% |
Countries | CAGR % (2023 to 2033) |
---|---|
China | 8.4% |
India | 7.1% |
The United Kingdom | 5.4% |
Australia | 5.7% |
North America holds a notable share of the visual electrophysiology market with a significant revenue of 33%. During the forecast period, the market share is anticipated to expand. This is because of the increasing investments being made in research and development in the region.
There have been increasing cases of eye-related disorders in the region, which is expected to surge the market growth of visual electrophysiology further. Moreover, the ability to be used across age groups is expected to drive this market.
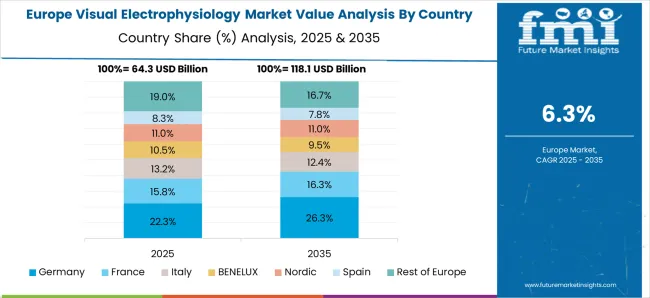
Europe’s visual electrophysiology market held a market share of 25.9% in 2022. Increasing cases of cancer in the region are expected to fuel the growth of the market. Moreover, the rapid advancements in technology are expected to further the rise of this market.
The government in this region is proactive when it comes to dealing with the physical well-being of the population. Therefore, awareness programs are expected to shape the visual electrophysiology market trends in the region.
Asia Pacific is a growing visual electrophysiology market. Improvement of healthcare facilities and economic conditions are likely to surge the market growth.
Japan is also likely to hold a significant market share, owing to the presence of a technologically developed structure. The growing awareness about the importance of eye health is anticipated to bolster the visual electrophysiology market share, in this region. In Asia Pacific as well, increasing investments are being made in research and development, which is expected to drive the market.
Category | By Test Type |
---|---|
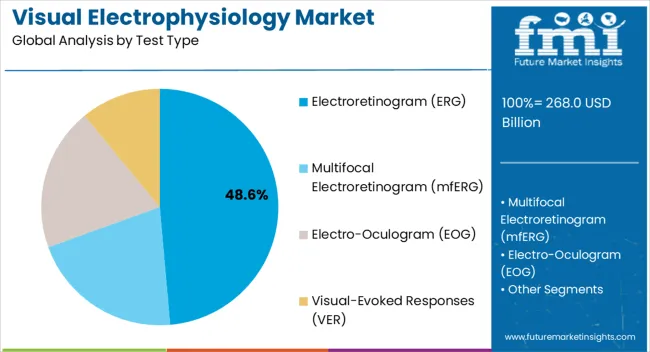
Leading Segment | Electroretinogram (ERG) |
Market Share% (2022) | 38.80% |
Category | By Modality |
---|---|
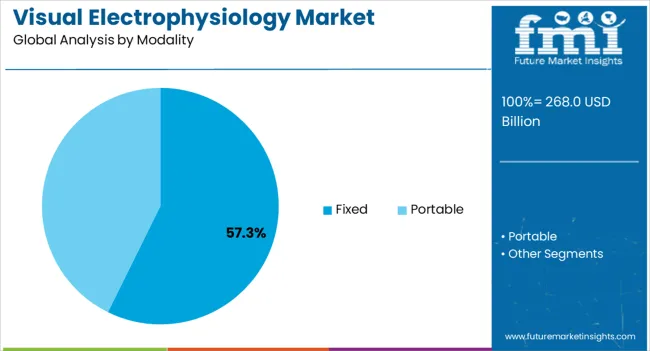
Leading Segment | Fixed |
Market Share% (2022) | 65.90% |
Based on test type, the electroretinogram segment leads the market as it held a market share of 38.80% in 2022. On the other side, the modality category is led by the fixed type segment due to the high consumption. The segment held a market share of 65.90% in 2022.
The ability to locate problems at the early stage and to eliminate specific conditions are increasing the popularity of visual electrophysiology. The startups are offering training to cover recent information on new technology, materials, and techniques for innovative practice solutions. Moreover, certain start-up companies are using traditional methods combined with substantial research and development (R&D) activities. For example,
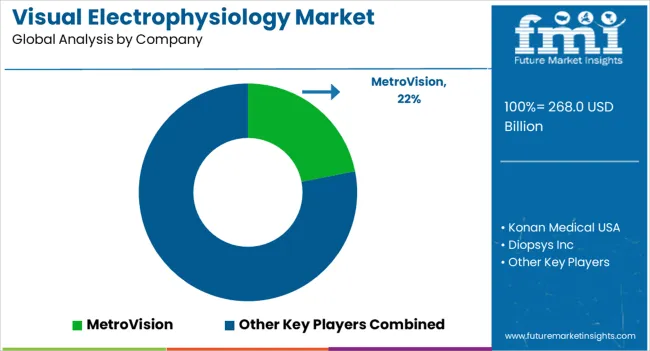
How is the Competitive Landscape in the Visual Electrophysiology Market?
The extensive range of applications including diagnosis, elimination of specific conditions, locating problems at some level of the visual system, etc. is driving key players to improve devices for visual electrophysiology. This is done through research and development (R&D) activities, for clinical and research purposes.
Recent Developments
Table 1: Global Market Value (US$ Million) Forecast by Region, 2018 to 2033
Table 2: Global Market Value (US$ Million) Forecast by Test Type, 2018 to 2033
Table 3: Global Market Value (US$ Million) Forecast by Modality, 2018 to 2033
Table 4: Global Market Value (US$ Million) Forecast by End User, 2018 to 2033
Table 5: North America Market Value (US$ Million) Forecast by Country, 2018 to 2033
Table 6: North America Market Value (US$ Million) Forecast by Test Type, 2018 to 2033
Table 7: North America Market Value (US$ Million) Forecast by Modality, 2018 to 2033
Table 8: North America Market Value (US$ Million) Forecast by End User, 2018 to 2033
Table 9: Latin America Market Value (US$ Million) Forecast by Country, 2018 to 2033
Table 10: Latin America Market Value (US$ Million) Forecast by Test Type, 2018 to 2033
Table 11: Latin America Market Value (US$ Million) Forecast by Modality, 2018 to 2033
Table 12: Latin America Market Value (US$ Million) Forecast by End User, 2018 to 2033
Table 13: Western Europe Market Value (US$ Million) Forecast by Country, 2018 to 2033
Table 14: Western Europe Market Value (US$ Million) Forecast by Test Type, 2018 to 2033
Table 15: Western Europe Market Value (US$ Million) Forecast by Modality, 2018 to 2033
Table 16: Western Europe Market Value (US$ Million) Forecast by End User, 2018 to 2033
Table 17: Eastern Europe Market Value (US$ Million) Forecast by Country, 2018 to 2033
Table 18: Eastern Europe Market Value (US$ Million) Forecast by Test Type, 2018 to 2033
Table 19: Eastern Europe Market Value (US$ Million) Forecast by Modality, 2018 to 2033
Table 20: Eastern Europe Market Value (US$ Million) Forecast by End User, 2018 to 2033
Table 21: South Asia and Pacific Market Value (US$ Million) Forecast by Country, 2018 to 2033
Table 22: South Asia and Pacific Market Value (US$ Million) Forecast by Test Type, 2018 to 2033
Table 23: South Asia and Pacific Market Value (US$ Million) Forecast by Modality, 2018 to 2033
Table 24: South Asia and Pacific Market Value (US$ Million) Forecast by End User, 2018 to 2033
Table 25: East Asia Market Value (US$ Million) Forecast by Country, 2018 to 2033
Table 26: East Asia Market Value (US$ Million) Forecast by Test Type, 2018 to 2033
Table 27: East Asia Market Value (US$ Million) Forecast by Modality, 2018 to 2033
Table 28: East Asia Market Value (US$ Million) Forecast by End User, 2018 to 2033
Table 29: Middle East and Africa Market Value (US$ Million) Forecast by Country, 2018 to 2033
Table 30: Middle East and Africa Market Value (US$ Million) Forecast by Test Type, 2018 to 2033
Table 31: Middle East and Africa Market Value (US$ Million) Forecast by Modality, 2018 to 2033
Table 32: Middle East and Africa Market Value (US$ Million) Forecast by End User, 2018 to 2033
Figure 1: Global Market Value (US$ Million) by Test Type, 2023 to 2033
Figure 2: Global Market Value (US$ Million) by Modality, 2023 to 2033
Figure 3: Global Market Value (US$ Million) by End User, 2023 to 2033
Figure 4: Global Market Value (US$ Million) by Region, 2023 to 2033
Figure 5: Global Market Value (US$ Million) Analysis by Region, 2018 to 2033
Figure 6: Global Market Value Share (%) and BPS Analysis by Region, 2023 to 2033
Figure 7: Global Market Y-o-Y Growth (%) Projections by Region, 2023 to 2033
Figure 8: Global Market Value (US$ Million) Analysis by Test Type, 2018 to 2033
Figure 9: Global Market Value Share (%) and BPS Analysis by Test Type, 2023 to 2033
Figure 10: Global Market Y-o-Y Growth (%) Projections by Test Type, 2023 to 2033
Figure 11: Global Market Value (US$ Million) Analysis by Modality, 2018 to 2033
Figure 12: Global Market Value Share (%) and BPS Analysis by Modality, 2023 to 2033
Figure 13: Global Market Y-o-Y Growth (%) Projections by Modality, 2023 to 2033
Figure 14: Global Market Value (US$ Million) Analysis by End User, 2018 to 2033
Figure 15: Global Market Value Share (%) and BPS Analysis by End User, 2023 to 2033
Figure 16: Global Market Y-o-Y Growth (%) Projections by End User, 2023 to 2033
Figure 17: Global Market Attractiveness by Test Type, 2023 to 2033
Figure 18: Global Market Attractiveness by Modality, 2023 to 2033
Figure 19: Global Market Attractiveness by End User, 2023 to 2033
Figure 20: Global Market Attractiveness by Region, 2023 to 2033
Figure 21: North America Market Value (US$ Million) by Test Type, 2023 to 2033
Figure 22: North America Market Value (US$ Million) by Modality, 2023 to 2033
Figure 23: North America Market Value (US$ Million) by End User, 2023 to 2033
Figure 24: North America Market Value (US$ Million) by Country, 2023 to 2033
Figure 25: North America Market Value (US$ Million) Analysis by Country, 2018 to 2033
Figure 26: North America Market Value Share (%) and BPS Analysis by Country, 2023 to 2033
Figure 27: North America Market Y-o-Y Growth (%) Projections by Country, 2023 to 2033
Figure 28: North America Market Value (US$ Million) Analysis by Test Type, 2018 to 2033
Figure 29: North America Market Value Share (%) and BPS Analysis by Test Type, 2023 to 2033
Figure 30: North America Market Y-o-Y Growth (%) Projections by Test Type, 2023 to 2033
Figure 31: North America Market Value (US$ Million) Analysis by Modality, 2018 to 2033
Figure 32: North America Market Value Share (%) and BPS Analysis by Modality, 2023 to 2033
Figure 33: North America Market Y-o-Y Growth (%) Projections by Modality, 2023 to 2033
Figure 34: North America Market Value (US$ Million) Analysis by End User, 2018 to 2033
Figure 35: North America Market Value Share (%) and BPS Analysis by End User, 2023 to 2033
Figure 36: North America Market Y-o-Y Growth (%) Projections by End User, 2023 to 2033
Figure 37: North America Market Attractiveness by Test Type, 2023 to 2033
Figure 38: North America Market Attractiveness by Modality, 2023 to 2033
Figure 39: North America Market Attractiveness by End User, 2023 to 2033
Figure 40: North America Market Attractiveness by Country, 2023 to 2033
Figure 41: Latin America Market Value (US$ Million) by Test Type, 2023 to 2033
Figure 42: Latin America Market Value (US$ Million) by Modality, 2023 to 2033
Figure 43: Latin America Market Value (US$ Million) by End User, 2023 to 2033
Figure 44: Latin America Market Value (US$ Million) by Country, 2023 to 2033
Figure 45: Latin America Market Value (US$ Million) Analysis by Country, 2018 to 2033
Figure 46: Latin America Market Value Share (%) and BPS Analysis by Country, 2023 to 2033
Figure 47: Latin America Market Y-o-Y Growth (%) Projections by Country, 2023 to 2033
Figure 48: Latin America Market Value (US$ Million) Analysis by Test Type, 2018 to 2033
Figure 49: Latin America Market Value Share (%) and BPS Analysis by Test Type, 2023 to 2033
Figure 50: Latin America Market Y-o-Y Growth (%) Projections by Test Type, 2023 to 2033
Figure 51: Latin America Market Value (US$ Million) Analysis by Modality, 2018 to 2033
Figure 52: Latin America Market Value Share (%) and BPS Analysis by Modality, 2023 to 2033
Figure 53: Latin America Market Y-o-Y Growth (%) Projections by Modality, 2023 to 2033
Figure 54: Latin America Market Value (US$ Million) Analysis by End User, 2018 to 2033
Figure 55: Latin America Market Value Share (%) and BPS Analysis by End User, 2023 to 2033
Figure 56: Latin America Market Y-o-Y Growth (%) Projections by End User, 2023 to 2033
Figure 57: Latin America Market Attractiveness by Test Type, 2023 to 2033
Figure 58: Latin America Market Attractiveness by Modality, 2023 to 2033
Figure 59: Latin America Market Attractiveness by End User, 2023 to 2033
Figure 60: Latin America Market Attractiveness by Country, 2023 to 2033
Figure 61: Western Europe Market Value (US$ Million) by Test Type, 2023 to 2033
Figure 62: Western Europe Market Value (US$ Million) by Modality, 2023 to 2033
Figure 63: Western Europe Market Value (US$ Million) by End User, 2023 to 2033
Figure 64: Western Europe Market Value (US$ Million) by Country, 2023 to 2033
Figure 65: Western Europe Market Value (US$ Million) Analysis by Country, 2018 to 2033
Figure 66: Western Europe Market Value Share (%) and BPS Analysis by Country, 2023 to 2033
Figure 67: Western Europe Market Y-o-Y Growth (%) Projections by Country, 2023 to 2033
Figure 68: Western Europe Market Value (US$ Million) Analysis by Test Type, 2018 to 2033
Figure 69: Western Europe Market Value Share (%) and BPS Analysis by Test Type, 2023 to 2033
Figure 70: Western Europe Market Y-o-Y Growth (%) Projections by Test Type, 2023 to 2033
Figure 71: Western Europe Market Value (US$ Million) Analysis by Modality, 2018 to 2033
Figure 72: Western Europe Market Value Share (%) and BPS Analysis by Modality, 2023 to 2033
Figure 73: Western Europe Market Y-o-Y Growth (%) Projections by Modality, 2023 to 2033
Figure 74: Western Europe Market Value (US$ Million) Analysis by End User, 2018 to 2033
Figure 75: Western Europe Market Value Share (%) and BPS Analysis by End User, 2023 to 2033
Figure 76: Western Europe Market Y-o-Y Growth (%) Projections by End User, 2023 to 2033
Figure 77: Western Europe Market Attractiveness by Test Type, 2023 to 2033
Figure 78: Western Europe Market Attractiveness by Modality, 2023 to 2033
Figure 79: Western Europe Market Attractiveness by End User, 2023 to 2033
Figure 80: Western Europe Market Attractiveness by Country, 2023 to 2033
Figure 81: Eastern Europe Market Value (US$ Million) by Test Type, 2023 to 2033
Figure 82: Eastern Europe Market Value (US$ Million) by Modality, 2023 to 2033
Figure 83: Eastern Europe Market Value (US$ Million) by End User, 2023 to 2033
Figure 84: Eastern Europe Market Value (US$ Million) by Country, 2023 to 2033
Figure 85: Eastern Europe Market Value (US$ Million) Analysis by Country, 2018 to 2033
Figure 86: Eastern Europe Market Value Share (%) and BPS Analysis by Country, 2023 to 2033
Figure 87: Eastern Europe Market Y-o-Y Growth (%) Projections by Country, 2023 to 2033
Figure 88: Eastern Europe Market Value (US$ Million) Analysis by Test Type, 2018 to 2033
Figure 89: Eastern Europe Market Value Share (%) and BPS Analysis by Test Type, 2023 to 2033
Figure 90: Eastern Europe Market Y-o-Y Growth (%) Projections by Test Type, 2023 to 2033
Figure 91: Eastern Europe Market Value (US$ Million) Analysis by Modality, 2018 to 2033
Figure 92: Eastern Europe Market Value Share (%) and BPS Analysis by Modality, 2023 to 2033
Figure 93: Eastern Europe Market Y-o-Y Growth (%) Projections by Modality, 2023 to 2033
Figure 94: Eastern Europe Market Value (US$ Million) Analysis by End User, 2018 to 2033
Figure 95: Eastern Europe Market Value Share (%) and BPS Analysis by End User, 2023 to 2033
Figure 96: Eastern Europe Market Y-o-Y Growth (%) Projections by End User, 2023 to 2033
Figure 97: Eastern Europe Market Attractiveness by Test Type, 2023 to 2033
Figure 98: Eastern Europe Market Attractiveness by Modality, 2023 to 2033
Figure 99: Eastern Europe Market Attractiveness by End User, 2023 to 2033
Figure 100: Eastern Europe Market Attractiveness by Country, 2023 to 2033
Figure 101: South Asia and Pacific Market Value (US$ Million) by Test Type, 2023 to 2033
Figure 102: South Asia and Pacific Market Value (US$ Million) by Modality, 2023 to 2033
Figure 103: South Asia and Pacific Market Value (US$ Million) by End User, 2023 to 2033
Figure 104: South Asia and Pacific Market Value (US$ Million) by Country, 2023 to 2033
Figure 105: South Asia and Pacific Market Value (US$ Million) Analysis by Country, 2018 to 2033
Figure 106: South Asia and Pacific Market Value Share (%) and BPS Analysis by Country, 2023 to 2033
Figure 107: South Asia and Pacific Market Y-o-Y Growth (%) Projections by Country, 2023 to 2033
Figure 108: South Asia and Pacific Market Value (US$ Million) Analysis by Test Type, 2018 to 2033
Figure 109: South Asia and Pacific Market Value Share (%) and BPS Analysis by Test Type, 2023 to 2033
Figure 110: South Asia and Pacific Market Y-o-Y Growth (%) Projections by Test Type, 2023 to 2033
Figure 111: South Asia and Pacific Market Value (US$ Million) Analysis by Modality, 2018 to 2033
Figure 112: South Asia and Pacific Market Value Share (%) and BPS Analysis by Modality, 2023 to 2033
Figure 113: South Asia and Pacific Market Y-o-Y Growth (%) Projections by Modality, 2023 to 2033
Figure 114: South Asia and Pacific Market Value (US$ Million) Analysis by End User, 2018 to 2033
Figure 115: South Asia and Pacific Market Value Share (%) and BPS Analysis by End User, 2023 to 2033
Figure 116: South Asia and Pacific Market Y-o-Y Growth (%) Projections by End User, 2023 to 2033
Figure 117: South Asia and Pacific Market Attractiveness by Test Type, 2023 to 2033
Figure 118: South Asia and Pacific Market Attractiveness by Modality, 2023 to 2033
Figure 119: South Asia and Pacific Market Attractiveness by End User, 2023 to 2033
Figure 120: South Asia and Pacific Market Attractiveness by Country, 2023 to 2033
Figure 121: East Asia Market Value (US$ Million) by Test Type, 2023 to 2033
Figure 122: East Asia Market Value (US$ Million) by Modality, 2023 to 2033
Figure 123: East Asia Market Value (US$ Million) by End User, 2023 to 2033
Figure 124: East Asia Market Value (US$ Million) by Country, 2023 to 2033
Figure 125: East Asia Market Value (US$ Million) Analysis by Country, 2018 to 2033
Figure 126: East Asia Market Value Share (%) and BPS Analysis by Country, 2023 to 2033
Figure 127: East Asia Market Y-o-Y Growth (%) Projections by Country, 2023 to 2033
Figure 128: East Asia Market Value (US$ Million) Analysis by Test Type, 2018 to 2033
Figure 129: East Asia Market Value Share (%) and BPS Analysis by Test Type, 2023 to 2033
Figure 130: East Asia Market Y-o-Y Growth (%) Projections by Test Type, 2023 to 2033
Figure 131: East Asia Market Value (US$ Million) Analysis by Modality, 2018 to 2033
Figure 132: East Asia Market Value Share (%) and BPS Analysis by Modality, 2023 to 2033
Figure 133: East Asia Market Y-o-Y Growth (%) Projections by Modality, 2023 to 2033
Figure 134: East Asia Market Value (US$ Million) Analysis by End User, 2018 to 2033
Figure 135: East Asia Market Value Share (%) and BPS Analysis by End User, 2023 to 2033
Figure 136: East Asia Market Y-o-Y Growth (%) Projections by End User, 2023 to 2033
Figure 137: East Asia Market Attractiveness by Test Type, 2023 to 2033
Figure 138: East Asia Market Attractiveness by Modality, 2023 to 2033
Figure 139: East Asia Market Attractiveness by End User, 2023 to 2033
Figure 140: East Asia Market Attractiveness by Country, 2023 to 2033
Figure 141: Middle East and Africa Market Value (US$ Million) by Test Type, 2023 to 2033
Figure 142: Middle East and Africa Market Value (US$ Million) by Modality, 2023 to 2033
Figure 143: Middle East and Africa Market Value (US$ Million) by End User, 2023 to 2033
Figure 144: Middle East and Africa Market Value (US$ Million) by Country, 2023 to 2033
Figure 145: Middle East and Africa Market Value (US$ Million) Analysis by Country, 2018 to 2033
Figure 146: Middle East and Africa Market Value Share (%) and BPS Analysis by Country, 2023 to 2033
Figure 147: Middle East and Africa Market Y-o-Y Growth (%) Projections by Country, 2023 to 2033
Figure 148: Middle East and Africa Market Value (US$ Million) Analysis by Test Type, 2018 to 2033
Figure 149: Middle East and Africa Market Value Share (%) and BPS Analysis by Test Type, 2023 to 2033
Figure 150: Middle East and Africa Market Y-o-Y Growth (%) Projections by Test Type, 2023 to 2033
Figure 151: Middle East and Africa Market Value (US$ Million) Analysis by Modality, 2018 to 2033
Figure 152: Middle East and Africa Market Value Share (%) and BPS Analysis by Modality, 2023 to 2033
Figure 153: Middle East and Africa Market Y-o-Y Growth (%) Projections by Modality, 2023 to 2033
Figure 154: Middle East and Africa Market Value (US$ Million) Analysis by End User, 2018 to 2033
Figure 155: Middle East and Africa Market Value Share (%) and BPS Analysis by End User, 2023 to 2033
Figure 156: Middle East and Africa Market Y-o-Y Growth (%) Projections by End User, 2023 to 2033
Figure 157: Middle East and Africa Market Attractiveness by Test Type, 2023 to 2033
Figure 158: Middle East and Africa Market Attractiveness by Modality, 2023 to 2033
Figure 159: Middle East and Africa Market Attractiveness by End User, 2023 to 2033
Figure 160: Middle East and Africa Market Attractiveness by Country, 2023 to 2033
The market in China is expected to record a CAGR of 8.4% through 2033.
Abbott, Biosense Webster Inc., Biotronik are the prominent market players.
The industry is forecast to record a CAGR of 7.0% through 2033.
The industry is expected to reach USD 458.9 million by 2033.
Europe’s visual electrophysiology market held a market share of 25.9% in 2022.
Explore Similar Insights
Thank you!
You will receive an email from our Business Development Manager. Please be sure to check your SPAM/JUNK folder too.