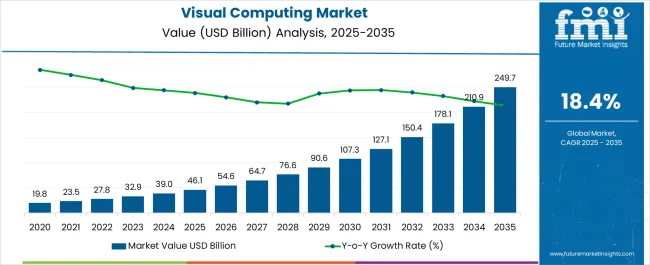
The Visual Computing Market is estimated to be valued at USD 46.1 billion in 2025 and is projected to reach USD 249.7 billion by 2035, registering a compound annual growth rate (CAGR) of 18.4% over the forecast period.
| Metric | Value |
|---|---|
| Visual Computing Market Estimated Value in (2025 E) | USD 46.1 billion |
| Visual Computing Market Forecast Value in (2035 F) | USD 249.7 billion |
| Forecast CAGR (2025 to 2035) | 18.4% |
The visual computing market is gaining momentum, driven by rapid advances in graphics processing technologies, immersive content development, and the rising demand for real-time rendering across industries. Hardware and software innovation has significantly expanded use cases in entertainment, healthcare, automotive, and industrial design. The widespread adoption of artificial intelligence, augmented reality, and high-definition content creation has further accelerated market penetration.
Investor briefings and technology company reports have highlighted ongoing investments in GPUs, high-performance displays, and cloud-based visual computing platforms. Additionally, the gaming industry’s continuous expansion, coupled with the proliferation of esports and virtual worlds, has reinforced demand for high-fidelity computing capabilities.
Healthcare providers and automotive manufacturers are also leveraging visual computing for simulations, diagnostics, and design optimization. Future growth is expected to be propelled by integration with cloud services, energy-efficient chipsets, and increasing accessibility of immersive visual platforms for consumers and enterprises alike.
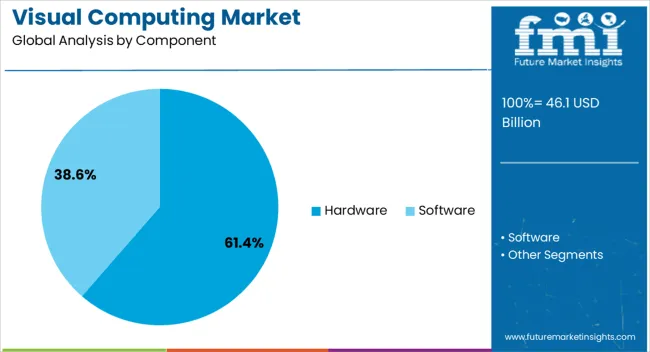
The Hardware segment is projected to contribute 61.4% of the visual computing market revenue in 2025, establishing itself as the dominant component category. Growth in this segment has been supported by the continuous development of high-performance GPUs, processors, and dedicated accelerators that power real-time visualization and complex simulations.
Hardware has remained integral to enabling efficient rendering, immersive graphics, and seamless virtual experiences across multiple applications. Reports from technology firms have emphasized the surge in demand for advanced gaming consoles, workstations, and data center infrastructure that rely heavily on robust hardware architectures.
The rising popularity of AI-driven visual applications and 3D modeling has also heightened the requirement for powerful computing units. As consumer and enterprise markets seek enhanced performance, scalability, and reduced latency, the Hardware segment is expected to maintain its leadership, strengthened by ongoing innovations in processing efficiency and energy optimization.
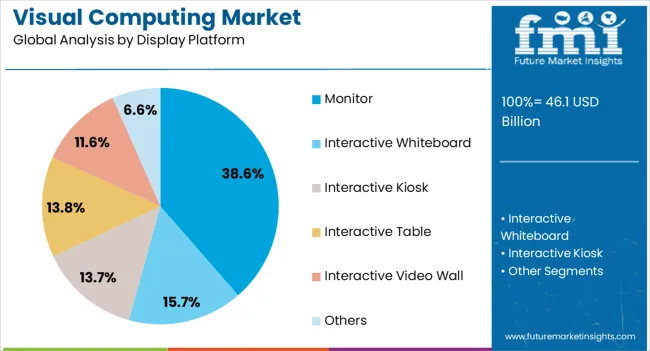
The Monitor segment is projected to account for 38.6% of the visual computing market revenue in 2025, maintaining its position as the leading display platform. Growth in this segment has been influenced by the increased demand for high-resolution, high-refresh-rate displays that cater to both professional and consumer needs.
Gaming, content creation, and industrial design sectors have consistently driven demand for monitors capable of delivering superior color accuracy and real-time visual feedback. Industry publications have highlighted advancements in display technologies, including OLED, Mini-LED, and curved monitors, which enhance immersion and visual clarity.
Additionally, the shift toward remote working and hybrid learning environments has reinforced monitor adoption for productivity and collaboration. With manufacturers continually innovating to deliver energy-efficient and ergonomically designed monitors, this segment is expected to retain its market share, supported by consumer expectations for premium display performance.
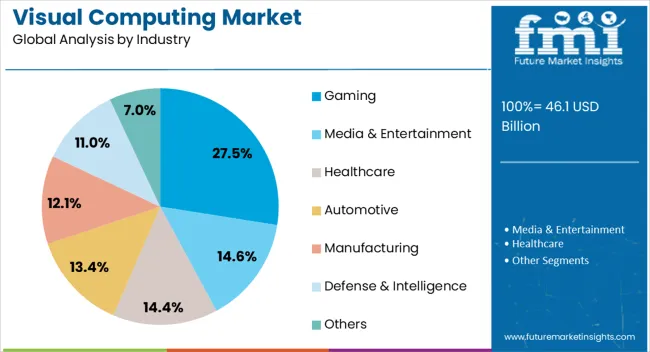
The Gaming segment is projected to capture 27.5% of the visual computing market revenue in 2025, leading industry-based adoption. This dominance has been driven by the gaming sector’s reliance on advanced visual computing for immersive gameplay, realistic graphics, and interactive experiences.
Esports, online multiplayer platforms, and virtual reality gaming have amplified the demand for high-performance computing hardware and visual platforms. Gaming studios and hardware manufacturers have continued to invest in developing optimized GPUs, displays, and peripheral technologies to meet growing consumer expectations.
Industry reports have noted strong consumer spending on gaming systems and accessories, supported by expanding gaming communities worldwide. Furthermore, the increasing adoption of cloud gaming services has broadened access to high-end gaming experiences, further stimulating demand for visual computing solutions. As innovation in ray tracing, AI-enhanced rendering, and virtual environments advances, the Gaming segment is expected to remain the primary driver of visual computing market growth.
As per the FMI study, the market for visual computing garnered revenue of around USD 46.1 billion in 2025 and advanced at a growth rate of 22.4% from 2020 to 2025. This growth was driven by increasing demand for simulation products, virtual reality, video content on mobile devices, and gaming consoles.
Looking ahead, the demand outlook for 2025 to 2035 indicates a promising trajectory, with continued growth expected due to advancements in technologies like deep learning, computer vision, and the proliferation of immersive experiences.
Factors such as expanding internet penetration, strengthening data speeds of wireless networks, and the growing adoption of visual computing across industries offer optimistic prospects for sustained revenue growth in the market in the coming years. All these factors are fostering the anticipated market size of USD 249.7.0 billion by 2035.
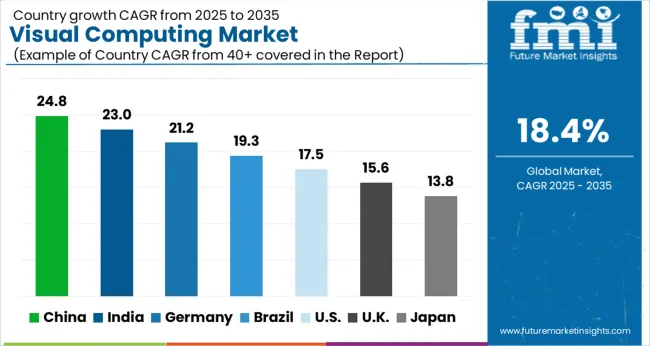
The United States of America is projected to offer a legion of opportunities for visual computing, with a thriving market size expected to reach USD 249.7.0 billion by 2035, significantly aided by the presence of a few top companies in the world, such as Apple, Microsoft, and Google, who are based there.
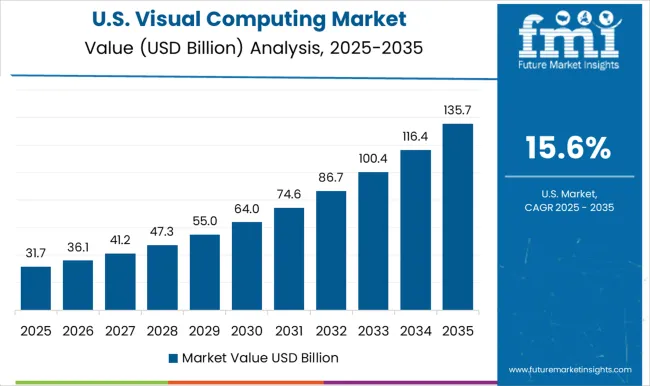
The country's technological infrastructure, innovative ecosystem, and diverse industry verticals provide a fertile ground for the growth and adoption of visual computing solutions. Also, with a strong focus on sectors like gaming, entertainment, healthcare, manufacturing, and automotive, the United States presents a promising landscape for visual computing companies to explore and capitalize on the immense opportunities available in this dynamic market.
The growth outlook for the visual computing industry in China is highly promising with a projected CAGR of 19.5% during the forecast period with a market size of USD 15.4 billion by 2035.
The country offers a fertile ground for visual computing innovation and adoption with China's rapid technological advancements, strong manufacturing capabilities, and substantial market size. Further, the increasing demand for augmented reality (AR), virtual reality (VR), gaming, e-commerce, and other visual-intensive applications is driving the growth of the visual computing industry in China.
Government support, investments in research and development, and a growing consumer base also contribute to the positive growth outlook. As China continues to embrace digital transformation and technological innovation, the visual computing industry is expected to thrive and play a pivotal role in shaping the future of various sectors, ranging from entertainment and education to manufacturing and healthcare.
The hardware component is projected to lead the market due to several factors. The advancements in technology have led to the development of powerful and efficient hardware components, providing the necessary processing capabilities for complex visual computing tasks.
The increasing demand for immersive experiences, such as virtual reality (VR) and augmented reality (AR), requires robust hardware to deliver high-quality graphics and seamless performance, in turn, fostering the segment’s growth.
The integration of visual computing in various industries, including gaming, healthcare, and automotive, necessitates hardware components that can handle the computational requirements is also expected to boost the market growth. Moreover, the significant growth of data-intensive applications and the need for real-time analytics drive the demand for powerful hardware to process and analyze vast amounts of visual data.
The gaming industry is anticipated to top the visual computing industry, achieving an 18.2% CAGR from 2025 to 2035. The demand for visually stunning and realistic gaming experiences drives the need for cutting-edge visual computing technologies, such as high-performance graphics cards, rendering techniques, and real-time visual processing.
Gaming is expected to remain a key driver in pushing the boundaries of the visual computing industry, fueling innovation and shaping the future of immersive entertainment as it continues to evolve and expand.
The competition in the visual computing industry is intense and dynamic, driven by the constant quest for innovation, technological advancements, and market dominance. Further, established players, emerging startups, and technology giants engage in fierce competition are vying for market share and supremacy.
Companies compete on various fronts, including product portfolio, performance, price, reliability, scalability, and customer support.
Continuous research and development efforts are undertaken to enhance visual computing technologies, improve rendering capabilities, and develop more efficient algorithms. Furthermore, strategic partnerships, collaborations, and acquisitions play a crucial role in gaining a competitive edge and expanding market reach.
The industry's rapid evolution and growing demand across sectors such as gaming, entertainment, healthcare, and automotive fuel the competitive landscape. To stay ahead, companies invest in talent acquisition, intellectual property, and cutting-edge research, ensuring they are at the forefront of emerging trends and technologies.
In the fiercely competitive environment, innovation, differentiation, and customer-centric solutions are paramount to achieving sustained success in the dynamic visual computing industry.
Recent Development in the Market for Visual Computing
The global visual computing market is estimated to be valued at USD 46.1 billion in 2025.
The market size for the visual computing market is projected to reach USD 249.7 billion by 2035.
The visual computing market is expected to grow at a 18.4% CAGR between 2025 and 2035.
The key product types in visual computing market are hardware and software.
In terms of display platform, monitor segment to command 38.6% share in the visual computing market in 2025.


Our Research Products

The "Full Research Suite" delivers actionable market intel, deep dives on markets or technologies, so clients act faster, cut risk, and unlock growth.

The Leaderboard benchmarks and ranks top vendors, classifying them as Established Leaders, Leading Challengers, or Disruptors & Challengers.

Locates where complements amplify value and substitutes erode it, forecasting net impact by horizon

We deliver granular, decision-grade intel: market sizing, 5-year forecasts, pricing, adoption, usage, revenue, and operational KPIs—plus competitor tracking, regulation, and value chains—across 60 countries broadly.

Spot the shifts before they hit your P&L. We track inflection points, adoption curves, pricing moves, and ecosystem plays to show where demand is heading, why it is changing, and what to do next across high-growth markets and disruptive tech

Real-time reads of user behavior. We track shifting priorities, perceptions of today’s and next-gen services, and provider experience, then pace how fast tech moves from trial to adoption, blending buyer, consumer, and channel inputs with social signals (#WhySwitch, #UX).

Partner with our analyst team to build a custom report designed around your business priorities. From analysing market trends to assessing competitors or crafting bespoke datasets, we tailor insights to your needs.
Supplier Intelligence
Discovery & Profiling
Capacity & Footprint
Performance & Risk
Compliance & Governance
Commercial Readiness
Who Supplies Whom
Scorecards & Shortlists
Playbooks & Docs
Category Intelligence
Definition & Scope
Demand & Use Cases
Cost Drivers
Market Structure
Supply Chain Map
Trade & Policy
Operating Norms
Deliverables
Buyer Intelligence
Account Basics
Spend & Scope
Procurement Model
Vendor Requirements
Terms & Policies
Entry Strategy
Pain Points & Triggers
Outputs
Pricing Analysis
Benchmarks
Trends
Should-Cost
Indexation
Landed Cost
Commercial Terms
Deliverables
Brand Analysis
Positioning & Value Prop
Share & Presence
Customer Evidence
Go-to-Market
Digital & Reputation
Compliance & Trust
KPIs & Gaps
Outputs
Full Research Suite comprises of:
Market outlook & trends analysis
Interviews & case studies
Strategic recommendations
Vendor profiles & capabilities analysis
5-year forecasts
8 regions and 60+ country-level data splits
Market segment data splits
12 months of continuous data updates
DELIVERED AS:
PDF EXCEL ONLINE
Visual Electrophysiology Market Size and Share Forecast Outlook 2025 to 2035
Visual Analytics Market Size and Share Forecast Outlook 2025 to 2035
Visualiser Market Size and Share Forecast Outlook 2025 to 2035
Pure Visual Perception Solution Market Size and Share Forecast Outlook 2025 to 2035
Surgical Visualization Market
Endoscopy Visualization Systems Market Size and Share Forecast Outlook 2025 to 2035
Endoscopy Visualization System And Component Market Analysis – Trends & Forecast 2024-2034
Logistics Visualization System Market
Arthroscopy Visualization Systems Market Size and Share Forecast Outlook 2025 to 2035
Audible and Visual Signaling Devices Market Analysis by Product Type, End-Use Industry, and Region through 2035
Advanced (3D/4D) Visualization Systems Market Analysis by Platform, End User, Application, and Region through 2035
Fog Computing Market
Brain Computing Interfaces Market Size and Share Forecast Outlook 2025 to 2035
Swarm Computing Market Size and Share Forecast Outlook 2025 to 2035
Cloud Computing Market Size and Share Forecast Outlook 2025 to 2035
Mobile Computing Devices Market Insights – Growth & Forecast 2023-2033
Central Computing Architecture Vehicle OS Market Forecast and Outlook 2025 to 2035
Spatial Computing Market Size and Share Forecast Outlook 2025 to 2035
Quantum Computing Market Growth – Trends & Forecast 2025 to 2035
Wearable Computing Market Trends – Growth & Forecast 2025 to 2035

Thank you!
You will receive an email from our Business Development Manager. Please be sure to check your SPAM/JUNK folder too.
Chat With
MaRIA