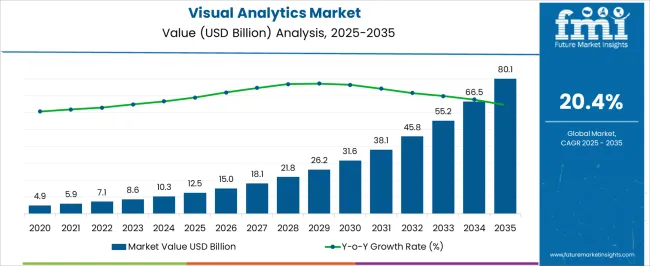
The Visual Analytics Market is estimated to be valued at USD 12.5 billion in 2025 and is projected to reach USD 80.1 billion by 2035, registering a compound annual growth rate (CAGR) of 20.4% over the forecast period.

| Metric | Value |
|---|---|
| Visual Analytics Market Estimated Value in (2025 E) | USD 12.5 billion |
| Visual Analytics Market Forecast Value in (2035 F) | USD 80.1 billion |
| Forecast CAGR (2025 to 2035) | 20.4% |
The visual analytics market is experiencing strong momentum as enterprises increasingly prioritize data driven decision making, advanced visualization, and predictive insights to enhance competitiveness. Organizations are adopting these solutions to simplify complex data sets, enable real time analysis, and support agile business strategies.
Cloud based deployments are gaining traction due to their scalability, lower infrastructure costs, and ability to integrate with advanced analytics tools, enhancing accessibility across industries. The growing focus on digital transformation, regulatory compliance, and operational efficiency is further accelerating demand.
Advancements in artificial intelligence, machine learning integration, and interactive dashboards are reshaping how enterprises extract value from data. The market outlook remains optimistic as businesses continue to expand their analytics capabilities to drive innovation, improve customer experiences, and streamline operations.

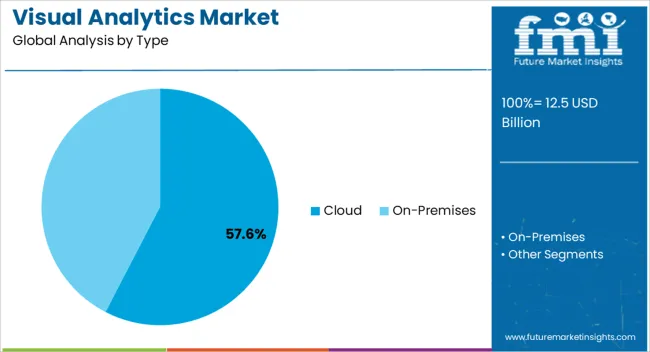
The cloud segment is projected to hold 57.60% of total market revenue by 2025 within the type category, establishing it as the leading deployment model. This growth is being driven by cost effectiveness, flexible scalability, and seamless accessibility across geographic locations.
Cloud based visual analytics platforms allow enterprises to process vast volumes of structured and unstructured data without the constraints of on premise infrastructure. Their compatibility with artificial intelligence and machine learning models further strengthens decision making efficiency.
As organizations increasingly embrace hybrid work models and remote collaboration, cloud solutions have become integral to supporting decentralized data access and real time insights. The demand for continuous innovation and reduced time to market has further reinforced the adoption of cloud based systems, securing their leadership in this segment.

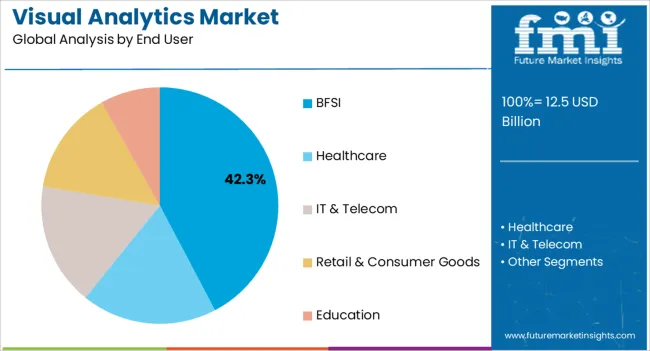
The BFSI segment is anticipated to account for 42.30% of market revenue by 2025, making it the leading end user industry. This dominance is driven by the need to manage growing volumes of transactional and customer data while maintaining compliance with stringent regulatory requirements.
Visual analytics enables financial institutions to detect fraudulent activities, assess risk profiles, and deliver personalized customer services. The sector’s focus on enhancing operational efficiency and improving customer engagement through digital channels has amplified adoption.
Real time visualization of financial data allows institutions to identify emerging trends, optimize resource allocation, and strengthen decision making. The rapid digitalization of banking services combined with the increasing use of big data and advanced analytics has positioned BFSI as the foremost industry driving the expansion of visual analytics solutions.
| Particulars | Details |
|---|---|
| Market Size (2020) | USD 3,479.4 million |
| Market Size (2025) | USD 7,059.8 million |
| Market CAGR (2025 to 2035) | 19.3% |
| Market Growth Rate (2025 to 2025) | 1.19x |
Actionable insights and formulation of strategies under the sales and marketing segment significantly improve, through the deployment of visual analytics. Additionally, various industry verticals integrate the deployment of visual analytics due to a paradigm shift in business approaches. This is expected to increase the demand for visual analytics.
Visual analytics have grown in popularity as a practical method for obtaining information from enormous data sets to avoid difficulties in processing and effectively using big data. This is expected to promote market growth.
Growing demand for Advanced Analytics (AA) is a significant factor expected to expand the market share. Moreover, the global visual analytics industry is likely to experience growth owing to big data and predictive analytics.
The field of logistics and supply chain is predicted to increase investments for information technology to improve data quality, which is anticipated to surge market demands. Utilizing visualization tools like charts, graphs, pivot table widgets, etc. to generate dashboards and reports, therefore driving the adoption of visual analytics.
Businesses are investing and deploying visual analytics to increase productivity, empower employees, and have benefits. Furthermore, visual analytics assist in understanding data in simple terms.
Imperfections in the visual analytics tools produce errors, which is likely to hamper the market growth. Lack of trained personnel to work on advanced business intelligence tools further creates challenges for the market.
Improper design issues leading to confusions in communication are anticipated to obstruct the visual analytics deployment. Data inconsistency causing errors, along with lack of proper governance, are expected to create a challenging environment for the visual analytics environment.
The rising adoption of cloud technology surges the cloud deployment model to be used in visual analytics, which is expected to contribute to the market growth. Furthermore, the IT and telecom segments are expected to accumulate rapid revenue growth to predict future technology requirements and spot underutilized systems and applications.
Organizations in the IT segment further witness a significant adoption of visual analytics, by strategically establishing their goals to enhance the customer experience by streamlining their business processes. Additionally, allowing more fluid deployment of the insights and changes, and strengthening the communication across all levels of the organizations, are generated by visual analytics.
| Countries | Market Share (2025) |
|---|---|
| United States | 14.1% |
| Germany | 8.9% |
| Japan | 5.1% |
| Australia | 3.8% |
North America has a leading visual analytics market share, with a revenue of 22.8% in 2025. This is owing to the booming IT industry in this region and their new innovative strategies.
Robust visual analytics, making data accuracy the central focus, is expected to accelerate the market size. Furthermore, the emergence of cloud, IoT, and big data is further expected to present significant growth in the market in this region.
Additionally, a robust growth of Logistics and Supply Chain management in the region is further expected to drive the market.
With a revenue of 17.2% in 2025, Europe holds the second position in the market. The rising IT infrastructure in various countries of this region is expected to promote global market growth.
Research and development activities to surge technological developments are likely to surge visual analytics deployment in this region. Furthermore, the presence of a large number of companies using business intelligence technology to improve business productivity benefits from visual analytics.
| Countries | Market CAGR (2025 to 2035) |
|---|---|
| China | 23.3% |
| India | 25.4% |
The Asia Pacific market is significantly growing due to the surging demand and challenges from global as well as local markets. Hence, the emergence of key market players is expected to expand the market size.
The implementation of visual analytics is done through rising investments in research and development activities in this region. Likewise, countries like Japan, China, and Singapore are heavily investing in technology, along with the presence of different manufacturing industries, which is anticipated to boost the global market growth.
How is the Start-up Ecosystem in the Visual Analytics Business?
The increasing need for data-driven decision making is accelerating the market in visual analytics. The degree of control over systems and data is a prime advantage of on-premise based solutions, therefore surging the demand for visual analytics.
Start-up companies are recognizing these features to incorporate them with new and exciting trends. Through the advent of technology, and efforts by start-up companies, organizations are able to improve their data-driven decisions. Certain start-up companies are implementing such strategies.

Visual Analytics Service Providers are Focusing on New Softwares for High Profit Margins
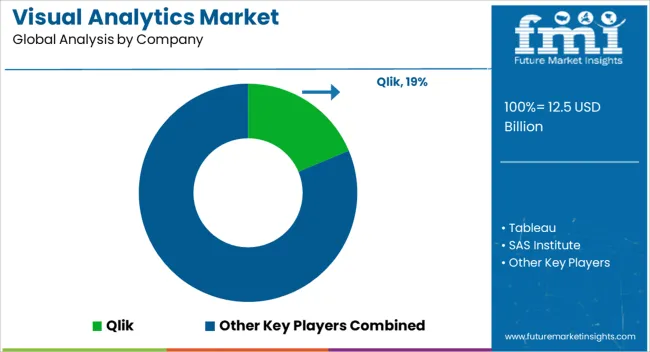
The global visual analytics market size is saturated with large and medium-sized companies that are using ideas and innovations from research and development activities to improve the features of visual analytics.
Moreover, to introduce more effective visual analytics products, market players are adopting various strategies entering into mergers and acquisitions, strategic agreements and contracts, developing and testing.
The global visual analytics market is estimated to be valued at USD 12.5 billion in 2025.
The market size for the visual analytics market is projected to reach USD 80.1 billion by 2035.
The visual analytics market is expected to grow at a 20.4% CAGR between 2025 and 2035.
The key product types in visual analytics market are cloud and on-premises.
In terms of end user, bfsi segment to command 42.3% share in the visual analytics market in 2025.
Explore Similar Insights

Thank you!
You will receive an email from our Business Development Manager. Please be sure to check your SPAM/JUNK folder too.
Chat With
MaRIA