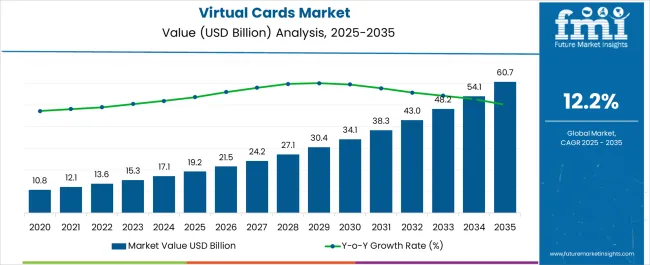
The Virtual Cards Market is estimated to be valued at USD 19.2 billion in 2025 and is projected to reach USD 60.7 billion by 2035, registering a compound annual growth rate (CAGR) of 12.2% over the forecast period.
| Metric | Value |
|---|---|
| Virtual Cards Market Estimated Value in (2025 E) | USD 19.2 billion |
| Virtual Cards Market Forecast Value in (2035 F) | USD 60.7 billion |
| Forecast CAGR (2025 to 2035) | 12.2% |
The virtual cards market is experiencing rapid adoption, driven by the acceleration of digital payment ecosystems, rising concerns over transaction security, and the need for controlled expense management. Increasing integration of virtual card solutions across enterprise resource planning (ERP), e-commerce, and procurement systems has enabled real-time, tokenized payments with enhanced visibility and fraud protection.
Regulatory frameworks promoting digital payments, combined with fintech innovation and consumer demand for frictionless transactions, are supporting the structural shift from physical to virtual card-based mechanisms. The growing prevalence of mobile wallets, contactless interfaces, and API-enabled payment platforms is facilitating the widespread issuance and usage of virtual cards in both B2C and B2B settings.
As data privacy regulations tighten and enterprises emphasize auditability, the virtual card ecosystem is poised to play a critical role in shaping secure, transparent, and automated payment infrastructures globally.
The market is segmented by Product Type and End Use and region. By Product Type, the market is divided into B2C Remote Payment, B2B, and B2C POS. In terms of End Use, the market is classified into Business Use, Consumer Use, and Others. Regionally, the market is classified into North America, Latin America, Western Europe, Eastern Europe, Balkan & Baltic Countries, Russia & Belarus, Central Asia, East Asia, South Asia & Pacific, and the Middle East & Africa.
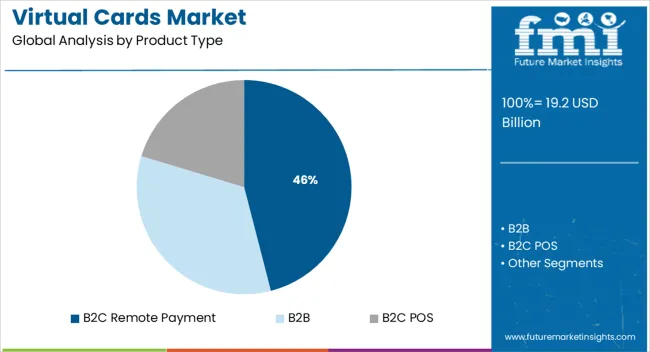
B2C remote payments are projected to account for 46.0% of the total market revenue in the virtual cards sector by 2025, making it the leading product type segment. This segment’s dominance is being driven by increasing consumer demand for secure and fast digital transactions, especially for online shopping, travel bookings, and subscription services.
Virtual cards offer enhanced protection through tokenization and dynamic CVV codes, which help reduce fraud in card-not-present (CNP) environments. Their integration with digital wallets and mobile banking apps has streamlined remote payment experiences, making them preferred over static card alternatives.
The pandemic-induced shift to e-commerce and contactless services further accelerated the adoption of virtual cards in consumer-facing digital channels. As financial institutions expand their virtual card offerings to support instant issuance and spend limits, B2C applications continue to lead adoption across regions with high mobile and internet penetration.
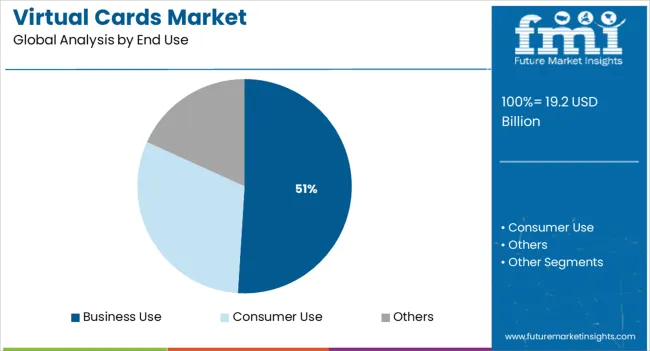
Business use is expected to hold 51.0% of the virtual cards market revenue in 2025, establishing it as the dominant end-use segment. Growth in this segment is being fueled by increasing enterprise demand for streamlined expense management, improved fraud prevention, and enhanced spend visibility.
Virtual cards are being adopted across procurement, supplier payments, travel expense management, and SaaS subscription billing, allowing finance teams to issue single-use or limited-use cards with pre-set spending limits. Their ability to integrate seamlessly with accounting and ERP platforms has strengthened internal financial controls and compliance adherence.
Businesses are also using virtual cards to reduce reliance on manual reimbursement processes and gain real-time insight into employee and departmental expenditures. With heightened focus on automation, cybersecurity, and digital workflows, business use cases are expected to remain the primary driver of virtual card deployments across industries.
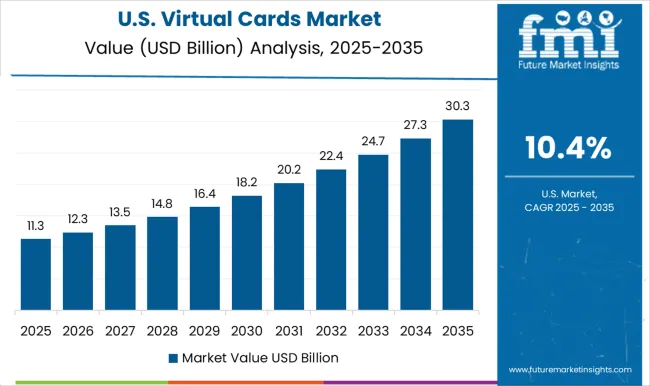
North America currently holds the largest share of the virtual cards market which is attributed to the deployment of advanced technologies such as 5G, increased usage of digital payment systems, and the presence of key companies.
The USA and Canada are the major countries that have a strong presence of key providers which is expected to increase the sales of virtual cards. Additionally, these key players are involved in contributing heavy investments towards research and development activities for digital payment options through prominent specialized payment platforms which can be enabled quickly and used to spend balances wherever Visa is accepted.
The Asia Pacific is a growing virtual cards market owing to the growing adoption of IoT services and increasing government initiatives, especially in the countries China, Japan, and India to encourage digital payments and extensive usage of smartphones.
Moreover, the establishment of a digital payments system is actively sped up through the acceleration of digital transformation from both the governments and industry players for consumer payments in China. In addition, the People’s Bank of China launched a series of digital currency trials across major cities by cooperating with local governments.
Facilities such as canceling and pausing a card at any time, as well as setting spending limits are expected to generate a new set of opportunities for manufacturers to get creative. Furthermore, unlike physical cards, virtual cards cannot be stolen or lost. Key market players are essentially introducing virtual cards as a powerful new solution to address the growing problem of accounts receivable departments.
They claim that the adoption of virtual cards can save time with automatic payment disbursements and reconciliation consolidation, while also reducing personal card reimbursements. These cards further help reduce fraud when the customer leverages modern, digital payments like single-use or reusable card numbers with extensive controls.
Employers can give virtual cards to their employees or other individuals on demand through mobile apps. From virtual AI-powered self-service tools to digital onboarding and implementation, virtual cards can also be used to access more ways to pay with seamless API integrations across a variety of software platforms.
Key virtual card market players are offering a broad range of solutions with these cards to allow end users to efficiently manage procurement and travel expenses with versatile card controls in their accounting systems. They are further offering experienced payment specialists who can help end users design and implement their optimal expense management program. By ditching plastic cards, the emergence of virtual cards has been the result of partnerships between key companies.
Certain key market players have launched a next-generation virtual card solution that uses machine learning and straight-through processing to enable instant payment of supplier invoices. This sophisticated machine learning identifies and analyzes invoices that are most likely to be rejected, enabling the rest to be authorized for payment on the same day they are received. These factors are anticipated to expand the global virtual card market size.
As per the Virtual Cards Market research by Future Market Insights - a market research and competitive intelligence provider, historically, from 2020 to 2024, the market value of the Virtual Cards Market increased at around 21.7% CAGR. With an absolute dollar opportunity of USD 60.7 Billion, the market is projected to reach a valuation of USD 1.3 Trillion by 2035.
In order to improve B2B payments, virtual cards are essential. Business resources can be accessed from everywhere at any time due to their greater flexibility and simplicity. They also provide a dependable and scalable dealer payment system, mainly for international transactions.
Investors should look at the virtual card business since it has significant room for expansion. As a result, several venture capital firms throughout the world are investing in companies that supply reusable and virtual payment cards. As per Digital Commerce 360, a media company, online sales in the USA were almost USD 17.1 Billion in Q3 2024, up 6.8% from Q3 2024.
Privacy.com, the newly rebranded cards issuance platform Lithic, unveiled a USD 43 Mn Series B investment round. Index Ventures, Tusk Venture Partners, Rainfall Ventures, Teamworthy Ventures, and Walkabout Ventures also participated in the round, which was headed by Bessemer Venture Partners.
The Privacy. com-branded Lithic card issuance platform was developed nine months earlier with the goal of making it simple for programmers to mechanically produce virtual and real payment cards.
Ever since, the platform has experienced an exponential increase, with business issuing volumes more than doubling in the previous four months. The flagship product, Privacy.com, continues to become a premier virtual card provider working to make online payments safer and easier and is currently supported by the Lithic card issuance system.
Due to the rising number of electronic transactions, the global virtual cards market is projected to rise significantly throughout the forecast period. A virtual card, sometimes also known as a digital card, is a type of electronic payment system that acts as a token for placing online purchases and making electronic payments.
It enhances the payment experience by allowing for a simpler, smarter, and safer method of making online transactions. Businesses may effectively handle card numbers and balances on every mobile or computer device, regardless of whether they are sending or receiving payments, with virtual cards.
CryptoBucks, a smartphone app designed to allow retailers to securely take crypto payments from any device, was launched by Aliant Payments, a renowned USA supplier of merchant services including payment systems. The debut of CryptoBucks, which is available free on both iOS and Android, sets a new benchmark for ease of use, versatility, and security.
The CryptoBucks software allows retailers to take Bitcoin, Bitcoin Cash, Litecoin, as well as Ethereum (ether) transactions in-store and online while complying with KYC and AML standards. Moreover, CryptoBucks is providing merchants with free crypto processing for the first 90 days, with no monthly charges, no contract, and also no termination, and the ability to cancel at any time.
One of the potential benefits of virtual cards is their ability to provide additional protection. Virtual cards, unlike actual cards, cannot be stolen or lost. The card information is saved and safeguarded online, reducing the amount of personal information that is exposed.
After a transaction, consumers may simply amend or erase their payment details. As a response, virtual cards are becoming a popular payment option for both consumers and organizations looking to conduct safe transactions while improving expenditure visibility and transparency.
Improved 5G connectivity aids digital payment service operators in more efficiently implementing fraud protection measures. As per the GSM Association, by 2025, the 5G network would have covered roughly one-third of the world's population.
Which Region is Projected to Offer the Largest Opportunity for Virtual Cards Market?
Over the estimated period, North America is expected to hold the largest share of the market in the virtual card industry. The virtual cards market in North America is rising significantly due to factors such as increased usage of digital payment systems, the presence of key companies, and the deployment of new technologies such as 5G.
Virtual card companies like JP Morgan Chase, Billtrust, Inc., as well as Stripe, have a strong presence in North America. The presence of such important virtual card providers boosts the demand for the North American virtual card industry.
The Skrill America digital wallet has introduced a virtual view of its current Skrill Visa Prepaid Card, according to Paysafe, a prominent specialized payments platform. Skrill USA's most recent product innovation provides Americans with a digital payment option that can be enabled quickly and used to spend Skrill balances online wherever Visa is accepted.
The Skrill Virtual Visa Prepaid Card, which is offered by the New York-based Community Federal Savings Account, allows Skrill USA clients to purchase online practically anywhere because the majority of USA and worldwide eCommerce sites accept Visa card payments.
The new virtual Skrill Visa Prepaid Card, which was released in January 2024 as a replacement to the real CFSB-issued Skrill Visa Card, has a shortened application procedure and may be enabled in their accounts in seconds.
According to the ACI Worldwide analysis, digital payments will account for 71.7% of total transaction volume in India by 2025, while cash and cheques will account for 28.3%. As a result, as the number of digital payments grows, so does the need for virtual cards.
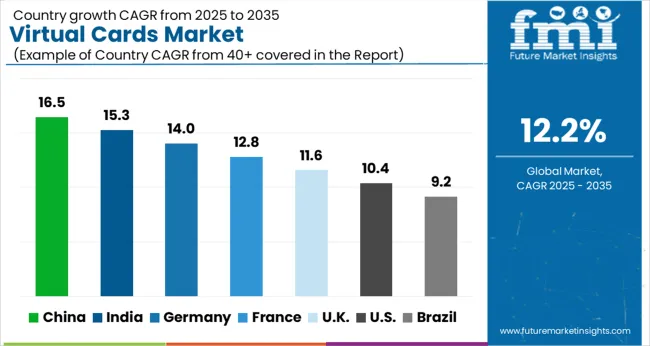
By the end of 2035, the USA is projected to account for the largest market share of USD 462.4 Billion. The key drivers of development are technological improvements and a rise in the number of consumers opting for virtual payment operations. European banks are working to develop a European payments initiative that would provide a uniform payment option for retailers and customers throughout the country.
Extend, the New York City-based leader in fintech that specializes in virtual cards, and American Express established a partnership to develop virtual Card services for USA businesses. Companies in the USA with a valid American Express Business Card may enroll and produce virtual cards, also known as tokens, using Extend's app or desktop login.
Several organizations may benefit from virtual cards, which can assist with anything from finding a dependable and upgraded approach to regulating spending to automating payment operations and obtaining richer data. Since the beginning of the epidemic, more businesses have been using virtual cards to automate their payment operations and enhance their use of contactless payments.
Which Virtual Cards Segment is Projected to Witness Fastest Growth among Virtual Cards Type?
THE B2B Virtual Cards segment is forecasted to grow at the highest CAGR of over 12.1% from 2025 to 2035. Virtual cards are frequently used as Single-Use Accounts for B2B payments. These are one-time-use, automated credit card numbers that Account Payments sends to suppliers and buyers for payment purposes.
As a result, the number is only valid for those transactions in a defined quantity. By integrating cards with a business cost management solution, the user can get the most out of using cards for Business - to - business payments. Meshpayments.com, for example, streamlines the usage of cards by connecting spending procedures.
The Consumer Use segment is forecasted to grow at the highest CAGR of over 11.8% from 2025 to 2035. Mastercard and Previse officially confirmed the inclusion of Mastercard Cross-Border Offerings into Previse's InstantPay channel.
Mastercard Cross-Border Solutions is a global push payments technology that lets funds be sent seamlessly, and securely. As a result of the agreement, immediate payments to providers in over 100+ markets around the world.
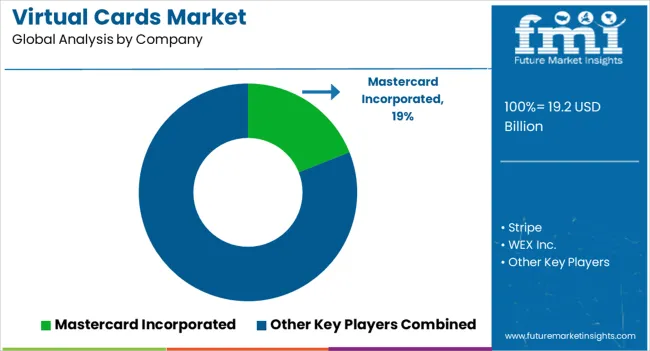
The leading players in the global Virtual Cards market are BTRS Holdings, Inc.; Fraedom Holdings Limited; JPMorgan Chase & Co.; Marqeta, Inc.; Mastercard; and Skrill USA, Inc.
Similarly, recent developments related to companies in Virtual Cards services have been tracked by the team at Future Market Insights, which are available in the full report.
The global virtual cards market is estimated to be valued at USD 19.2 billion in 2025.
The market size for the virtual cards market is projected to reach USD 60.7 billion by 2035.
The virtual cards market is expected to grow at a 12.2% CAGR between 2025 and 2035.
The key product types in virtual cards market are b2c remote payment, b2b and b2c pos.
In terms of end use, business use segment to command 51.0% share in the virtual cards market in 2025.


Our Research Products

The "Full Research Suite" delivers actionable market intel, deep dives on markets or technologies, so clients act faster, cut risk, and unlock growth.

The Leaderboard benchmarks and ranks top vendors, classifying them as Established Leaders, Leading Challengers, or Disruptors & Challengers.

Locates where complements amplify value and substitutes erode it, forecasting net impact by horizon

We deliver granular, decision-grade intel: market sizing, 5-year forecasts, pricing, adoption, usage, revenue, and operational KPIs—plus competitor tracking, regulation, and value chains—across 60 countries broadly.

Spot the shifts before they hit your P&L. We track inflection points, adoption curves, pricing moves, and ecosystem plays to show where demand is heading, why it is changing, and what to do next across high-growth markets and disruptive tech

Real-time reads of user behavior. We track shifting priorities, perceptions of today’s and next-gen services, and provider experience, then pace how fast tech moves from trial to adoption, blending buyer, consumer, and channel inputs with social signals (#WhySwitch, #UX).

Partner with our analyst team to build a custom report designed around your business priorities. From analysing market trends to assessing competitors or crafting bespoke datasets, we tailor insights to your needs.
Supplier Intelligence
Discovery & Profiling
Capacity & Footprint
Performance & Risk
Compliance & Governance
Commercial Readiness
Who Supplies Whom
Scorecards & Shortlists
Playbooks & Docs
Category Intelligence
Definition & Scope
Demand & Use Cases
Cost Drivers
Market Structure
Supply Chain Map
Trade & Policy
Operating Norms
Deliverables
Buyer Intelligence
Account Basics
Spend & Scope
Procurement Model
Vendor Requirements
Terms & Policies
Entry Strategy
Pain Points & Triggers
Outputs
Pricing Analysis
Benchmarks
Trends
Should-Cost
Indexation
Landed Cost
Commercial Terms
Deliverables
Brand Analysis
Positioning & Value Prop
Share & Presence
Customer Evidence
Go-to-Market
Digital & Reputation
Compliance & Trust
KPIs & Gaps
Outputs
Full Research Suite comprises of:
Market outlook & trends analysis
Interviews & case studies
Strategic recommendations
Vendor profiles & capabilities analysis
5-year forecasts
8 regions and 60+ country-level data splits
Market segment data splits
12 months of continuous data updates
DELIVERED AS:
PDF EXCEL ONLINE
Virtual Land NFT Market Size and Share Forecast Outlook 2025 to 2035
Virtual Pipeline Market Size and Share Forecast Outlook 2025 to 2035
Virtual Customer Premises Equipment Market Size and Share Forecast Outlook 2025 to 2035
Virtual Infrastructure Manager Market Size and Share Forecast Outlook 2025 to 2035
Virtual Companion Care Market Size and Share Forecast Outlook 2025 to 2035
Virtualized Radio Access Network Market Size and Share Forecast Outlook 2025 to 2035
Virtual Workspace Solutions Market Size and Share Forecast Outlook 2025 to 2035
Virtual Prototype Market Size and Share Forecast Outlook 2025 to 2035
Virtual Assistant Services Market Size and Share Forecast Outlook 2025 to 2035
Virtual Power Plant (VPP) and V2G Orchestration Market Analysis - Size, Share, and Forecast Outlook 2025 to 2035
Virtual Power Plant Market Size and Share Forecast Outlook 2025 to 2035
Virtual Machines Market by Type, by Enterprise Size, by Industry & Region Forecast till 2035
Virtual Extensible LAN (VXLAN) Market Size and Share Forecast Outlook 2025 to 2035
Virtual Private Cloud Market Size and Share Forecast Outlook 2025 to 2035
Virtual PLC and Soft PLC Market Size and Share Forecast Outlook 2025 to 2035
Virtual Private Network VPN Market Size and Share Forecast Outlook 2025 to 2035
Virtualized Evolved Packet Core (vEPC) Market Size and Share Forecast Outlook 2025 to 2035
Virtual Try-On Platform Market Analysis Size and Share Forecast Outlook 2025 to 2035
Virtual Private Server Market Size and Share Forecast Outlook 2025 to 2035
Virtual Client Computing Market Size and Share Forecast Outlook 2025 to 2035

Thank you!
You will receive an email from our Business Development Manager. Please be sure to check your SPAM/JUNK folder too.
Chat With
MaRIA