The Veterinary Orthopedic Drills Market is estimated to be valued at USD 30.6 billion in 2025 and is projected to reach USD 42.0 billion by 2035, registering a compound annual growth rate (CAGR) of 3.2% over the forecast period.
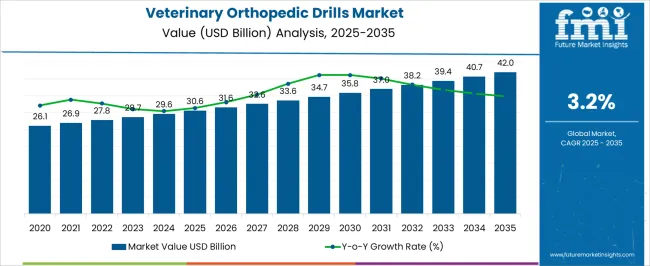
| Metric | Value |
|---|---|
| Veterinary Orthopedic Drills Market Estimated Value in (2025 E) | USD 30.6 billion |
| Veterinary Orthopedic Drills Market Forecast Value in (2035 F) | USD 42.0 billion |
| Forecast CAGR (2025 to 2035) | 3.2% |
The Veterinary Orthopedic Drills market is experiencing steady growth, driven by the increasing demand for advanced surgical solutions in veterinary medicine. Rising incidences of bone fractures, orthopedic disorders, and trauma cases in companion and farm animals are creating the need for precise and reliable surgical equipment. Adoption is being further supported by technological advancements in drill design, including ergonomic features, improved torque control, and enhanced safety mechanisms, which enable more efficient and accurate surgical procedures.
Veterinary practitioners are increasingly integrating high-performance orthopedic drills into clinical workflows to improve patient outcomes and reduce procedural time. Growth is also being fueled by the expansion of veterinary healthcare infrastructure, the increasing number of veterinary hospitals and clinics, and rising awareness of animal welfare standards.
Training programs, regulatory compliance, and certification of equipment quality are enhancing confidence in using specialized surgical tools As animal healthcare spending rises and veterinary surgical procedures become more sophisticated, the market is expected to continue its upward trajectory, supported by innovation, reliability, and operational efficiency.
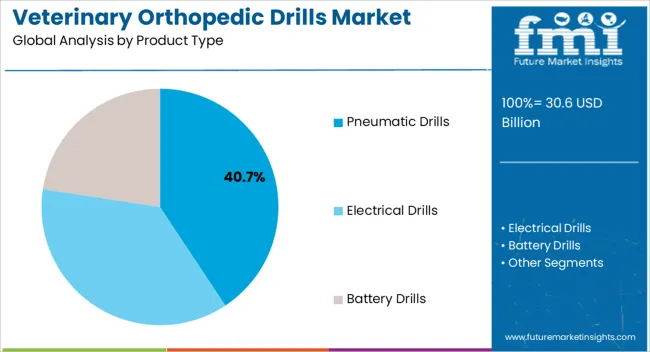
The pneumatic drills product type segment is projected to hold 40.7% of the market revenue in 2025, establishing it as the leading product type. Growth in this segment is being driven by the high precision, consistent torque output, and reliability offered by pneumatic-powered systems, which are particularly suitable for complex orthopedic procedures in veterinary practice. Pneumatic drills provide superior speed control and reduce operational fatigue for surgeons, enhancing procedural efficiency and accuracy.
The lightweight and ergonomic design facilitates handling during long surgical procedures, while air-driven operation ensures lower maintenance and longer tool lifespan. Adoption is further supported by the ability of pneumatic drills to accommodate various drill bits and attachments, providing versatility across multiple surgical applications.
As veterinary hospitals continue to prioritize advanced surgical interventions and optimal patient care, pneumatic drills are expected to maintain their leading market position Their proven performance, durability, and adaptability make them the preferred choice among veterinary surgeons for orthopedic interventions, reinforcing segment growth over the forecast period.
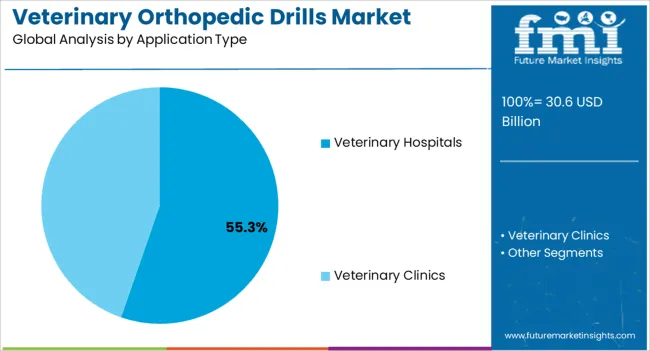
The veterinary hospitals application type segment is anticipated to account for 55.3% of the market revenue in 2025, making it the leading application area. Growth is being driven by the increasing number of specialized veterinary hospitals and clinics providing advanced orthopedic care for companion and farm animals. These facilities require high-performance surgical equipment, including orthopedic drills, to ensure precise procedures, improve patient recovery rates, and enhance overall clinical outcomes.
Adoption is further supported by the growing focus on modern veterinary practices, advanced surgical training programs, and stringent animal welfare standards, which demand reliable and safe surgical instruments. Hospitals benefit from pneumatic drills’ efficiency, versatility, and low maintenance requirements, allowing for multiple procedures without compromising performance.
Investments in hospital infrastructure, expansion of orthopedic surgical services, and the rising prevalence of animal orthopedic conditions continue to strengthen demand As veterinary hospitals increasingly adopt technology-driven solutions to meet clinical demands and regulatory requirements, this application segment is expected to remain the primary driver of market growth, supported by innovation and operational efficiency.
The rising prevalence of bone reconstruction in animals is the prominent key factor that rises the veterinary orthopedic drills industry growth. Due to rising prevalence, there is slow growth found by manufacturing companies in the veterinary orthopedic drills sector during the forecast period. Traditional drill methods are key leads to osteonecrosis due to uncontrolled temperatures, which have been replaced by electric veterinary drills in recent years.
The need for veterinary orthopedic drills is growing since drilling is necessary for the rigid fixation of bone and implants with screws and threaded devices. Along with increasing demand, the market is expanding due to better compliance and reduced bone injury.
Some of the Restraints in the Market Are:
The adoption of veterinary orthopedic drills is rising, as they are most helpful in bone reconstruction surgeries to treat injured bones. Veterinary orthopedic drill bits normally range from 0.5mm to several millimeters.
The sales of veterinary orthopedic drills are rising as they consist of the shaft, flutes, chisel edge and cutting edge advantages, which take lesser time for the surgery. Chisel edges mainly contribute to axial thrust force and little cutting, which is likely to grow the veterinary orthopedic drills sector growth during the forecast period.
Veterinary orthopedic drills are classified into three types: pneumatic, battery, and electrical. Battery veterinary drills are more costly but are more advanced than other types, which are anticipated to rise the veterinary orthopedic drills market share in recent years. However, pneumatic and electrical veterinary drills require compressed gas and external electric power that are cheaper as compared to veterinary battery drills. Due to low cost, the end-use industry is rising in demand for pneumatic and electrical veterinary drills during the forecast period.
The ease of usage without a wire or hose is the main advantage of battery-powered veterinary orthopedic drills. The numbers for these drills are likely to rise in the future years.
Automation and miniaturization of electronic gadgets coupled with their application in medical automation devices have gained traction through higher bandwidths and high-speed internet has increased the sales of Veterinary Orthopedic Drills.
As LED replaces less energy-efficient bulbs, the demand for Veterinary Orthopedic Drills has grown. These LEDs are expected to generate high-lumen outputs while consuming less energy and being more energy resistant. This contradictory condition gets satisfied with the use of Veterinary Orthopedic Drills in LEDs as it creates more illumination with lower heat consumption. It also saves the end user from choosing the old kind of lighting while providing them the better capacity, lower cost, and space.
The use of TIMs is prevalent in smartphone manufacturing that has penetrated each and every market space, lastly increasing the sales of Veterinary Orthopedic Drills
The advent of microprocessor chips that carry multiple power densities, lower device dimensions, and poor thermal management is fueling the sales of Veterinary Orthopedic Drills.
Thermal management systems within the systems help in creating an interface that deals with thermal resistance while increasing the productivity and efficiency of the device. This happens through the application of all modes of these systems. The high cost of these materials and the thermal resistance walk side by side as the higher cost helps the system gain better resistance.
The factors such as thermal conductivity, phase change, viscosity, pressure, outgassing, surface finish, ease of application, and mechanical properties of the material affect the cost of TIMs, affecting the cost of this equipment.
The veterinary orthopedic drills sector is segmented into different types, such as pneumatic veterinary, electrical veterinary and battery veterinary drills. Battery veterinary drills dominated the market with a share of 47.5% in 2025.
Battery veterinary drills are widely used, as they have advanced features that change the direction of a drill with a little pressure on the finger. This has led to increased sales of battery veterinary drills in recent years.
The busiest places are hospitals, which also manage orthopedic procedures and operations better. This sector is a top pick for pet parents as it has the setup required for diagnostic tests and post-surgical procedures, which held the market share of 73.2% in 2025.
Ambulatory care facilities and veterinary research facilities are included in the other sector. The projected period is expected to have a high growth rate, which is attributable to rising research and development expenditures and funding for the creation of therapeutically enhanced surgical procedures and implants.
| Countries | Market Share (2025) |
|---|---|
| United States | 31.3% |
| Germany | 6.5% |
| Japan | 5.6% |
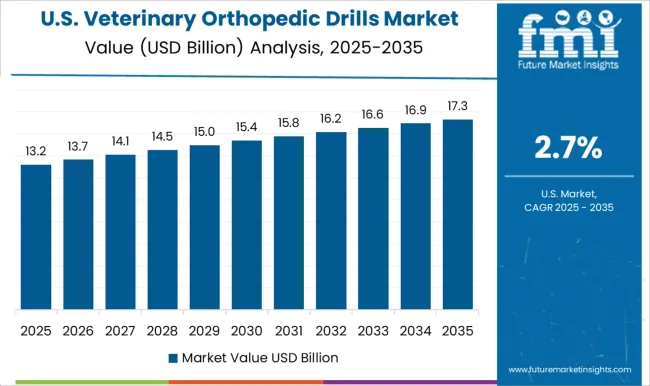
The global veterinary orthopedic drills industry size is segmented into regions including North America, Latin America, Europe, Asia-Pacific and the Middle East and Africa. North America is dominant in the global veterinary orthopedic drills market share, mainly due to its increasing prevalence in the region.
The North American region acquired 34.2% of the share in the market in 2025. However, the United States is dominating due to rising awareness of veterinary orthopedic disorders in the region.
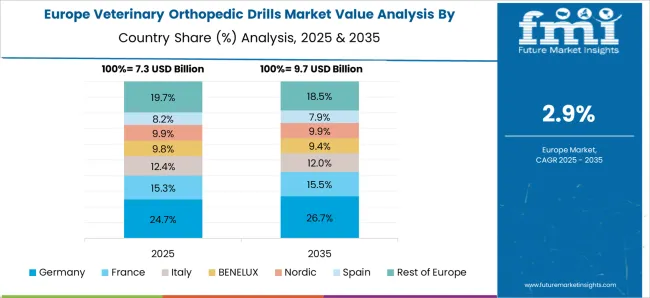
Europe is likely to hold the second position in growth by acquiring 31.1% of the share in 2025.
Rising pet owners, advanced technology, and rising government initiatives policies are fueling the veterinary orthopedic drills sector opportunities in the region during the forecast period. Increasing numbers of animal care clinics and hospitals are also one of the leading factors that upsurge the sales of veterinary orthopedic drills.
The veterinary orthopedic drills start-up market is concentrating on and innovating high-quality implant solutions for animals. The companies are collaborating to gear up the maximum growth and provide new innovative products related to veterinary orthopedic drills.
They are also probably to use customer support services to advertise their high-tech goods. One of the American start-up businesses, Modern Animal, offers 24/7 skilled virtual care for your pet. They offer flexible, high-quality pet care that is unique and in line with current market trends for veterinary orthopedic drills.
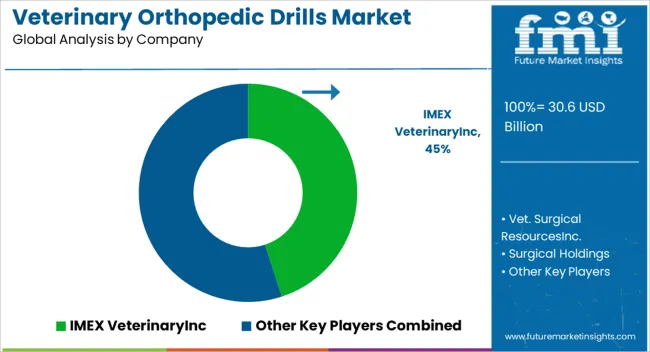
The market is fragmented by prominent players, including key manufacturing leaders all around the regions, during the forecast period. These concentrate on the consumer's demand and raise the production as per their need.
The key players in the veterinary orthopedic drills sector are mainly focused on expansion through collaborations, mergers, product launches and partnerships with local vendors. This leads to an increase in the market reach of the products during the forecast period.
Recent Developments:
The global veterinary orthopedic drills market is estimated to be valued at USD 30.6 billion in 2025.
The market size for the veterinary orthopedic drills market is projected to reach USD 42.0 billion by 2035.
The veterinary orthopedic drills market is expected to grow at a 3.2% CAGR between 2025 and 2035.
The key product types in veterinary orthopedic drills market are pneumatic drills, electrical drills and battery drills.
In terms of application type, veterinary hospitals segment to command 55.3% share in the veterinary orthopedic drills market in 2025.


Full Research Suite comprises of:
Market outlook & trends analysis
Interviews & case studies
Strategic recommendations
Vendor profiles & capabilities analysis
5-year forecasts
8 regions and 60+ country-level data splits
Market segment data splits
12 months of continuous data updates
DELIVERED AS:
PDF EXCEL ONLINE
Veterinary Allergy Diagnostics Market Size and Share Forecast Outlook 2025 to 2035
Veterinary TSE Testing Market Size and Share Forecast Outlook 2025 to 2035
Veterinary Dermatology Market Forecast Outlook 2025 to 2035
Veterinary Telemedicine Market Size and Share Forecast Outlook 2025 to 2035
Veterinary Dietary Supplements Market Size and Share Forecast Outlook 2025 to 2035
Veterinary Imaging Market Forecast and Outlook 2025 to 2035
Veterinary CRISPR-Based Detection Kits Market Size and Share Forecast Outlook 2025 to 2035
Veterinary Pregnancy Test Kit Market Forecast and Outlook 2025 to 2035
Veterinary X-Ray Illuminators Market Size and Share Forecast Outlook 2025 to 2035
Veterinary Scales Market Size and Share Forecast Outlook 2025 to 2035
Veterinary Grooming Aids Market Size and Share Forecast Outlook 2025 to 2035
Veterinary Micro-fibre Endoscope Market Size and Share Forecast Outlook 2025 to 2035
Veterinary Faecal Filters Market Size and Share Forecast Outlook 2025 to 2035
Veterinary Dental Equipment Market Size and Share Forecast Outlook 2025 to 2035
Veterinary Rapid Test Market Size and Share Forecast Outlook 2025 to 2035
Veterinary Therapeutic Diet Market Size and Share Forecast Outlook 2025 to 2035
Veterinary Glucometers Market Size and Share Forecast Outlook 2025 to 2035
Veterinary Pain Management Drugs Market Size and Share Forecast Outlook 2025 to 2035
Veterinary Anesthesia Machines Market Size and Share Forecast Outlook 2025 to 2035
Veterinary Thermography Market Size and Share Forecast Outlook 2025 to 2035

Thank you!
You will receive an email from our Business Development Manager. Please be sure to check your SPAM/JUNK folder too.
Chat With
MaRIA