As of 2023, the global veterinary electrosurgery market stands at a valuation of US$ 520.32 million. Projections indicate a sustained upward trajectory, with an anticipated average CAGR of 6.7% from 2023 to 2033. This trajectory is positioned to drive the market past the US$ 995.2 million mark by 2033.
Key Highlights
Attributes | Details |
---|---|
Veterinary Electrosurgery Market Size (2023) | US$ 520.32 million |
Veterinary Electrosurgery Market Projected Size (2033) | US$ 995.2 million |
Veterinary Electrosurgery Market Forecasted Value CAGR (2023 to 2033) | 6.7% |
Don't pay for what you don't need
Customize your report by selecting specific countries or regions and save 30%!
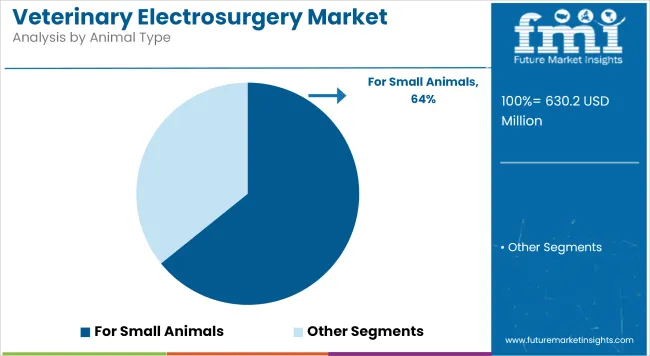
Rising Pet Ownership Spurs Surge in Demand for Veterinary Services: The demand for veterinary services has increased as pet ownership becomes more widespread. About 370 million pet cats and about 470 million dogs are kept as pets worldwide. The growth in pets is anticipated to raise demand for veterinary vaccines. The rise in demand is also likely to lead to an increase in related sectors, including the veterinary electrosurgery equipment market. This interconnected growth trend emphasizes the significance of the veterinary electrosurgery market in the broader landscape of pet healthcare.
Rising Pet Health Concerns Propel Demand for Advanced Animal Surgery Tools: Another significant reason boosting the demand for animal surgery instruments is the rising risk of obesity, cardiovascular disorders, neurological diseases, osteoarthritis, and dental problems in pet animals. Growing consumer knowledge of animal treatment choices is anticipated to support the veterinary electrosurgery market. Veterinary electrocautery devices are becoming more popular nowadays as veterinarians prefer electrosurgery for its ability to minimize damage, suffering, and recuperation time in animals.
Veterinary Advancements Cater to Growing Population of Senior Pets: Dog-owning families with an older dog (7 years or older) climbed from 41.6% in 2012 to 53.5% in 2022. Given improvements in veterinary treatment, a more significant proportion of animals are becoming senior pets. Advancements in veterinary electrosurgical tools are essential in meeting these animals' particular demands since they frequently require specialist surgical treatment. Based on a World Health Organization estimation, over 2.0 million surgical procedures are performed on older animals annually to prevent illness.
Electrosurgery Emerges as the Go-to for Veterinary Procedures: Veterinarians demand cutting-edge veterinary surgical equipment like veterinary electrosurgical generators to perform surgeries more quickly and effectively, with less bleeding, precise tissue cutting, and enhanced vision. Preference for electrosurgery is growing among veterinarians as it offers several advantages over traditional surgical methods, including reduced bleeding, precise tissue cutting, enhanced visibility during surgery, faster surgery times, and less inflammation for patients.
Government Initiatives Drive Growth in Veterinary Electrosurgery Market: Government-led programs targeted at reducing and preventing illness in animal populations foster an atmosphere favorable for expanding the animal surgical instrument market. Governments all over the world acknowledge the necessity of preserving the health and welfare of animal populations. Incorporating cutting-edge surgical technologies like animal electrosurgery becomes crucial as government programs concentrate on lowering illness prevalence among animals.
Between 2017 and 2022, the veterinary electrosurgery market experienced significant growth, climbing from US$ 384.7 million to US$ 493.2 million, showcasing an average 5.1% CAGR.
Veterinary Electrosurgery Market Size (2017) | US$ 384.7 million |
---|---|
Veterinary Electrosurgery Market Size (2022) | US$ 493.2 million |
Historical Value CAGR (2017 to 2022) | 5.1% |
Projections suggest a healthier pace of growth, with the veterinary electrosurgery market size anticipated to rise from US$ 520.32 million in 2023 to US$ 995.2 million by 2033, reflecting a modest 6.7% CAGR. Emerging Asia Pacific and Latin American countries are anticipated to present considerable potential prospects for the participants in the veterinary electrosurgery market.
The increasing demand for more efficient, accurate, and user-friendly tools drives the adoption of advanced electrosurgical devices in veterinary practice. This surge in demand stems from the imperative for veterinary surgeons to conduct procedures with heightened swiftness and precision. For instance, Onemytis 2, a novel electrosurgical device, became available in the United Kingdom in July 2020. This new device marks a significant transition from analog to digital.
Trends |
|
---|---|
Opportunities |
|
In 2023, North America reins in the global veterinary electrosurgery market, claiming an impressive 35.1% share. This signifies a significant foothold in the industry. Meanwhile, Europe is just a little behind, holding a substantial 29% share. This solidifies Europe's notable presence in the market. Both regions are contributing substantially to the veterinary electrosurgery industry's growth and development.
Countries | 2023 Value Share in the Global Market |
---|---|
United States | 32% |
Germany | 5.3% |
Japan | 5.0% |
The United States dominates the global market as of 2023 since the number of people in the United States who keep pets has increased dramatically over the last decade.
The surge in pet ownership, particularly dogs, in Germany is the top factor that has significantly influenced the field of veterinary electrosurgical units.
Japan needs to follow the trends in the veterinary electrosurgery market of Asia Pacific. Between 2018 and 2022, the number of cats and dogs in Japan declined by more than 1.5%.
Countries | Value CAGR between 2023 and 2033 |
---|---|
United Kingdom | 3.7% |
India | 6.3% |
China | 8.5% |
The United Kingdom's expanding private ownership of pets is an important variable in the market's expansion.
Rising middle-class prosperity in countries like China and India and their expanding population are driving the demand for veterinary services, notably electrosurgery equipment.
Get the data you need at a Fraction of the cost
Personalize your report by choosing insights you need
and save 40%!
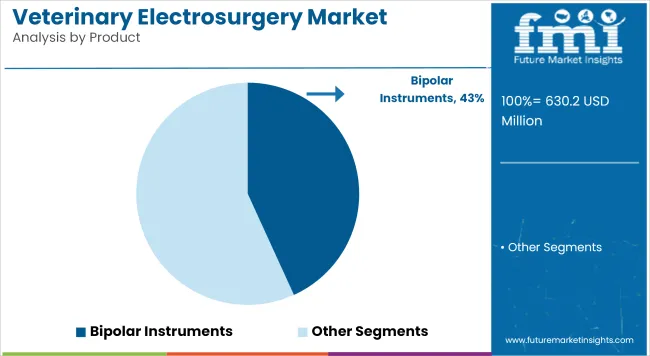
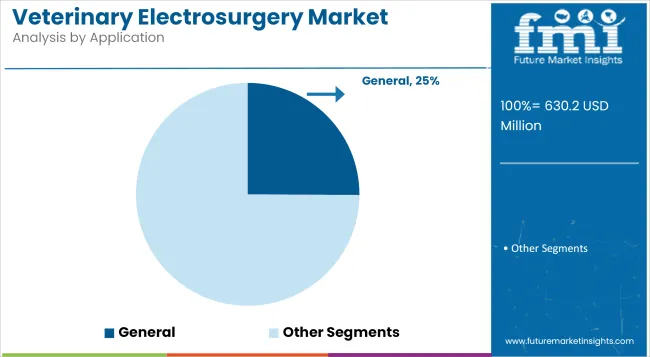
Based on product type, the bipolar veterinary electrosurgery instruments segment dominates the global market in 2023, accounting for a 42.7% share. The general veterinary electrosurgery segment takes the lead when considering the application, commanding an impressive 44.0% market share in 2023.
Segment | 2023 Value Share in the Global Market |
---|---|
Bipolar Veterinary Electrosurgery Instruments | 42.7% |
General Veterinary Electrosurgery | 44.0% |
Given the lower risk of patient burns compared to monopolar electrosurgery, the growing popularity of pet animals, and the strong sales of bipolar surgical tools, the bipolar electrosurgery instrument category has a significant market share.
The rise in the application of general veterinary electrosurgery indicates a notable expansion in its usage within the veterinary field.
In the dynamic veterinary electrosurgery market, a mix of prominent and niche players coexist. Industry leaders employ diverse tactics like expanding product portfolios, venturing into new markets, forming strategic alliances, and introducing innovative offerings. These strategies are crucial in securing a competitive edge and market dominance.
Recent Developments in the Veterinary Electrosurgery Market
The bipolar instruments segment held a substantial market share in veterinary electrosurgery in 2022.
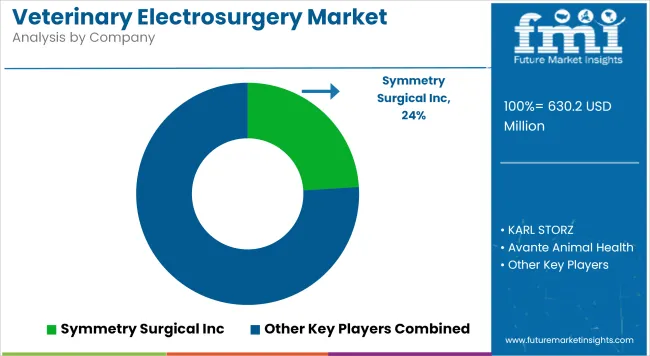
Prominent players in the market include Symmetry Surgical Inc., KARL STORZ, and others.
The market is driven by rising pet adoption and a growing focus on pet healthcare.
The global veterinary electrosurgery market is valued at US$ 520.32 million in 2023.
The market is likely to develop at a CAGR of around 6.7% through 2033.
1. Executive Summary
1.1. Global Market Outlook
1.2. Demand-side Trends
1.3. Supply-side Trends
1.4. Technology Roadmap Analysis
1.5. Analysis and Recommendations
2. Market Overview
2.1. Market Coverage / Taxonomy
2.2. Market Definition / Scope / Limitations
3. Market Background
3.1. Market Dynamics
3.1.1. Drivers
3.1.2. Restraints
3.1.3. Opportunity
3.1.4. Trends
3.2. Scenario Forecast
3.2.1. Demand in Optimistic Scenario
3.2.2. Demand in Likely Scenario
3.2.3. Demand in Conservative Scenario
3.3. Opportunity Map Analysis
3.4. Product Life Cycle Analysis
3.5. Supply Chain Analysis
3.5.1. Supply Side Participants and their Roles
3.5.1.1. Producers
3.5.1.2. Mid-Level Participants (Traders/ Agents/ Brokers)
3.5.1.3. Wholesalers and Distributors
3.5.2. Value Added and Value Created at Node in the Supply Chain
3.5.3. List of Raw Material Suppliers
3.5.4. List of Existing and Potential Buyer’s
3.6. Investment Feasibility Matrix
3.7. Value Chain Analysis
3.7.1. Profit Margin Analysis
3.7.2. Wholesalers and Distributors
3.7.3. Retailers
3.8. PESTLE and Porter’s Analysis
3.9. Regulatory Landscape
3.9.1. By Key Regions
3.9.2. By Key Countries
3.10. Regional Parent Market Outlook
3.11. Production and Consumption Statistics
3.12. Import and Export Statistics
4. Global Market Analysis 2018 to 2022 and Forecast, 2023 to 2033
4.1. Historical Market Size Value (US$ Million) & Volume (Units) Analysis, 2018 to 2022
4.2. Current and Future Market Size Value (US$ Million) & Volume (Units) Projections, 2023 to 2033
4.2.1. Y-o-Y Growth Trend Analysis
4.2.2. Absolute $ Opportunity Analysis
5. Global Market Analysis 2018 to 2022 and Forecast 2023 to 2033, By Product
5.1. Introduction / Key Findings
5.2. Historical Market Size Value (US$ Million) & Volume (Units) Analysis By Product, 2018 to 2022
5.3. Current and Future Market Size Value (US$ Million) & Volume (Units) Analysis and Forecast By Product, 2023 to 2033
5.3.1. Bipolar Instruments
5.3.2. Monopolar Instruments
5.3.3. Consumables & Accessories
5.4. Y-o-Y Growth Trend Analysis By Product, 2018 to 2022
5.5. Absolute $ Opportunity Analysis By Product, 2023 to 2033
6. Global Market Analysis 2018 to 2022 and Forecast 2023 to 2033, By Animal Type
6.1. Introduction / Key Findings
6.2. Historical Market Size Value (US$ Million) & Volume (Units) Analysis By Animal Type, 2018 to 2022
6.3. Current and Future Market Size Value (US$ Million) & Volume (Units) Analysis and Forecast By Animal Type, 2023 to 2033
6.3.1. for Small Animals
6.3.2. for Large Animals
6.4. Y-o-Y Growth Trend Analysis By Animal Type, 2018 to 2022
6.5. Absolute $ Opportunity Analysis By Animal Type, 2023 to 2033
7. Global Market Analysis 2018 to 2022 and Forecast 2023 to 2033, By Application
7.1. Introduction / Key Findings
7.2. Historical Market Size Value (US$ Million) & Volume (Units) Analysis By Application, 2018 to 2022
7.3. Current and Future Market Size Value (US$ Million) & Volume (Units) Analysis and Forecast By Application, 2023 to 2033
7.3.1. General Veterinary Electrosurgery
7.3.2. Dental Veterinary Electrosurgery
7.3.3. Gynecological & Urological Veterinary Electrosurgery
7.3.4. Orthopedic Veterinary Electrosurgery
7.3.5. Other Applications
7.4. Y-o-Y Growth Trend Analysis By Application, 2018 to 2022
7.5. Absolute $ Opportunity Analysis By Application, 2023 to 2033
8. Global Market Analysis 2018 to 2022 and Forecast 2023 to 2033, By End Use
8.1. Introduction / Key Findings
8.2. Historical Market Size Value (US$ Million) & Volume (Units) Analysis By End Use, 2018 to 2022
8.3. Current and Future Market Size Value (US$ Million) & Volume (Units) Analysis and Forecast By End Use, 2023 to 2033
8.3.1. across Veterinary Hospitals And Clinics
8.3.2. across Other End Users
8.4. Y-o-Y Growth Trend Analysis By End Use, 2018 to 2022
8.5. Absolute $ Opportunity Analysis By End Use, 2023 to 2033
9. Global Market Analysis 2018 to 2022 and Forecast 2023 to 2033, By Region
9.1. Introduction
9.2. Historical Market Size Value (US$ Million) & Volume (Units) Analysis By Region, 2018 to 2022
9.3. Current Market Size Value (US$ Million) & Volume (Units) Analysis and Forecast By Region, 2023 to 2033
9.3.1. North America
9.3.2. Latin America
9.3.3. Western Europe
9.3.4. Eastern Europe
9.3.5. South Asia and Pacific
9.3.6. East Asia
9.3.7. Middle East and Africa
9.4. Market Attractiveness Analysis By Region
10. North America Market Analysis 2018 to 2022 and Forecast 2023 to 2033, By Country
10.1. Historical Market Size Value (US$ Million) & Volume (Units) Trend Analysis By Market Taxonomy, 2018 to 2022
10.2. Market Size Value (US$ Million) & Volume (Units) Forecast By Market Taxonomy, 2023 to 2033
10.2.1. By Country
10.2.1.1. USA
10.2.1.2. Canada
10.2.2. By Product
10.2.3. By Animal Type
10.2.4. By Application
10.2.5. By End Use
10.3. Market Attractiveness Analysis
10.3.1. By Country
10.3.2. By Product
10.3.3. By Animal Type
10.3.4. By Application
10.3.5. By End Use
10.4. Key Takeaways
11. Latin America Market Analysis 2018 to 2022 and Forecast 2023 to 2033, By Country
11.1. Historical Market Size Value (US$ Million) & Volume (Units) Trend Analysis By Market Taxonomy, 2018 to 2022
11.2. Market Size Value (US$ Million) & Volume (Units) Forecast By Market Taxonomy, 2023 to 2033
11.2.1. By Country
11.2.1.1. Brazil
11.2.1.2. Mexico
11.2.1.3. Rest of Latin America
11.2.2. By Product
11.2.3. By Animal Type
11.2.4. By Application
11.2.5. By End Use
11.3. Market Attractiveness Analysis
11.3.1. By Country
11.3.2. By Product
11.3.3. By Animal Type
11.3.4. By Application
11.3.5. By End Use
11.4. Key Takeaways
12. Western Europe Market Analysis 2018 to 2022 and Forecast 2023 to 2033, By Country
12.1. Historical Market Size Value (US$ Million) & Volume (Units) Trend Analysis By Market Taxonomy, 2018 to 2022
12.2. Market Size Value (US$ Million) & Volume (Units) Forecast By Market Taxonomy, 2023 to 2033
12.2.1. By Country
12.2.1.1. Germany
12.2.1.2. UK
12.2.1.3. France
12.2.1.4. Spain
12.2.1.5. Italy
12.2.1.6. Rest of Western Europe
12.2.2. By Product
12.2.3. By Animal Type
12.2.4. By Application
12.2.5. By End Use
12.3. Market Attractiveness Analysis
12.3.1. By Country
12.3.2. By Product
12.3.3. By Animal Type
12.3.4. By Application
12.3.5. By End Use
12.4. Key Takeaways
13. Eastern Europe Market Analysis 2018 to 2022 and Forecast 2023 to 2033, By Country
13.1. Historical Market Size Value (US$ Million) & Volume (Units) Trend Analysis By Market Taxonomy, 2018 to 2022
13.2. Market Size Value (US$ Million) & Volume (Units) Forecast By Market Taxonomy, 2023 to 2033
13.2.1. By Country
13.2.1.1. Poland
13.2.1.2. Russia
13.2.1.3. Czech Republic
13.2.1.4. Romania
13.2.1.5. Rest of Eastern Europe
13.2.2. By Product
13.2.3. By Animal Type
13.2.4. By Application
13.2.5. By End Use
13.3. Market Attractiveness Analysis
13.3.1. By Country
13.3.2. By Product
13.3.3. By Animal Type
13.3.4. By Application
13.3.5. By End Use
13.4. Key Takeaways
14. South Asia and Pacific Market Analysis 2018 to 2022 and Forecast 2023 to 2033, By Country
14.1. Historical Market Size Value (US$ Million) & Volume (Units) Trend Analysis By Market Taxonomy, 2018 to 2022
14.2. Market Size Value (US$ Million) & Volume (Units) Forecast By Market Taxonomy, 2023 to 2033
14.2.1. By Country
14.2.1.1. India
14.2.1.2. Bangladesh
14.2.1.3. Australia
14.2.1.4. New Zealand
14.2.1.5. Rest of South Asia and Pacific
14.2.2. By Product
14.2.3. By Animal Type
14.2.4. By Application
14.2.5. By End Use
14.3. Market Attractiveness Analysis
14.3.1. By Country
14.3.2. By Product
14.3.3. By Animal Type
14.3.4. By Application
14.3.5. By End Use
14.4. Key Takeaways
15. East Asia Market Analysis 2018 to 2022 and Forecast 2023 to 2033, By Country
15.1. Historical Market Size Value (US$ Million) & Volume (Units) Trend Analysis By Market Taxonomy, 2018 to 2022
15.2. Market Size Value (US$ Million) & Volume (Units) Forecast By Market Taxonomy, 2023 to 2033
15.2.1. By Country
15.2.1.1. China
15.2.1.2. Japan
15.2.1.3. South Korea
15.2.2. By Product
15.2.3. By Animal Type
15.2.4. By Application
15.2.5. By End Use
15.3. Market Attractiveness Analysis
15.3.1. By Country
15.3.2. By Product
15.3.3. By Animal Type
15.3.4. By Application
15.3.5. By End Use
15.4. Key Takeaways
16. Middle East and Africa Market Analysis 2018 to 2022 and Forecast 2023 to 2033, By Country
16.1. Historical Market Size Value (US$ Million) & Volume (Units) Trend Analysis By Market Taxonomy, 2018 to 2022
16.2. Market Size Value (US$ Million) & Volume (Units) Forecast By Market Taxonomy, 2023 to 2033
16.2.1. By Country
16.2.1.1. GCC Countries
16.2.1.2. South Africa
16.2.1.3. Israel
16.2.1.4. Rest of MEA
16.2.2. By Product
16.2.3. By Animal Type
16.2.4. By Application
16.2.5. By End Use
16.3. Market Attractiveness Analysis
16.3.1. By Country
16.3.2. By Product
16.3.3. By Animal Type
16.3.4. By Application
16.3.5. By End Use
16.4. Key Takeaways
17. Key Countries Market Analysis
17.1. USA
17.1.1. Pricing Analysis
17.1.2. Market Share Analysis, 2022
17.1.2.1. By Product
17.1.2.2. By Animal Type
17.1.2.3. By Application
17.1.2.4. By End Use
17.2. Canada
17.2.1. Pricing Analysis
17.2.2. Market Share Analysis, 2022
17.2.2.1. By Product
17.2.2.2. By Animal Type
17.2.2.3. By Application
17.2.2.4. By End Use
17.3. Brazil
17.3.1. Pricing Analysis
17.3.2. Market Share Analysis, 2022
17.3.2.1. By Product
17.3.2.2. By Animal Type
17.3.2.3. By Application
17.3.2.4. By End Use
17.4. Mexico
17.4.1. Pricing Analysis
17.4.2. Market Share Analysis, 2022
17.4.2.1. By Product
17.4.2.2. By Animal Type
17.4.2.3. By Application
17.4.2.4. By End Use
17.5. Germany
17.5.1. Pricing Analysis
17.5.2. Market Share Analysis, 2022
17.5.2.1. By Product
17.5.2.2. By Animal Type
17.5.2.3. By Application
17.5.2.4. By End Use
17.6. UK
17.6.1. Pricing Analysis
17.6.2. Market Share Analysis, 2022
17.6.2.1. By Product
17.6.2.2. By Animal Type
17.6.2.3. By Application
17.6.2.4. By End Use
17.7. France
17.7.1. Pricing Analysis
17.7.2. Market Share Analysis, 2022
17.7.2.1. By Product
17.7.2.2. By Animal Type
17.7.2.3. By Application
17.7.2.4. By End Use
17.8. Spain
17.8.1. Pricing Analysis
17.8.2. Market Share Analysis, 2022
17.8.2.1. By Product
17.8.2.2. By Animal Type
17.8.2.3. By Application
17.8.2.4. By End Use
17.9. Italy
17.9.1. Pricing Analysis
17.9.2. Market Share Analysis, 2022
17.9.2.1. By Product
17.9.2.2. By Animal Type
17.9.2.3. By Application
17.9.2.4. By End Use
17.10. Poland
17.10.1. Pricing Analysis
17.10.2. Market Share Analysis, 2022
17.10.2.1. By Product
17.10.2.2. By Animal Type
17.10.2.3. By Application
17.10.2.4. By End Use
17.11. Russia
17.11.1. Pricing Analysis
17.11.2. Market Share Analysis, 2022
17.11.2.1. By Product
17.11.2.2. By Animal Type
17.11.2.3. By Application
17.11.2.4. By End Use
17.12. Czech Republic
17.12.1. Pricing Analysis
17.12.2. Market Share Analysis, 2022
17.12.2.1. By Product
17.12.2.2. By Animal Type
17.12.2.3. By Application
17.12.2.4. By End Use
17.13. Romania
17.13.1. Pricing Analysis
17.13.2. Market Share Analysis, 2022
17.13.2.1. By Product
17.13.2.2. By Animal Type
17.13.2.3. By Application
17.13.2.4. By End Use
17.14. India
17.14.1. Pricing Analysis
17.14.2. Market Share Analysis, 2022
17.14.2.1. By Product
17.14.2.2. By Animal Type
17.14.2.3. By Application
17.14.2.4. By End Use
17.15. Bangladesh
17.15.1. Pricing Analysis
17.15.2. Market Share Analysis, 2022
17.15.2.1. By Product
17.15.2.2. By Animal Type
17.15.2.3. By Application
17.15.2.4. By End Use
17.16. Australia
17.16.1. Pricing Analysis
17.16.2. Market Share Analysis, 2022
17.16.2.1. By Product
17.16.2.2. By Animal Type
17.16.2.3. By Application
17.16.2.4. By End Use
17.17. New Zealand
17.17.1. Pricing Analysis
17.17.2. Market Share Analysis, 2022
17.17.2.1. By Product
17.17.2.2. By Animal Type
17.17.2.3. By Application
17.17.2.4. By End Use
17.18. China
17.18.1. Pricing Analysis
17.18.2. Market Share Analysis, 2022
17.18.2.1. By Product
17.18.2.2. By Animal Type
17.18.2.3. By Application
17.18.2.4. By End Use
17.19. Japan
17.19.1. Pricing Analysis
17.19.2. Market Share Analysis, 2022
17.19.2.1. By Product
17.19.2.2. By Animal Type
17.19.2.3. By Application
17.19.2.4. By End Use
17.20. South Korea
17.20.1. Pricing Analysis
17.20.2. Market Share Analysis, 2022
17.20.2.1. By Product
17.20.2.2. By Animal Type
17.20.2.3. By Application
17.20.2.4. By End Use
17.21. GCC Countries
17.21.1. Pricing Analysis
17.21.2. Market Share Analysis, 2022
17.21.2.1. By Product
17.21.2.2. By Animal Type
17.21.2.3. By Application
17.21.2.4. By End Use
17.22. South Africa
17.22.1. Pricing Analysis
17.22.2. Market Share Analysis, 2022
17.22.2.1. By Product
17.22.2.2. By Animal Type
17.22.2.3. By Application
17.22.2.4. By End Use
17.23. Israel
17.23.1. Pricing Analysis
17.23.2. Market Share Analysis, 2022
17.23.2.1. By Product
17.23.2.2. By Animal Type
17.23.2.3. By Application
17.23.2.4. By End Use
18. Market Structure Analysis
18.1. Competition Dashboard
18.2. Competition Benchmarking
18.3. Market Share Analysis of Top Players
18.3.1. By Regional
18.3.2. By Product
18.3.3. By Animal Type
18.3.4. By Application
18.3.5. By End Use
19. Competition Analysis
19.1. Competition Deep Dive
19.1.1. Symmetry Surgical Inc.
19.1.1.1. Overview
19.1.1.2. Product Portfolio
19.1.1.3. Profitability by Market Segments
19.1.1.4. Sales Footprint
19.1.1.5. Strategy Overview
19.1.1.5.1. Marketing Strategy
19.1.1.5.2. Product Strategy
19.1.1.5.3. Channel Strategy
19.1.2. KARL STORZ
19.1.2.1. Overview
19.1.2.2. Product Portfolio
19.1.2.3. Profitability by Market Segments
19.1.2.4. Sales Footprint
19.1.2.5. Strategy Overview
19.1.2.5.1. Marketing Strategy
19.1.2.5.2. Product Strategy
19.1.2.5.3. Channel Strategy
19.1.3. Avante Animal Health
19.1.3.1. Overview
19.1.3.2. Product Portfolio
19.1.3.3. Profitability by Market Segments
19.1.3.4. Sales Footprint
19.1.3.5. Strategy Overview
19.1.3.5.1. Marketing Strategy
19.1.3.5.2. Product Strategy
19.1.3.5.3. Channel Strategy
19.1.4. CVS Group
19.1.4.1. Overview
19.1.4.2. Product Portfolio
19.1.4.3. Profitability by Market Segments
19.1.4.4. Sales Footprint
19.1.4.5. Strategy Overview
19.1.4.5.1. Marketing Strategy
19.1.4.5.2. Product Strategy
19.1.4.5.3. Channel Strategy
19.1.5. DRE Veterinary
19.1.5.1. Overview
19.1.5.2. Product Portfolio
19.1.5.3. Profitability by Market Segments
19.1.5.4. Sales Footprint
19.1.5.5. Strategy Overview
19.1.5.5.1. Marketing Strategy
19.1.5.5.2. Product Strategy
19.1.5.5.3. Channel Strategy
19.1.6. B. Braun Melsungen AG
19.1.6.1. Overview
19.1.6.2. Product Portfolio
19.1.6.3. Profitability by Market Segments
19.1.6.4. Sales Footprint
19.1.6.5. Strategy Overview
19.1.6.5.1. Marketing Strategy
19.1.6.5.2. Product Strategy
19.1.6.5.3. Channel Strategy
19.1.7. Medtronic
19.1.7.1. Overview
19.1.7.2. Product Portfolio
19.1.7.3. Profitability by Market Segments
19.1.7.4. Sales Footprint
19.1.7.5. Strategy Overview
19.1.7.5.1. Marketing Strategy
19.1.7.5.2. Product Strategy
19.1.7.5.3. Channel Strategy
19.1.8. Summit Hill Laboratories
19.1.8.1. Overview
19.1.8.2. Product Portfolio
19.1.8.3. Profitability by Market Segments
19.1.8.4. Sales Footprint
19.1.8.5. Strategy Overview
19.1.8.5.1. Marketing Strategy
19.1.8.5.2. Product Strategy
19.1.8.5.3. Channel Strategy
19.1.9. Kwanza Veterinary
19.1.9.1. Overview
19.1.9.2. Product Portfolio
19.1.9.3. Profitability by Market Segments
19.1.9.4. Sales Footprint
19.1.9.5. Strategy Overview
19.1.9.5.1. Marketing Strategy
19.1.9.5.2. Product Strategy
19.1.9.5.3. Channel Strategy
19.1.10. Burtons Medical Equipment Ltd.
19.1.10.1. Overview
19.1.10.2. Product Portfolio
19.1.10.3. Profitability by Market Segments
19.1.10.4. Sales Footprint
19.1.10.5. Strategy Overview
19.1.10.5.1. Marketing Strategy
19.1.10.5.2. Product Strategy
19.1.10.5.3. Channel Strategy
19.1.11. EICKEMEYER
19.1.11.1. Overview
19.1.11.2. Product Portfolio
19.1.11.3. Profitability by Market Segments
19.1.11.4. Sales Footprint
19.1.11.5. Strategy Overview
19.1.11.5.1. Marketing Strategy
19.1.11.5.2. Product Strategy
19.1.11.5.3. Channel Strategy
19.1.12. Macan Manufacturing
19.1.12.1. Overview
19.1.12.2. Product Portfolio
19.1.12.3. Profitability by Market Segments
19.1.12.4. Sales Footprint
19.1.12.5. Strategy Overview
19.1.12.5.1. Marketing Strategy
19.1.12.5.2. Product Strategy
19.1.12.5.3. Channel Strategy
20. Assumptions & Acronyms Used
21. Research Methodology
Explore Healthcare Insights
View Reports