Vegetable Parchment Paper Market Size and Share Forecast Outlook 2025 to 2035

The global vegetable parchment paper market is projected to grow from USD 1.3 billion in 2025 to USD 2.5 billion by 2035, registering a CAGR of 5.4% over the forecast period. Sales in 2024 were recorded at USD 1.28 billion.

This growth is primarily attributed to the increasing demand for eco-friendly and biodegradable packaging solutions across various industries, including food and beverage, cosmetics, and pharmaceuticals. Vegetable parchment paper, made from cellulose fibers, offers a sustainable alternative to traditional plastic packaging, aligning with global efforts to reduce plastic waste and environmental pollution.
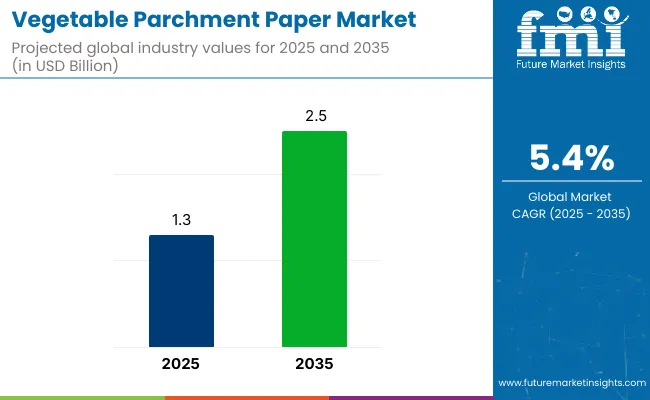
Quick Stats of Vegetable Parchment Paper Market

  • Market Value (2025): USD 1.3 billion
  • Forecast Value (2035): USD 2.5 billion
  • Forecast CAGR: 5.4%
  • Basis Weight Leader in 2025: 41 to 60 GSM (46.9% market share)
  • Top Material: Bleached (58.1% share)
  • Key Growth Country: East Asia (Japan is the fastest-growing market with 7.4% CAGR)

Vegetable Parchment Paper Market

Metric Value
Market Size in 2025 USD 1.3 billion
Projected Market Size in 2035 USD 2.5 billion
CAGR (2025 to 2035) 5.4%

In May 2025, Ahlstrom, a global leader in fiber-based specialty materials, inaugurated its new parchmentizer, PMZ5, at its Saint-Séverin plant in France. This EUR 15 million investment underscores Ahlstrom’s commitment to sustainable innovation and customer collaboration.

The new parchmentizer enhances the company's capacity to produce vegetable parchment paper, catering to the growing demand for eco-friendly packaging solutions. "For our Saint-Séverin colleagues, this is a major milestone: Ahlstrom’s next step in growing our portfolio of solutions that are safe and sustainable by design. This is a great plant, with great people to match. We believe in you wholeheartedly, and that is why we are investing in Saint-Séverin’s growth," stated Helen Mets, Ahlstrom’s President and CEO at the inauguration.

Recent innovations in vegetable parchment paper have led to significant improvements in product functionality and customization. Manufacturers have focused on developing high-quality, secure, and durable packaging solutions that cater to the specific needs of various industries.

Advancements in processing technologies have enabled the production of visually appealing and intricate packaging designs, enhancing their aesthetic value. Additionally, the integration of eco-friendly materials and sustainable practices has improved the environmental footprint of vegetable parchment paper.

The vegetable parchment paper market is expected to witness significant growth in emerging economies, particularly in the Asia-Pacific region, due to rapid urbanization and increasing consumer awareness. Applications are expanding beyond traditional sectors, with growing adoption in personal care and industrial packaging. Manufacturers are anticipated to focus on developing cost-effective and versatile packaging solutions to cater to diverse consumer needs and comply with evolving environmental regulations

Analyzing Vegetable Parchment Paper Market by Top Investment Segment

The market has been segmented based on basis weight, material, product type, and region. By basis weight, categories such as below 40 GSM, 41 to 60 GSM, and 61 to 80 GSM have been defined to support various end-use needs in food-grade wrapping and baking applications.

Materials including bleached and unbleached paper have been utilized to provide visual appeal, sustainability, and chemical-free alternatives for diverse customer preferences. Product types have been classified into plain vegetable parchment and siliconized vegetable parchment to meet requirements for grease resistance, moisture control, and surface performance.

Regional segmentation has been carried out across North America, Latin America, East Asia, South Asia & Pacific, Eastern Europe, Western Europe, Oceania, and the Middle East & Africa to reflect demand variations and production trends globally.
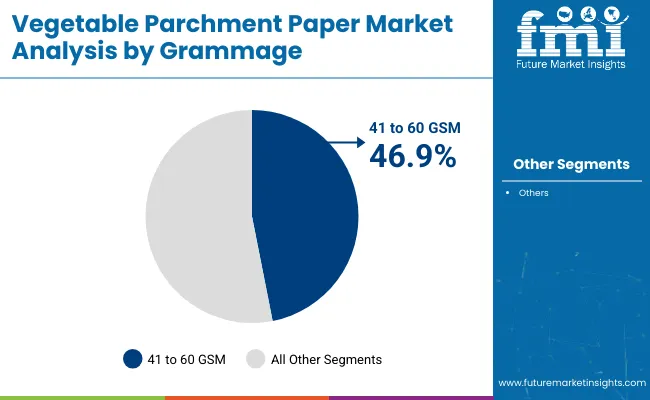
41 to 60 GSM Segment Chosen for Its Balanced Strength and Versatility

Vegetable Parchment Paper Market Analysis By Grammage

The 41 to 60 GSM segment is expected to capture the largest share of 46.9% in the vegetable parchment paper market by 2025, as its selection has been supported by optimal thickness for baking, wrapping, and industrial use. This weight range has been widely adopted in food preparation where grease resistance, heat tolerance, and handling strength are required.

Sheets and rolls within this range have been preferred for automated cutting, folding, and lining operations. Demand has been reinforced across both domestic and commercial culinary sectors. Applications such as baking trays, deli wraps, and cheese interleaving have utilized this grade for performance consistency.

Ease of printing and embossing has been demonstrated for brand customization. Resistance to curling and tearing has made it suitable for high-speed packing lines. Continued usage has been projected as food processors maintain strict operational standards for packaging materials.
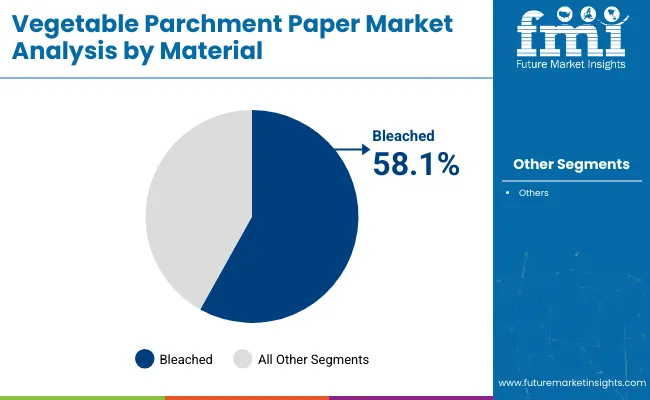
Bleached Material Segment Used Widely for Its Clean Appearance and Print Clarity

Vegetable Parchment Paper Market Analysis By Material

The bleached material segment is projected to account for 58.1% of the vegetable parchment paper market in 2025, as its use has been favored in foodservice and retail packaging requiring bright surfaces. High visual appeal and smooth finish have been leveraged for premium product presentation and labeling clarity. Bleached grades have been extensively deployed for bakery liners, confectionery wraps, and display packs. Strong opacity and uniform texture have supported clean cuts and folds during packaging.

Ink absorption and high-resolution printing have enabled its use in branded formats across supermarket and hospitality settings. Heat resistance and greaseproof properties have remained consistent across food-contact applications. Multi-layer wrapping and tray linings have been executed efficiently using bleached sheets. Market preference has remained high due to aesthetic uniformity and performance across both artisanal and industrial use cases.

Challenges and Opportunities

Challenges

Cost sensitivity, performance limitations, and raw material constraints impact scale.

As an expensive, multipurpose DIY option, vegetable parchment paper has yet to catch on in more budget-friendly or low-margin food segments. While good for grease and moisture resistance, it may not be as durable for heavy-duty use as foil or coated alternatives.

Pulp sourcing constraints, specifically for FSC-certified virgin fibers, and energy-intensive processing to reach parchmentization also lead to production bottlenecks. And, the knowledge of small-scale food businesses in developing areas is limited, resulting in less market penetration.

Opportunities

Eco-label certifications, premium food packaging, and industrial baking fuel demand.

There is a huge opportunity for vegetable parchment paper due to increasing demand for compostable and food-grade packaging in artisanal, organic, and ready-to-eat foods. Premise: Manufacturers producing recyclable or dual-use (bake-and-wrap) parchment sheets are appropriately positioned to gain share in premium food retail.

In the global marketplace, eco-label certifications (such as FSC, PEFC, and USDA Biobased) are becoming a very important differentiator. Food processors are also moving away from silicone-coated plastic liners to parchment-based solutions for the baking conveyor belts and packaging liners used in industrial ovens, creating high-volume, B2B opportunities.

Country-Wise Outlook

United States

Rapid industrialization in the USA along with the increasing use of factors like foodservice, bakery and packaging have aided the growth of the USA vegetable parchment paper market. Adoption in home and commercial kitchens is growing as consumers increasingly prefer non-stick, grease-resistant, and compostable baking solutions.

But first, the FDA has approved vegetable parchment for direct-food contact as being safe for omission under most circumstances, which supports its widespread use in organic and natural food packaging. Manufacturers are getting creative with chlorine-free, silicone-coated and multi-use parchment varieties. Growth is further buoyed by the rising sales of pre-cut sheets and rolls through e-commerce and specialty retail channels.

Country CAGR (2025 to 2035)
United States 5.7%

United Kingdom

The vegetable parchment paper market is fueled by a growing trend for eco-friendly and plastic-free food preparation products in the UK. There is high demand in artisanal bakeries, cafes and home kitchens looking for sustainable alternatives to waxed or plastic-coated papers.

The UK Plastic Packaging Tax and retailer-led green packaging commitments are propelling the transition to biodegradable parchment. Domestic brands are snarling unbleached and silicone-free varieties certified for compostability and food safety. Vegetable parchment is now available in reusable and resealable formats in premium lines of baking and cooking products.

Country CAGR (2025 to 2035)
United Kingdom 5.2%

European Union

The EU vegetable parchment paper market is driving on the regulatory backing on food-grade, biodegradable, and recyclable packaging under the EU Green Deal and Circular Economy Action Plan. Parchment remains widely produced and consumed in Germany, France and Italy, for both household and industrial use in baking applications.

Vegetable parchment is favoured among EU food processors because of its thermal stability, non-stick function and low risk of chemical migration. Development of parchment laminates and printable formats for branding in baked goods packaging is another prominent factor pushing commercial sector gain in recent years.

Country CAGR (2025 to 2035)
European Union 5.4%

Japan

The Japan vegetable parchment paper market is progressing; with the increase in interest for traditional and fusion baking, food gifting, and convenience cooking. The product is well-suited for use in home kitchens and bakeries for its grease resistance, moisture stability, and clean release properties.

The Ministry of Health, Labour and Welfare promotes the use of food contact safe, low-emission paper product. From patterned to microwave-friendly, domestic brands are even releasing pre-cut parchment papers for packaged meals, pastries and bentos. Consumer interest in zero-waste lifestyles also lends support to compostable parchment formats.

Country CAGR (2025 to 2035)
Japan 5.1%

South Korea

Demand for vegetable parchment paper is surging in South Korea on increased home baking trends, ready-to-eat food packaging, and eco-conscious consumption. A staple in oven cooking, air-fryer meals and café dessert preparation, parchment paper is popular for being hygienic, non-toxic and easy to use.

Chlorine-free and PFAS-free parchment adoption is also capitalizing on government regulations that encourage biodegradable and food-safe packaging. Heat-sealable and embossed parchment versions are being launched by Korean manufacturers for bakery chains, patisseries and gourmet food brands. E-commerce platforms are leading to greater sales across urban consumers and DIY cooking communities.

Country CAGR (2025 to 2035)
South Korea 5.6%

Competitive Outlook

Demand for vegetable parchment paper is getting driven by their widely used applications in food processing, bakery applications and sustainable packaging which help to drive steady growth in the vegetable parchment paper market. Vegetable parchment paper is grease-resistant, biodegradable, and heat-resistant, which makes it perfect for baking, wrapping, and separating food products.

Its adoption is being propelled by surging consumer demand for sustainable single-use kitchenware as well as the growing artisanal bakery markets worldwide. Manufacturers are focusing on unbleached, chlorine-free, and silicone-coated parchment paper types for home use as industrial and regulatory standards trend towards plastic alternatives and compostable materials.

Key Companies

  • Ahlstrom-Munksjo Oyj
  • VPK Group NV
  • McNairn Packaging
  • Nordic Paper
  • Hydon Paper Ltd.
  • Cheever Specialty Paper & Film
  • Pudumjee Paper Products Ltd.
  • JK Papers
  • Baichuan Paper
  • GLR Impex Private Limite

Key Segmentation

By Basis Weight:

  • Below 40 GSM
  • 41 to 60 GSM
  • 61 to 80 GSM

By Material:

  • Bleached
  • Unbleached

By Product Type:

  • Plain Vegetable Parchment
  • Siliconized Vegetable Parchment

By Region:

  • North America
  • Latin America
  • Europe
  • East Asia
  • South Asia
  • Oceania
  • MEA

Table of Content

  1. Executive Summary
    • Global Market Outlook
    • Demand-side Trends
    • Supply-side Trends
    • Technology Roadmap Analysis
    • Analysis and Recommendations
  2. Market Overview
    • Market Coverage/Taxonomy
    • Market Definition/Scope/Limitations
  3. Market Background
    • Market Dynamics
      • Drivers
      • Restraints
      • Opportunity
      • Trends
    • Scenario Forecast
      • Demand in Optimistic Scenario
      • Demand in Likely Scenario
      • Demand in Conservative Scenario
    • Opportunity Map Analysis
    • Product Life Cycle Analysis
    • Supply Chain Analysis
      • Supply Side Participants and their Roles
        • Producers
        • Mid-Level Participants (Traders/Agents/Brokers)
        • Wholesalers and Distributors
      • Value Added and Value Created at Node in the Supply Chain
      • List of Raw Material Suppliers
      • List of Existing and Potential Buyer’s
    • Investment Feasibility Matrix
    • Value Chain Analysis
      • Profit Margin Analysis
      • Wholesalers and Distributors
      • Retailers
    • PESTLE and Porter’s Analysis
    • Regulatory Landscape
      • By Key Regions
      • By Key Countries
    • Regional Parent Market Outlook
    • Production and Consumption Statistics
    • Import and Export Statistics
  4. Global Analysis 2020 to 2024 and Forecast, 2025 to 2035
    • Historical Market Size Value (USD Billion) & Volume (Units) Analysis, 2020 to 2024
    • Current and Future Market Size Value (USD Billion) & Volume (Units) Projections, 2025 to 2035
      • Y-o-Y Growth Trend Analysis
      • Absolute $ Opportunity Analysis
  5. Global Pricing Analysis 2020 to 2024 and Forecast 2025 to 2035
  6. Global Analysis 2020 to 2024 and Forecast 2025 to 2035, By Basis Weight
    • Introduction/Key Findings
    • Historical Market Size Value (USD Billion) & Volume (Units) Analysis By Basis Weight, 2020 to 2024
    • Current and Future Market Size Value (USD Billion) & Volume (Units) Analysis and Forecast By Basis Weight, 2025 to 2035
      • Below 40 GSM
      • 41 to 60 GSM
      • 61 to 80 GSM
    • Y-o-Y Growth Trend Analysis By Basis Weight, 2020 to 2024
    • Absolute $ Opportunity Analysis By Basis Weight, 2025 to 2035
  7. Global Analysis 2020 to 2024 and Forecast 2025 to 2035, By Material
    • Introduction/Key Findings
    • Historical Market Size Value (USD Billion) & Volume (Units) Analysis By Material, 2020 to 2024
    • Current and Future Market Size Value (USD Billion) & Volume (Units) Analysis and Forecast By Material, 2025 to 2035
      • Bleached
      • Unbleached
    • Y-o-Y Growth Trend Analysis By Material, 2020 to 2024
    • Absolute $ Opportunity Analysis By Material, 2025 to 2035
  8. Global Analysis 2020 to 2024 and Forecast 2025 to 2035, By Product Type
    • Introduction/Key Findings
    • Historical Market Size Value (USD Billion) & Volume (Units) Analysis By Product Type, 2020 to 2024
    • Current and Future Market Size Value (USD Billion) & Volume (Units) Analysis and Forecast By Product Type, 2025 to 2035
      • Plain Vegetable Parchment
      • Siliconized Vegetable Parchment
    • Y-o-Y Growth Trend Analysis By Product Type, 2020 to 2024
    • Absolute $ Opportunity Analysis By Product Type, 2025 to 2035
  9. Global Analysis 2020 to 2024 and Forecast 2025 to 2035, By Region
    • Introduction
    • Historical Market Size Value (USD Billion) & Volume (Units) Analysis By Region, 2020 to 2024
    • Current Market Size Value (USD Billion) & Volume (Units) Analysis and Forecast By Region, 2025 to 2035
      • North America
      • Latin America
      • Europe
      • East Asia
      • South Asia
      • Oceania
      • MEA
    • Market Attractiveness Analysis By Region
  10. North America Analysis 2020 to 2024 and Forecast 2025 to 2035, By Country
    • Historical Market Size Value (USD Billion) & Volume (Units) Trend Analysis By Market Taxonomy, 2020 to 2024
    • Market Size Value (USD Billion) & Volume (Units) Forecast By Market Taxonomy, 2025 to 2035
      • By Country
        • USA
        • Canada
      • By Basis Weight
      • By Material
      • By Product Type
    • Market Attractiveness Analysis
      • By Country
      • By Basis Weight
      • By Material
      • By Product Type
    • Key Takeaways
  11. Latin America Analysis 2020 to 2024 and Forecast 2025 to 2035, By Country
    • Historical Market Size Value (USD Billion) & Volume (Units) Trend Analysis By Market Taxonomy, 2020 to 2024
    • Market Size Value (USD Billion) & Volume (Units) Forecast By Market Taxonomy, 2025 to 2035
      • By Country
        • Brazil
        • Mexico
        • Argentina
        • Chile
        • Peru
        • Rest of Latin America
      • By Basis Weight
      • By Material
      • By Product Type
    • Market Attractiveness Analysis
      • By Country
      • By Basis Weight
      • By Material
      • By Product Type
    • Key Takeaways
  12. Europe Analysis 2020 to 2024 and Forecast 2025 to 2035, By Country
    • Historical Market Size Value (USD Billion) & Volume (Units) Trend Analysis By Market Taxonomy, 2020 to 2024
    • Market Size Value (USD Billion) & Volume (Units) Forecast By Market Taxonomy, 2025 to 2035
      • By Country
        • Germany
        • Italy
        • France
        • UK
        • Spain
        • Russia
        • BENELUX
        • Rest of Europe
      • By Basis Weight
      • By Material
      • By Product Type
    • Market Attractiveness Analysis
      • By Country
      • By Basis Weight
      • By Material
      • By Product Type
    • Key Takeaways
  13. East Asia Analysis 2020 to 2024 and Forecast 2025 to 2035, By Country
    • Historical Market Size Value (USD Billion) & Volume (Units) Trend Analysis By Market Taxonomy, 2020 to 2024
    • Market Size Value (USD Billion) & Volume (Units) Forecast By Market Taxonomy, 2025 to 2035
      • By Country
        • China
        • Japan
        • South Korea
      • By Basis Weight
      • By Material
      • By Product Type
    • Market Attractiveness Analysis
      • By Country
      • By Basis Weight
      • By Material
      • By Product Type
    • Key Takeaways
  14. South Asia Analysis 2020 to 2024 and Forecast 2025 to 2035, By Country
    • Historical Market Size Value (USD Billion) & Volume (Units) Trend Analysis By Market Taxonomy, 2020 to 2024
    • Market Size Value (USD Billion) & Volume (Units) Forecast By Market Taxonomy, 2025 to 2035
      • By Country
        • India
        • Thailand
        • Malaysia
        • Indonesia
        • Rest of South Asia
      • By Basis Weight
      • By Material
      • By Product Type
    • Market Attractiveness Analysis
      • By Country
      • By Basis Weight
      • By Material
      • By Product Type
    • Key Takeaways
  15. Oceania Analysis 2020 to 2024 and Forecast 2025 to 2035, By Country
    • Historical Market Size Value (USD Billion) & Volume (Units) Trend Analysis By Market Taxonomy, 2020 to 2024
    • Market Size Value (USD Billion) & Volume (Units) Forecast By Market Taxonomy, 2025 to 2035
      • By Country
        • Australia
        • New Zealand
      • By Basis Weight
      • By Material
      • By Product Type
    • Market Attractiveness Analysis
      • By Country
      • By Basis Weight
      • By Material
      • By Product Type
    • Key Takeaways
  16. MEA Analysis 2020 to 2024 and Forecast 2025 to 2035, By Country
    • Historical Market Size Value (USD Billion) & Volume (Units) Trend Analysis By Market Taxonomy, 2020 to 2024
    • Market Size Value (USD Billion) & Volume (Units) Forecast By Market Taxonomy, 2025 to 2035
      • By Country
        • GCC
        • Rest of MEA
      • By Basis Weight
      • By Material
      • By Product Type
    • Market Attractiveness Analysis
      • By Country
      • By Basis Weight
      • By Material
      • By Product Type
    • Key Takeaways
  17. Key Countries Analysis
    • USA
      • Pricing Analysis
      • Market Share Analysis, 2024
        • By Basis Weight
        • By Material
        • By Product Type
    • Canada
      • Pricing Analysis
      • Market Share Analysis, 2024
        • By Basis Weight
        • By Material
        • By Product Type
    • Brazil
      • Pricing Analysis
      • Market Share Analysis, 2024
        • By Basis Weight
        • By Material
        • By Product Type
    • Mexico
      • Pricing Analysis
      • Market Share Analysis, 2024
        • By Basis Weight
        • By Material
        • By Product Type
    • Argentina
      • Pricing Analysis
      • Market Share Analysis, 2024
        • By Basis Weight
        • By Material
        • By Product Type
  18. Market Structure Analysis
    • Competition Dashboard
    • Competition Benchmarking
    • Market Share Analysis of Top Players
      • By Regional
      • By Basis Weight
      • By Material
      • By Product Type
  19. Competition Analysis
    • Competition Deep Dive
      • Ahlstrom-Munksjo Oyj
        • Overview
        • Product Portfolio
        • Profitability by Market Segments (Product/Age /Sales Channel/Region)
        • Sales Footprint
        • Strategy Overview
          • Marketing Strategy
          • Product Strategy
          • Channel Strategy
      • VPK Group NV
        • Overview
        • Product Portfolio
        • Profitability by Market Segments (Product/Age /Sales Channel/Region)
        • Sales Footprint
        • Strategy Overview
          • Marketing Strategy
          • Product Strategy
          • Channel Strategy
      • McNairn Packaging
        • Overview
        • Product Portfolio
        • Profitability by Market Segments (Product/Age /Sales Channel/Region)
        • Sales Footprint
        • Strategy Overview
          • Marketing Strategy
          • Product Strategy
          • Channel Strategy
      • Nordic Paper
        • Overview
        • Product Portfolio
        • Profitability by Market Segments (Product/Age /Sales Channel/Region)
        • Sales Footprint
        • Strategy Overview
          • Marketing Strategy
          • Product Strategy
          • Channel Strategy
      • Hydon Paper Ltd.
        • Overview
        • Product Portfolio
        • Profitability by Market Segments (Product/Age /Sales Channel/Region)
        • Sales Footprint
        • Strategy Overview
          • Marketing Strategy
          • Product Strategy
          • Channel Strategy
      • Cheever Specialty Paper & Film
        • Overview
        • Product Portfolio
        • Profitability by Market Segments (Product/Age /Sales Channel/Region)
        • Sales Footprint
        • Strategy Overview
          • Marketing Strategy
          • Product Strategy
          • Channel Strategy
      • Pudumjee Paper Products Ltd.
        • Overview
        • Product Portfolio
        • Profitability by Market Segments (Product/Age /Sales Channel/Region)
        • Sales Footprint
        • Strategy Overview
          • Marketing Strategy
          • Product Strategy
          • Channel Strategy
      • JK Papers
        • Overview
        • Product Portfolio
        • Profitability by Market Segments (Product/Age /Sales Channel/Region)
        • Sales Footprint
        • Strategy Overview
          • Marketing Strategy
          • Product Strategy
          • Channel Strategy
      • Baichuan Paper
        • Overview
        • Product Portfolio
        • Profitability by Market Segments (Product/Age /Sales Channel/Region)
        • Sales Footprint
        • Strategy Overview
          • Marketing Strategy
          • Product Strategy
          • Channel Strategy
      • GLR Impex Private Limited
        • Overview
        • Product Portfolio
        • Profitability by Market Segments (Product/Age /Sales Channel/Region)
        • Sales Footprint
        • Strategy Overview
          • Marketing Strategy
          • Product Strategy
          • Channel Strategy
  20. Assumptions & Acronyms Used
  21. Research Methodology

List of Tables

  • Table 1: Global Value (USD Billion) Forecast by Region, 2020-2035
  • Table 2: Global Volume (Units) Forecast by Region, 2020-2035
  • Table 3: Global Value (USD Billion) Forecast by Basis Weight, 2020-2035
  • Table 4: Global Volume (Units) Forecast by Basis Weight, 2020-2035
  • Table 5: Global Value (USD Billion) Forecast by Material, 2020-2035
  • Table 6: Global Volume (Units) Forecast by Material, 2020-2035
  • Table 7: Global Value (USD Billion) Forecast by Product Type, 2020-2035
  • Table 8: Global Volume (Units) Forecast by Product Type, 2020-2035
  • Table 9: North America Value (USD Billion) Forecast by Country, 2020-2035
  • Table 10: North America Volume (Units) Forecast by Country, 2020-2035
  • Table 11: North America Value (USD Billion) Forecast by Basis Weight, 2020-2035
  • Table 12: North America Volume (Units) Forecast by Basis Weight, 2020-2035
  • Table 13: North America Value (USD Billion) Forecast by Material, 2020-2035
  • Table 14: North America Volume (Units) Forecast by Material, 2020-2035
  • Table 15: North America Value (USD Billion) Forecast by Product Type, 2020-2035
  • Table 16: North America Volume (Units) Forecast by Product Type, 2020-2035
  • Table 17: Latin America Value (USD Billion) Forecast by Country, 2020-2035
  • Table 18: Latin America Volume (Units) Forecast by Country, 2020-2035
  • Table 19: Latin America Value (USD Billion) Forecast by Basis Weight, 2020-2035
  • Table 20: Latin America Volume (Units) Forecast by Basis Weight, 2020-2035
  • Table 21: Latin America Value (USD Billion) Forecast by Material, 2020-2035
  • Table 22: Latin America Volume (Units) Forecast by Material, 2020-2035
  • Table 23: Latin America Value (USD Billion) Forecast by Product Type, 2020-2035
  • Table 24: Latin America Volume (Units) Forecast by Product Type, 2020-2035
  • Table 25: Europe Value (USD Billion) Forecast by Country, 2020-2035
  • Table 26: Europe Volume (Units) Forecast by Country, 2020-2035
  • Table 27: Europe Value (USD Billion) Forecast by Basis Weight, 2020-2035
  • Table 28: Europe Volume (Units) Forecast by Basis Weight, 2020-2035
  • Table 29: Europe Value (USD Billion) Forecast by Material, 2020-2035
  • Table 30: Europe Volume (Units) Forecast by Material, 2020-2035
  • Table 31: Europe Value (USD Billion) Forecast by Product Type, 2020-2035
  • Table 32: Europe Volume (Units) Forecast by Product Type, 2020-2035
  • Table 33: East Asia Value (USD Billion) Forecast by Country, 2020-2035
  • Table 34: East Asia Volume (Units) Forecast by Country, 2020-2035
  • Table 35: East Asia Value (USD Billion) Forecast by Basis Weight, 2020-2035
  • Table 36: East Asia Volume (Units) Forecast by Basis Weight, 2020-2035
  • Table 37: East Asia Value (USD Billion) Forecast by Material, 2020-2035
  • Table 38: East Asia Volume (Units) Forecast by Material, 2020-2035
  • Table 39: East Asia Value (USD Billion) Forecast by Product Type, 2020-2035
  • Table 40: East Asia Volume (Units) Forecast by Product Type, 2020-2035
  • Table 41: South Asia Value (USD Billion) Forecast by Country, 2020-2035
  • Table 42: South Asia Volume (Units) Forecast by Country, 2020-2035
  • Table 43: South Asia Value (USD Billion) Forecast by Basis Weight, 2020-2035
  • Table 44: South Asia Volume (Units) Forecast by Basis Weight, 2020-2035
  • Table 45: South Asia Value (USD Billion) Forecast by Material, 2020-2035
  • Table 46: South Asia Volume (Units) Forecast by Material, 2020-2035
  • Table 47: South Asia Value (USD Billion) Forecast by Product Type, 2020-2035
  • Table 48: South Asia Volume (Units) Forecast by Product Type, 2020-2035
  • Table 49: Oceania Value (USD Billion) Forecast by Country, 2020-2035
  • Table 50: Oceania Volume (Units) Forecast by Country, 2020-2035
  • Table 51: Oceania Value (USD Billion) Forecast by Basis Weight, 2020-2035
  • Table 52: Oceania Volume (Units) Forecast by Basis Weight, 2020-2035
  • Table 53: Oceania Value (USD Billion) Forecast by Material, 2020-2035
  • Table 54: Oceania Volume (Units) Forecast by Material, 2020-2035
  • Table 55: Oceania Value (USD Billion) Forecast by Product Type, 2020-2035
  • Table 56: Oceania Volume (Units) Forecast by Product Type, 2020-2035
  • Table 57: MEA Value (USD Billion) Forecast by Country, 2020-2035
  • Table 58: MEA Volume (Units) Forecast by Country, 2020-2035
  • Table 59: MEA Value (USD Billion) Forecast by Basis Weight, 2020-2035
  • Table 60: MEA Volume (Units) Forecast by Basis Weight, 2020-2035
  • Table 61: MEA Value (USD Billion) Forecast by Material, 2020-2035
  • Table 62: MEA Volume (Units) Forecast by Material, 2020-2035
  • Table 63: MEA Value (USD Billion) Forecast by Product Type, 2020-2035
  • Table 64: MEA Volume (Units) Forecast by Product Type, 2020-2035

List of Figures

  • Figure 1: Global Volume (Units) Forecast 2020-2035
  • Figure 2: Global Pricing Analysis
  • Figure 3: Global Value (USD Billion) Forecast 2020-2035
  • Figure 4: Global Value Share and BPS Analysis by Basis Weight, 2025 and 2035
  • Figure 5: Global Y-o-Y Growth Comparison by Basis Weight, 2025-2035
  • Figure 6: Global Attractiveness Analysis by Basis Weight
  • Figure 7: Global Value Share and BPS Analysis by Material, 2025 and 2035
  • Figure 8: Global Y-o-Y Growth Comparison by Material, 2025-2035
  • Figure 9: Global Attractiveness Analysis by Material
  • Figure 10: Global Value Share and BPS Analysis by Product Type, 2025 and 2035
  • Figure 11: Global Y-o-Y Growth Comparison by Product Type, 2025-2035
  • Figure 12: Global Attractiveness Analysis by Product Type
  • Figure 13: Global Value (USD Billion) Share and BPS Analysis by Region, 2025 and 2035
  • Figure 14: Global Y-o-Y Growth Comparison by Region, 2025-2035
  • Figure 15: Global Attractiveness Analysis by Region
  • Figure 16: North America Incremental $ Opportunity, 2025-2035
  • Figure 17: Latin America Incremental $ Opportunity, 2025-2035
  • Figure 18: Europe Incremental $ Opportunity, 2025-2035
  • Figure 19: East Asia Incremental $ Opportunity, 2025-2035
  • Figure 20: South Asia Incremental $ Opportunity, 2025-2035
  • Figure 21: Oceania Incremental $ Opportunity, 2025-2035
  • Figure 22: MEA Incremental $ Opportunity, 2025-2035
  • Figure 23: North America Value Share and BPS Analysis by Country, 2025 and 2035
  • Figure 24: North America Value Share and BPS Analysis by Basis Weight, 2025 and 2035
  • Figure 25: North America Y-o-Y Growth Comparison by Basis Weight, 2025-2035
  • Figure 26: North America Attractiveness Analysis by Basis Weight
  • Figure 27: North America Value Share and BPS Analysis by Material, 2025 and 2035
  • Figure 28: North America Y-o-Y Growth Comparison by Material, 2025-2035
  • Figure 29: North America Attractiveness Analysis by Material
  • Figure 30: North America Value Share and BPS Analysis by Product Type, 2025 and 2035
  • Figure 31: North America Y-o-Y Growth Comparison by Product Type, 2025-2035
  • Figure 32: North America Attractiveness Analysis by Product Type
  • Figure 33: Latin America Value Share and BPS Analysis by Country, 2025 and 2035
  • Figure 34: Latin America Value Share and BPS Analysis by Basis Weight, 2025 and 2035
  • Figure 35: Latin America Y-o-Y Growth Comparison by Basis Weight, 2025-2035
  • Figure 36: Latin America Attractiveness Analysis by Basis Weight
  • Figure 37: Latin America Value Share and BPS Analysis by Material, 2025 and 2035
  • Figure 38: Latin America Y-o-Y Growth Comparison by Material, 2025-2035
  • Figure 39: Latin America Attractiveness Analysis by Material
  • Figure 40: Latin America Value Share and BPS Analysis by Product Type, 2025 and 2035
  • Figure 41: Latin America Y-o-Y Growth Comparison by Product Type, 2025-2035
  • Figure 42: Latin America Attractiveness Analysis by Product Type
  • Figure 43: Europe Value Share and BPS Analysis by Country, 2025 and 2035
  • Figure 44: Europe Value Share and BPS Analysis by Basis Weight, 2025 and 2035
  • Figure 45: Europe Y-o-Y Growth Comparison by Basis Weight, 2025-2035
  • Figure 46: Europe Attractiveness Analysis by Basis Weight
  • Figure 47: Europe Value Share and BPS Analysis by Material, 2025 and 2035
  • Figure 48: Europe Y-o-Y Growth Comparison by Material, 2025-2035
  • Figure 49: Europe Attractiveness Analysis by Material
  • Figure 50: Europe Value Share and BPS Analysis by Product Type, 2025 and 2035
  • Figure 51: Europe Y-o-Y Growth Comparison by Product Type, 2025-2035
  • Figure 52: Europe Attractiveness Analysis by Product Type
  • Figure 53: East Asia Value Share and BPS Analysis by Country, 2025 and 2035
  • Figure 54: East Asia Value Share and BPS Analysis by Basis Weight, 2025 and 2035
  • Figure 55: East Asia Y-o-Y Growth Comparison by Basis Weight, 2025-2035
  • Figure 56: East Asia Attractiveness Analysis by Basis Weight
  • Figure 57: East Asia Value Share and BPS Analysis by Material, 2025 and 2035
  • Figure 58: East Asia Y-o-Y Growth Comparison by Material, 2025-2035
  • Figure 59: East Asia Attractiveness Analysis by Material
  • Figure 60: East Asia Value Share and BPS Analysis by Product Type, 2025 and 2035
  • Figure 61: East Asia Y-o-Y Growth Comparison by Product Type, 2025-2035
  • Figure 62: East Asia Attractiveness Analysis by Product Type
  • Figure 63: South Asia Value Share and BPS Analysis by Country, 2025 and 2035
  • Figure 64: South Asia Value Share and BPS Analysis by Basis Weight, 2025 and 2035
  • Figure 65: South Asia Y-o-Y Growth Comparison by Basis Weight, 2025-2035
  • Figure 66: South Asia Attractiveness Analysis by Basis Weight
  • Figure 67: South Asia Value Share and BPS Analysis by Material, 2025 and 2035
  • Figure 68: South Asia Y-o-Y Growth Comparison by Material, 2025-2035
  • Figure 69: South Asia Attractiveness Analysis by Material
  • Figure 70: South Asia Value Share and BPS Analysis by Product Type, 2025 and 2035
  • Figure 71: South Asia Y-o-Y Growth Comparison by Product Type, 2025-2035
  • Figure 72: South Asia Attractiveness Analysis by Product Type
  • Figure 73: Oceania Value Share and BPS Analysis by Country, 2025 and 2035
  • Figure 74: Oceania Value Share and BPS Analysis by Basis Weight, 2025 and 2035
  • Figure 75: Oceania Y-o-Y Growth Comparison by Basis Weight, 2025-2035
  • Figure 76: Oceania Attractiveness Analysis by Basis Weight
  • Figure 77: Oceania Value Share and BPS Analysis by Material, 2025 and 2035
  • Figure 78: Oceania Y-o-Y Growth Comparison by Material, 2025-2035
  • Figure 79: Oceania Attractiveness Analysis by Material
  • Figure 80: Oceania Value Share and BPS Analysis by Product Type, 2025 and 2035
  • Figure 81: Oceania Y-o-Y Growth Comparison by Product Type, 2025-2035
  • Figure 82: Oceania Attractiveness Analysis by Product Type
  • Figure 83: MEA Value Share and BPS Analysis by Country, 2025 and 2035
  • Figure 84: MEA Value Share and BPS Analysis by Basis Weight, 2025 and 2035
  • Figure 85: MEA Y-o-Y Growth Comparison by Basis Weight, 2025-2035
  • Figure 86: MEA Attractiveness Analysis by Basis Weight
  • Figure 87: MEA Value Share and BPS Analysis by Material, 2025 and 2035
  • Figure 88: MEA Y-o-Y Growth Comparison by Material, 2025-2035
  • Figure 89: MEA Attractiveness Analysis by Material
  • Figure 90: MEA Value Share and BPS Analysis by Product Type, 2025 and 2035
  • Figure 91: MEA Y-o-Y Growth Comparison by Product Type, 2025-2035
  • Figure 92: MEA Attractiveness Analysis by Product Type
  • Figure 93: Global - Tier Structure Analysis
  • Figure 94: Global - Company Share Analysis

Frequently Asked Questions

What was the overall size of the vegetable parchment paper market in 2025?

The overall market size for the vegetable parchment paper market was approximately USD 1.3 billion in 2025.

How big is the vegetable parchment paper market expected to be in 2035?

The vegetable parchment paper market is expected to reach approximately USD 2.5 billion by 2035.

What will drive the demand for the vegetable parchment paper market during the forecast period?

The demand for vegetable parchment paper is rising due to increasing consumer preference for sustainable and biodegradable packaging solutions, especially in the food industry. The growing popularity of home baking and the need for grease-resistant, heat-resistant, and non-stick packaging materials are further fueling market growth.

List the top 5 countries contributing to the vegetable parchment paper market.

The top 5 countries driving the development of the vegetable parchment paper market are the United States, China, Germany, India, and Japan.

Which segment in the product type and application is expected to lead in the vegetable parchment paper market?

Unbleached parchment and bakery applications are expected to command significant shares over the assessment period.

Explore Similar Insights

Future Market Insights

Vegetable Parchment Paper Market