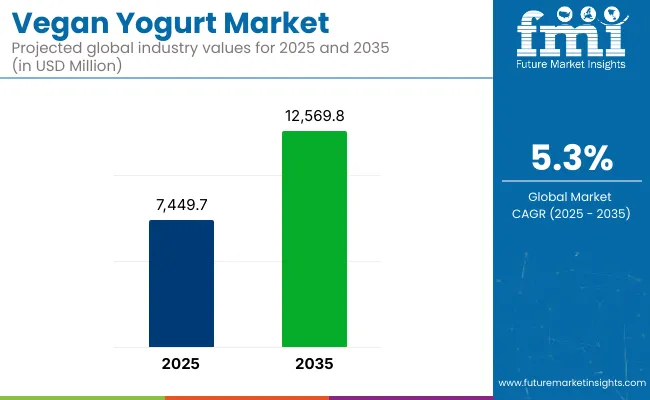
The vegan yogurt market is set to thrive at an average CAGR of 5.8% during the forecast period. The market holds a share of US$ 6.7 billion in 2023 while it is anticipated to cross a value of US$ 11.7 billion by 2033.
The research report on the vegan yogurt market explains that the flourishing vegan movement in the North American and Asian countries is a leading cause of vegan products’ success. Vegan yogurt is one of the vegan products with great household penetration. This is due to the health benefits and high nutritional value it carries. Furthermore, the advanced flavor with organic substances is expanding the sales of vegan yogurt. The advanced active and inactive cultures are loaded within the yogurt with probiotics, along with beneficial gut bacteria, making it super healthy for gut health and digestion.
A huge population of people opt for healthy lifestyles and avoid exploiting animals to source their consumables, flourishing the demand for vegan alternatives to dairy products. Companies experimenting with different levels of probiotic bacteria, along with the rich protein and fiber levels, are attracting end-users. New plant-based companies with experiments with yogurt and other material, such as coconut, soy, cashew, oat, and almond milk. The shrinking price gap between regular yogurt and vegan yogurt is fueling the sales of vegan yogurt globally.
The vegan yogurt market outlook explains that the growth is attributable to the high nutrient content in vegan yogurt, along with growing awareness of its rich nutritional values, such as vitamins, minerals, amino acids, and essential fats that help maintain healthy skin and hair. Vegan yogurt also helps in maintaining metabolism among consumers and aids in weight loss. Vegan yogurt with highly advanced packaging is also fueling the component markets, such as tubs, lids, and packaging. The key driving factors are listed below:
Attributes | Details |
---|---|
Vegan Yogurt Market CAGR (2023 to 2033) | 5.8% |
Vegan Yogurt Market Size (2023) | US$ 6.7 billion |
Vegan Yogurt Market Size (2033) | US$ 11.7 billion |
Don't pay for what you don't need
Customize your report by selecting specific countries or regions and save 30%!
The global vegan yogurt market registered a comparatively lower CAGR of 4.3% from 2017 to 2022. Shifting preference from dairy-based products to dairy-free products due to a high incidence of lactose intolerance fueled the sales of vegan yogurt during the short-term growth period.
Increasing expenditure on plant-based foods in North America and Europe is expected to drive the market over the assessment period. In addition to this, growing rates of milk allergies among teenagers and children are spurring the demand for plant-based food products, especially vegan yogurt. The market is likely to grow steadily between 2023 and 2028.
Vegan yogurt offers functional benefits, such as maintaining blood sugar levels, reducing cholesterol, and resolving gastrointestinal issues. Driven by these factors, the demand for vegan yogurt is expected to remain high in the forthcoming years. The vegan yogurt market is anticipated to thrive at a CAGR of 5.8% between 2023 and 2033.
Consumers across the world are unsure about the nutritional and processing characteristics that make a product vegan. As a result, the availability of non-dairy milk, cheese, and yogurt substitutes has caused confusion among consumers, who frequently mistake the nutritional value of vegan products for that of dairy counterparts.
Regulatory agencies have stepped in to address some of these concerns. The United States Food and Drug Administration (FDA), for example, is looking into the identity guidelines for using dairy names for non-dairy goods. The regulatory agency has issued a request for information to gather information on how consumers use dairy replacements and how they interpret the term vegan in this context.
Similarly, the European Union in 2019 defined the concept of vegan food, laying the way for any product to be labeled as vegan. With this definition, the EU hopes to educate customers, as well as establish adequate criteria for businesses that produce vegan foods and beverages. Developing enterprises and established industry players can use the data to optimize their plans for tapping into the growing vegan products market.
Regions | Absolute Market Growth |
---|---|
United States | US$ 328.8 billion |
United Kingdom | US$ 43.4 million |
China | US$ 2.7 billion |
Japan | US$ 95 million |
India | US$ 401.1 million |
The Rising Incidence of Lactose Intolerance is Spurring Demand for Dairy-free Yogurt
Region | Details |
---|---|
United States Market CAGR (2023 to 2033) | 5.4% |
United States Market Absolute Doller Growth (US$ million/billion) | US$ 328.8 billion |
The United States vegan yogurt market is flourishing at a CAGR of 5.4% between 2023 and 2033, while reaching a value of 803.6 million by 2033.
The United States is expected to dominate the North America vegan yogurt market owing to increasing expenditure on plant-based foods in the country.
Manufacturers with excellent consumer insights, knowledge, and best-in-class product development competencies are drawing more customers in the country through creative product portfolios and a wide range of flavors.
Growing preference for functional foods in the United States, along with the availability of various vegan yogurts on online sales channels, are expected to continue pushing sales in the market over the assessment period.
Growing Trend of Veganism Boosts Sales of Plant-based Yoghurt in China
Region | Details |
---|---|
Chinese Market CAGR (2023 to 2033) | 6.9% |
Chinese Market Absolute Doller Growth (US$ million/billion) | US$ 2.7 billion |
China thrives at a market-leading CAGR of 6.9% between 2023 and 2033, while it is anticipated to hold a value of US$ 5.6 billion by 2033.
Sales of vegan yogurt are expected to rise at a robust pace in China, owing to the high demand for vegan alternatives to dairy-based products. Increasing preference for nutritious processed foods for a healthy lifestyle is resulting in high expenditure on plant-based foods, which is anticipated to boost sales in the market.
Increasing Adoption of Vegan Greek Yogurt in France is Expected to Fuel Growth
Growing preference among consumers in the country for sustainable food with health advantages is expected to drive sales of vegan yogurt. Furthermore, the country is recognized for its pastries and desserts, making it a popular market for vegan yogurt. According to Green Queen Media, there are nearly 2.6 million vegan consumers in France, which is anticipated to boost the market in the forthcoming years.
Furthermore, consumers in France are looking for healthy and nutritious sweets, which makes vegan yogurt a preferred choice as it is high in probiotics. As a result, demand in the France vegan yogurt market is likely to remain high over the forecast period.
Segment | Top Product |
---|---|
Top Sub-segment | Almond Yogurt |
CAGR (2017 to 2022) | 4.7% |
CAGR (2023 to 2033) | 6.6% |
Segment | Top End Use |
---|---|
Top Sub-segment | Household |
CAGR (2017 to 2022) | 4.3% |
CAGR (2023 to 2033) | 5.7% |
Almond milk is emerging as the most popular non-dairy alternative for making vegan yogurts, due to its highly unsaturated fat content and low cholesterol levels. The segment thrives at a CAGR of 6.6% between 2023 and 2033. Moreover, the presence of polyunsaturated fatty acids helps reduce bad cholesterol.
Furthermore, almond yogurt consumption has been found to improve digestive and ocular health, as well as overall immunity. Almond milk yogurts are high in vitamin E, which supplies 50% of a person's daily vitamin intake, ensuring that the skin remains healthy and beautiful.
As a result, vegan yogurt brands are launching products with almond milk as the primary ingredient, which in turn is driving sales in this segment.
By End Use, the household segment thrived at a CAGR of 5.7% between 2023 and 2033. The growth is attributed to the higher consumption on an individual level while veganism penetrates people’s lives. The growing awareness around animal rights and exploitation is turning people into vegans. This expands the sales of vegan yogurt through households.
Get the data you need at a Fraction of the cost
Personalize your report by choosing insights you need
and save 40%!
The global vegan yogurt market is highly fragmented, and the leading players are launching high-quality, nutrient-dense products to the market. Furthermore, rising demand has prompted players to expand their production capacity, allowing them to cater to a wider range of tastes and preferences while maintaining nutritional value. Some recent developments include
Market Developments
The increasing popularity of plant-based diets in China is driving the growth of the vegan yogurt market in the region.
The rising awareness about the health benefits of vegan yogurt is driving the growth of the market in Europe, particularly in Germany.
The booming health and wellness industry is driving the adoption of vegan yogurt services globally.
The United States held 25% of the global market share in 2022.
The Asia Pacific region is expected to witness a CAGR of 10% through 2033.
1. Executive Summary | Vegan Yogurt Market
1.1. Global Market Outlook
1.2. Demand-side Trends
1.3. Supply-side Trends
1.4. Technology Roadmap Analysis
1.5. Analysis and Recommendations
2. Market Overview
2.1. Market Coverage / Taxonomy
2.2. Market Definition / Scope / Limitations
3. Market Background
3.1. Market Dynamics
3.1.1. Drivers
3.1.2. Restraints
3.1.3. Opportunity
3.1.4. Trends
3.2. Scenario Forecast
3.2.1. Demand in Optimistic Scenario
3.2.2. Demand in Likely Scenario
3.2.3. Demand in Conservative Scenario
3.3. Opportunity Map Analysis
3.4. Product Life Cycle Analysis
3.5. Supply Chain Analysis
3.5.1. Supply Side Participants and their Roles
3.5.1.1. Producers
3.5.1.2. Mid-Level Participants (Traders/ Agents/ Brokers)
3.5.1.3. Wholesalers and Distributors
3.5.2. Value Added and Value Created at Node in the Supply Chain
3.5.3. List of Raw Material Suppliers
3.5.4. List of Existing and Potential Buyer’s
3.6. Investment Feasibility Matrix
3.7. Value Chain Analysis
3.7.1. Profit Margin Analysis
3.7.2. Wholesalers and Distributors
3.7.3. Retailers
3.8. PESTLE and Porter’s Analysis
3.9. Regulatory Landscape
3.9.1. By Key Regions
3.9.2. By Key Countries
3.10. Regional Parent Market Outlook
3.11. Production and Consumption Statistics
3.12. Import and Export Statistics
4. Global Market Analysis 2017 to 2022 and Forecast, 2023 to 2033
4.1. Historical Market Size Value (US$ Million) & Volume (Metric Tons) Analysis, 2017 to 2022
4.2. Current and Future Market Size Value (US$ Million) & Volume (Metric Tons) Projections, 2023 to 2033
4.2.1. Y-o-Y Growth Trend Analysis
4.2.2. Absolute $ Opportunity Analysis
5. Global Market Analysis 2017 to 2022 and Forecast 2023 to 2033, By Product Type
5.1. Introduction / Key Findings
5.2. Historical Market Size Value (US$ Million) & Volume (Metric Tons) Analysis By Product Type, 2017 to 2022
5.3. Current and Future Market Size Value (US$ Million) & Volume (Metric Tons) Analysis and Forecast By Product Type, 2023 to 2033
5.3.1. Soy Yogurt
5.3.2. Almond Yogurt
5.3.3. Coconut Yogurt
5.3.4. Others
5.4. Y-o-Y Growth Trend Analysis By Product Type, 2017 to 2022
5.5. Absolute $ Opportunity Analysis By Product Type, 2023 to 2033
6. Global Market Analysis 2017 to 2022 and Forecast 2023 to 2033, By Flavour
6.1. Introduction / Key Findings
6.2. Historical Market Size Value (US$ Million) & Volume (Metric Tons) Analysis By Flavour, 2017 to 2022
6.3. Current and Future Market Size Value (US$ Million) & Volume (Metric Tons) Analysis and Forecast By Flavour, 2023 to 2033
6.3.1. Chocolate
6.3.2. Strawberry
6.3.3. Banana
6.3.4. Pineapple
6.3.5. Mango
6.3.6. Lemonade
6.3.7. Peach
6.4. Y-o-Y Growth Trend Analysis By Flavour, 2017 to 2022
6.5. Absolute $ Opportunity Analysis By Flavour, 2023 to 2033
7. Global Market Analysis 2017 to 2022 and Forecast 2023 to 2033, By End-Use
7.1. Introduction / Key Findings
7.2. Historical Market Size Value (US$ Million) & Volume (Metric Tons) Analysis By End-Use, 2017 to 2022
7.3. Current and Future Market Size Value (US$ Million) & Volume (Metric Tons) Analysis and Forecast By End-Use, 2023 to 2033
7.3.1. HORECA
7.3.2. Household
7.4. Y-o-Y Growth Trend Analysis By End-Use, 2017 to 2022
7.5. Absolute $ Opportunity Analysis By End-Use, 2023 to 2033
8. Global Market Analysis 2017 to 2022 and Forecast 2023 to 2033, By Sales Channel
8.1. Introduction / Key Findings
8.2. Historical Market Size Value (US$ Million) & Volume (Metric Tons) Analysis By Sales Channel, 2017 to 2022
8.3. Current and Future Market Size Value (US$ Million) & Volume (Metric Tons) Analysis and Forecast By Sales Channel, 2023 to 2033
8.3.1. Direct Sales
8.3.2. Indirect Sales
8.3.2.1. Modern Trade
8.3.2.2. Convenience Stores
8.3.2.3. Specialty Stores
8.3.2.4. E-Retailers
8.3.2.5. Other Retail Format
8.4. Y-o-Y Growth Trend Analysis By Sales Channel, 2017 to 2022
8.5. Absolute $ Opportunity Analysis By Sales Channel, 2023 to 2033
9. Global Market Analysis 2017 to 2022 and Forecast 2023 to 2033, By Region
9.1. Introduction
9.2. Historical Market Size Value (US$ Million) & Volume (Metric Tons) Analysis By Region, 2017 to 2022
9.3. Current Market Size Value (US$ Million) & Volume (Metric Tons) Analysis and Forecast By Region, 2023 to 2033
9.3.1. North America
9.3.2. Latin America
9.3.3. Western Europe
9.3.4. Eastern Europe
9.3.5. Asia Pacific Excluding Japan
9.3.6. Japan
9.3.7. Middle East and Africa
9.4. Market Attractiveness Analysis By Region
10. North America Market Analysis 2017 to 2022 and Forecast 2023 to 2033, By Country
10.1. Historical Market Size Value (US$ Million) & Volume (Metric Tons) Trend Analysis By Market Taxonomy, 2017 to 2022
10.2. Market Size Value (US$ Million) & Volume (Metric Tons) Forecast By Market Taxonomy, 2023 to 2033
10.2.1. By Country
10.2.1.1. USA
10.2.1.2. Canada
10.2.2. By Product Type
10.2.3. By Flavour
10.2.4. By End-Use
10.2.5. By Sales Channel
10.3. Market Attractiveness Analysis
10.3.1. By Country
10.3.2. By Product Type
10.3.3. By Flavour
10.3.4. By End-Use
10.3.5. By Sales Channel
10.4. Key Takeaways
11. Latin America Market Analysis 2017 to 2022 and Forecast 2023 to 2033, By Country
11.1. Historical Market Size Value (US$ Million) & Volume (Metric Tons) Trend Analysis By Market Taxonomy, 2017 to 2022
11.2. Market Size Value (US$ Million) & Volume (Metric Tons) Forecast By Market Taxonomy, 2023 to 2033
11.2.1. By Country
11.2.1.1. Brazil
11.2.1.2. Mexico
11.2.1.3. Rest of Latin America
11.2.2. By Product Type
11.2.3. By Flavour
11.2.4. By End-Use
11.2.5. By Sales Channel
11.3. Market Attractiveness Analysis
11.3.1. By Country
11.3.2. By Product Type
11.3.3. By Flavour
11.3.4. By End-Use
11.3.5. By Sales Channel
11.4. Key Takeaways
12. Western EuropeVegan Yogurt Market Analysis 2017 to 2022 and Forecast 2023 to 2033, By Country
12.1. Historical Market Size Value (US$ Million) & Volume (Metric Tons) Trend Analysis By Market Taxonomy, 2017 to 2022
12.2. Market Size Value (US$ Million) & Volume (Metric Tons) Forecast By Market Taxonomy, 2023 to 2033
12.2.1. By Country
12.2.1.1. Germany
12.2.1.2. France
12.2.1.3. United kingdom
12.2.1.4. Spain
12.2.1.5. Italy
12.2.1.6. Rest of Western Europe
12.2.2. By Product Type
12.2.3. By Flavour
12.2.4. By End-Use
12.2.5. By Sales Channel
12.3. Market Attractiveness Analysis
12.3.1. By Country
12.3.2. By Product Type
12.3.3. By Flavour
12.3.4. By End-Use
12.3.5. By Sales Channel
12.4. Key Takeaways
13. Eastern Europe Market Analysis 2017 to 2022 and Forecast 2023 to 2033, By Country
13.1. Historical Market Size Value (US$ Million) & Volume (Metric Tons) Trend Analysis By Market Taxonomy, 2017 to 2022
13.2. Market Size Value (US$ Million) & Volume (Metric Tons) Forecast By Market Taxonomy, 2023 to 2033
13.2.1. By Country
13.2.1.1. Russia
13.2.1.2. Poland
13.2.1.3. Rest of Eastern Europe
13.2.2. By Product Type
13.2.3. By Flavour
13.2.4. By End-Use
13.2.5. By Sales Channel
13.3. Market Attractiveness Analysis
13.3.1. By Country
13.3.2. By Product Type
13.3.3. By Flavour
13.3.4. By End-Use
13.3.5. By Sales Channel
13.4. Key Takeaways
14. Asia Pacific Excluding Japan Market Analysis 2017 to 2022 and Forecast 2023 to 2033, By Country
14.1. Historical Market Size Value (US$ Million) & Volume (Metric Tons) Trend Analysis By Market Taxonomy, 2017 to 2022
14.2. Market Size Value (US$ Million) & Volume (Metric Tons) Forecast By Market Taxonomy, 2023 to 2033
14.2.1. By Country
14.2.1.1. China
14.2.1.2. India
14.2.1.3. Australia and New Zealand
14.2.1.4. ASEAN
14.2.1.5. Rest of Asia Pacific Excluding Japan
14.2.2. By Product Type
14.2.3. By Flavour
14.2.4. By End-Use
14.2.5. By Sales Channel
14.3. Market Attractiveness Analysis
14.3.1. By Country
14.3.2. By Product Type
14.3.3. By Flavour
14.3.4. By End-Use
14.3.5. By Sales Channel
14.4. Key Takeaways
15. Japan Market Analysis 2017 to 2022 and Forecast 2023 to 2033, By Country
15.1. Historical Market Size Value (US$ Million) & Volume (Metric Tons) Trend Analysis By Market Taxonomy, 2017 to 2022
15.2. Market Size Value (US$ Million) & Volume (Metric Tons) Forecast By Market Taxonomy, 2023 to 2033
15.2.1. By Country
15.2.2. By Product Type
15.2.3. By Flavour
15.2.4. By End-Use
15.2.5. By Sales Channel
15.3. Market Attractiveness Analysis
15.3.1. By Country
15.3.2. By Product Type
15.3.3. By Flavour
15.3.4. By End-Use
15.3.5. By Sales Channel
15.4. Key Takeaways
16. Middle East and Africa Market Analysis 2017 to 2022 and Forecast 2023 to 2033, By Country
16.1. Historical Market Size Value (US$ Million) & Volume (Metric Tons) Trend Analysis By Market Taxonomy, 2017 to 2022
16.2. Market Size Value (US$ Million) & Volume (Metric Tons) Forecast By Market Taxonomy, 2023 to 2033
16.2.1. By Country
16.2.1.1. GCC Countries
16.2.1.2. South Africa
16.2.1.3. Rest of Middle East and Africa
16.2.2. By Product Type
16.2.3. By Flavour
16.2.4. By End-Use
16.2.5. By Sales Channel
16.3. Market Attractiveness Analysis
16.3.1. By Country
16.3.2. By Product Type
16.3.3. By Flavour
16.3.4. By End-Use
16.3.5. By Sales Channel
16.4. Key Takeaways
17. Key Countries Market Analysis
17.1. USA
17.1.1. Pricing Analysis
17.1.2. Market Share Analysis, 2022
17.1.2.1. By Product Type
17.1.2.2. By Flavour
17.1.2.3. By End-Use
17.1.2.4. By Sales Channel
17.2. Canada
17.2.1. Pricing Analysis
17.2.2. Market Share Analysis, 2022
17.2.2.1. By Product Type
17.2.2.2. By Flavour
17.2.2.3. By End-Use
17.2.2.4. By Sales Channel
17.3. Brazil
17.3.1. Pricing Analysis
17.3.2. Market Share Analysis, 2022
17.3.2.1. By Product Type
17.3.2.2. By Flavour
17.3.2.3. By End-Use
17.3.2.4. By Sales Channel
17.4. Mexico
17.4.1. Pricing Analysis
17.4.2. Market Share Analysis, 2022
17.4.2.1. By Product Type
17.4.2.2. By Flavour
17.4.2.3. By End-Use
17.4.2.4. By Sales Channel
17.5. Germany
17.5.1. Pricing Analysis
17.5.2. Market Share Analysis, 2022
17.5.2.1. By Product Type
17.5.2.2. By Flavour
17.5.2.3. By End-Use
17.5.2.4. By Sales Channel
17.6. France
17.6.1. Pricing Analysis
17.6.2. Market Share Analysis, 2022
17.6.2.1. By Product Type
17.6.2.2. By Flavour
17.6.2.3. By End-Use
17.6.2.4. By Sales Channel
17.7. United kingdom
17.7.1. Pricing Analysis
17.7.2. Market Share Analysis, 2022
17.7.2.1. By Product Type
17.7.2.2. By Flavour
17.7.2.3. By End-Use
17.7.2.4. By Sales Channel
17.8. Spain
17.8.1. Pricing Analysis
17.8.2. Market Share Analysis, 2022
17.8.2.1. By Product Type
17.8.2.2. By Flavour
17.8.2.3. By End-Use
17.8.2.4. By Sales Channel
17.9. Italy
17.9.1. Pricing Analysis
17.9.2. Market Share Analysis, 2022
17.9.2.1. By Product Type
17.9.2.2. By Flavour
17.9.2.3. By End-Use
17.9.2.4. By Sales Channel
17.10. Russia
17.10.1. Pricing Analysis
17.10.2. Market Share Analysis, 2022
17.10.2.1. By Product Type
17.10.2.2. By Flavour
17.10.2.3. By End-Use
17.10.2.4. By Sales Channel
17.11. Poland
17.11.1. Pricing Analysis
17.11.2. Market Share Analysis, 2022
17.11.2.1. By Product Type
17.11.2.2. By Flavour
17.11.2.3. By End-Use
17.11.2.4. By Sales Channel
17.12. China
17.12.1. Pricing Analysis
17.12.2. Market Share Analysis, 2022
17.12.2.1. By Product Type
17.12.2.2. By Flavour
17.12.2.3. By End-Use
17.12.2.4. By Sales Channel
17.13. India
17.13.1. Pricing Analysis
17.13.2. Market Share Analysis, 2022
17.13.2.1. By Product Type
17.13.2.2. By Flavour
17.13.2.3. By End-Use
17.13.2.4. By Sales Channel
17.14. Australia and New Zealand
17.14.1. Pricing Analysis
17.14.2. Market Share Analysis, 2022
17.14.2.1. By Product Type
17.14.2.2. By Flavour
17.14.2.3. By End-Use
17.14.2.4. By Sales Channel
17.15. ASEAN
17.15.1. Pricing Analysis
17.15.2. Market Share Analysis, 2022
17.15.2.1. By Product Type
17.15.2.2. By Flavour
17.15.2.3. By End-Use
17.15.2.4. By Sales Channel
17.16. Japan
17.16.1. Pricing Analysis
17.16.2. Market Share Analysis, 2022
17.16.2.1. By Product Type
17.16.2.2. By Flavour
17.16.2.3. By End-Use
17.16.2.4. By Sales Channel
17.17. GCC Countries
17.17.1. Pricing Analysis
17.17.2. Market Share Analysis, 2022
17.17.2.1. By Product Type
17.17.2.2. By Flavour
17.17.2.3. By End-Use
17.17.2.4. By Sales Channel
17.18. South Africa
17.18.1. Pricing Analysis
17.18.2. Market Share Analysis, 2022
17.18.2.1. By Product Type
17.18.2.2. By Flavour
17.18.2.3. By End-Use
17.18.2.4. By Sales Channel
18. Market Structure Analysis
18.1. Competition Dashboard
18.2. Competition Benchmarking
18.3. Market Share Analysis of Top Players
18.3.1. By Regional
18.3.2. By Product Type
18.3.3. By Flavour
18.3.4. By End-Use
18.3.5. By Sales Channel
19. Competition Analysis
19.1. Competition Deep Dive
19.1.1. Hain Celestial
19.1.1.1. Overview
19.1.1.2. Product Portfolio
19.1.1.3. Profitability by Market Segments
19.1.1.4. Sales Footprint
19.1.1.5. Strategy Overview
19.1.1.5.1. Marketing Strategy
19.1.1.5.2. Product Strategy
19.1.1.5.3. Channel Strategy
19.1.2. General Mills Inc.
19.1.2.1. Overview
19.1.2.2. Product Portfolio
19.1.2.3. Profitability by Market Segments
19.1.2.4. Sales Footprint
19.1.2.5. Strategy Overview
19.1.2.5.1. Marketing Strategy
19.1.2.5.2. Product Strategy
19.1.2.5.3. Channel Strategy
19.1.3. Danone
19.1.3.1. Overview
19.1.3.2. Product Portfolio
19.1.3.3. Profitability by Market Segments
19.1.3.4. Sales Footprint
19.1.3.5. Strategy Overview
19.1.3.5.1. Marketing Strategy
19.1.3.5.2. Product Strategy
19.1.3.5.3. Channel Strategy
19.1.4. Stonyfield Farm, Inc.
19.1.4.1. Overview
19.1.4.2. Product Portfolio
19.1.4.3. Profitability by Market Segments
19.1.4.4. Sales Footprint
19.1.4.5. Strategy Overview
19.1.4.5.1. Marketing Strategy
19.1.4.5.2. Product Strategy
19.1.4.5.3. Channel Strategy
19.1.5. KaTech
19.1.5.1. Overview
19.1.5.2. Product Portfolio
19.1.5.3. Profitability by Market Segments
19.1.5.4. Sales Footprint
19.1.5.5. Strategy Overview
19.1.5.5.1. Marketing Strategy
19.1.5.5.2. Product Strategy
19.1.5.5.3. Channel Strategy
19.1.6. Epigamia
19.1.6.1. Overview
19.1.6.2. Product Portfolio
19.1.6.3. Profitability by Market Segments
19.1.6.4. Sales Footprint
19.1.6.5. Strategy Overview
19.1.6.5.1. Marketing Strategy
19.1.6.5.2. Product Strategy
19.1.6.5.3. Channel Strategy
19.1.7. NANCY'S
19.1.7.1. Overview
19.1.7.2. Product Portfolio
19.1.7.3. Profitability by Market Segments
19.1.7.4. Sales Footprint
19.1.7.5. Strategy Overview
19.1.7.5.1. Marketing Strategy
19.1.7.5.2. Product Strategy
19.1.7.5.3. Channel Strategy
19.1.8. Daiya Foods Inc
19.1.8.1. Overview
19.1.8.2. Product Portfolio
19.1.8.3. Profitability by Market Segments
19.1.8.4. Sales Footprint
19.1.8.5. Strategy Overview
19.1.8.5.1. Marketing Strategy
19.1.8.5.2. Product Strategy
19.1.8.5.3. Channel Strategy
19.1.9. Kite Hill
19.1.9.1. Overview
19.1.9.2. Product Portfolio
19.1.9.3. Profitability by Market Segments
19.1.9.4. Sales Footprint
19.1.9.5. Strategy Overview
19.1.9.5.1. Marketing Strategy
19.1.9.5.2. Product Strategy
19.1.9.5.3. Channel Strategy
19.1.10. Chobani, LLC
19.1.10.1. Overview
19.1.10.2. Product Portfolio
19.1.10.3. Profitability by Market Segments
19.1.10.4. Sales Footprint
19.1.10.5. Strategy Overview
19.1.10.5.1. Marketing Strategy
19.1.10.5.2. Product Strategy
19.1.10.5.3. Channel Strategy
19.1.11. COYO Pty Ltd.
19.1.11.1. Overview
19.1.11.2. Product Portfolio
19.1.11.3. Profitability by Market Segments
19.1.11.4. Sales Footprint
19.1.11.5. Strategy Overview
19.1.11.5.1. Marketing Strategy
19.1.11.5.2. Product Strategy
19.1.11.5.3. Channel Strategy
20. Assumptions & Acronyms Used
21. Research Methodology
Explore Food and Beverage Insights
View Reports