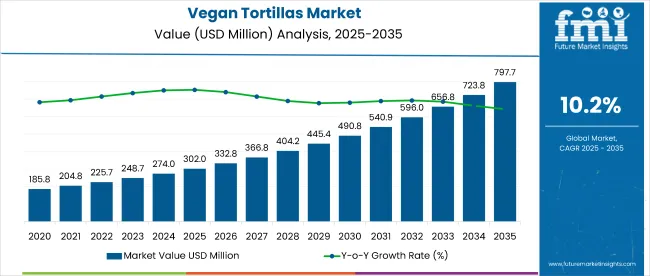
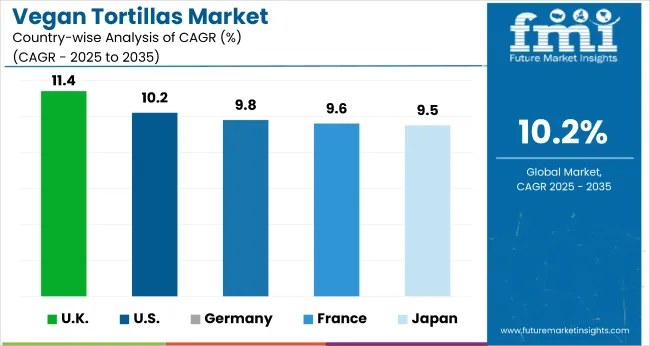
The global vegan tortillas market is expected to be valued at USD 249.1 million in 2023 and reach a valuation of USD 599.2 million by 2033. The demand for vegan tortillas is estimated to grow at a steady 10.2% CAGR, with the United Kingdom, the USA, China, and India emerging as key producers.
The vegan tortilla market is seeing a number of trends that are shaping the industry. One trend is the focus on innovations in ingredients, as companies are developing new plant-based ingredients and formulations to improve the taste and texture of vegan tortillas and make them more similar to traditional tortillas. Another trend is the growing demand for gluten-free vegan tortillas, as more and more consumers are following gluten-free diets.
The growth in online sales is also a trend in the vegan tortilla market, as companies are focusing on online sales and e-commerce platforms to increase the reach of their products. Additionally, there is an increase in private label products, where retailers are introducing their own brands to meet the growing demand for vegan tortillas. Companies are also experimenting with different types of plant-based proteins, such as peas, soy, and chickpea, to make vegan tortillas more nutritious.
In the vegan tortilla market, there is also an increase in convenience and ready-to-eat products, as companies are launching ready-to-eat vegan tortilla products for consumers looking for convenience and ease of use. Lastly, companies are focusing on sustainability by using eco-friendly packaging materials and reducing the carbon footprint of their vegan tortilla products. These trends are shaping the industry and are expected to continue in the future.
Attributes | Details |
---|---|
Vegan tortillas Market CAGR (2023 to 2033) | 10.2% |
Vegan tortillas Market Size (2023) | USD 249.1 million |
Vegan tortillas Market Size (2033) | USD 599.2 million |
The global demand for vegan tortillas grew at a CAGR of 10.2% between 2016 and 2022, and it's expected to expand at a CAGR of 10.2% between 2023 and 2033. The growth potential of the market could be looked at from short-term, mid-term, and long-term perspectives.
Short-Term Outlook (2023 to 2025) | The growing trend of Mexican and Tex-Mex cuisine has led to an increase in demand for tortillas, as they are a key ingredient in many dishes like burritos, tacos, and enchiladas. |
---|---|
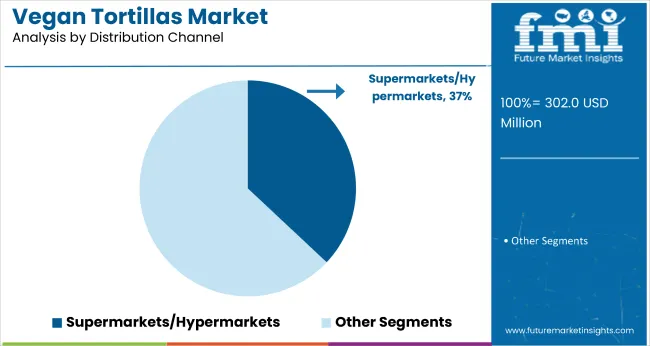
Mid-Term Outlook (2025 to 2028) | The increasing demand for vegan tortillas through various distribution channels such as supermarkets, health food stores, and online platforms is making it more accessible and convenient for consumers to purchase them, thus increasing the sales of vegan tortillas. |
Long-Term Outlook (2028 to 2032) | Consumers are becoming more health-conscious and are shifting their preferences towards organic, non-GMO, and whole-grain tortillas, as they are perceived to be healthier and more sustainable. This is expected to drive the demand for vegan tortillas in the long term. |
Increasing demand for Mexican and Tex-Mex cuisine: The rising popularity of Mexican and Tex-Mex cuisine is driving the demand for tortillas, which are used in a wide range of dishes such as burritos, tacos, and enchiladas.
Convenience and portability: Tortillas are a convenient and portable food option, making them popular among consumers looking for quick and easy meal options.
The growing popularity of street food: The growing popularity of street food, particularly in urban areas, is driving the demand for tortillas as they are commonly used in street food dishes such as tacos and burritos.
Economic factors: The increasing purchasing power of the middle-class population and the availability of tortillas through various distribution channels such as supermarkets and online platforms is making them more accessible and convenient to purchase, which in turn is driving market growth.
Despite the drivers, the vegan tortilla market is being restrained by these two factors:
Limited availability: Vegan tortillas may not be widely available in certain regions, which can limit their market growth.
Limited product options: Limited product options for vegan food and tortillas may limit their market growth, as consumers may be looking for more variety.
One of the main reasons for the popularity of tortillas in the USA is the growing awareness of health and wellness among American consumers. More and more people in the USA are becoming conscious of the benefits of a plant-based diet, as well as the increasing incidence of lifestyle diseases in the country. This is driving the demand for vegan tortillas as a healthier alternative to traditional animal-based products.
Top Companies in the USA Vegan tortillas Industry
CAGR (2023 to 2033) | 11.4% |
---|---|
United Kingdom Vegan tortillas Market Share | 9.3% |
United Kingdom Vegan tortillas Market Valuation (2022) | USD 21 million |
United Kingdom Vegan tortillas Market Valuation (2033) | USD 69 million |
Economic factors are playing a crucial role in the popularity of vegan tortillas in the UK. The vegan market is growing in the UK due to the increase in purchasing power of the middle-class population and the increasing availability of vegan products in supermarkets, health food stores, and online platforms. This is making it more accessible and convenient for consumers to purchase vegan tortillas.
Top Companies in the United Kingdom Vegan tortillas Industry
CAGR (2023 to 2033) | 7.9% |
---|---|
China Vegan tortillas Market Share | 10% |
China Vegan tortillas Market Valuation (2022) | USD 22.62 million |
China Vegan tortillas Market Valuation (2033) | USD 52 million |
Climate change and other environmental concerns are driving people to reduce their meat consumption and look for more plant-based options, vegan tortillas being one of them. The Chinese Government is promoting plant-based diets as a way to address food security and public health concerns, which also helps to drive the demand for vegan tortillas.
Top Companies in the China Vegan tortillas Industry
CAGR (2023 to 2033) | 10.2% |
---|---|
India Vegan tortillas Market Share | 3.9% |
India Vegan tortillas Market Valuation (2022) | USD 8.8 million |
India Vegan tortillas Market Valuation (2033) | USD 25.7 million |
India has a large population of vegetarians, who are increasingly opting for vegan options as a healthier and more ethical alternative to traditional animal-based products. This is leading to a growing demand for vegan tortillas among this population.
The rising popularity of Mexican and Tex-Mex cuisine in India is also driving the demand for vegan tortillas. These cuisines are becoming increasingly popular in India, and vegan tortillas are used in a wide range of dishes such as burritos, tacos, and enchiladas. This is leading to a growing demand for vegan tortillas among Indian consumers who enjoy these cuisines.
Top Companies in the Indian Vegan tortillas Industry
Segment | Product Type |
---|---|
Top Sub-segment | Flour Tortillas |
Market Share | 24.5% |
Segment | Source |
---|---|
Top Sub-segment | Whole Wheat |
Market Share | 40.2% |
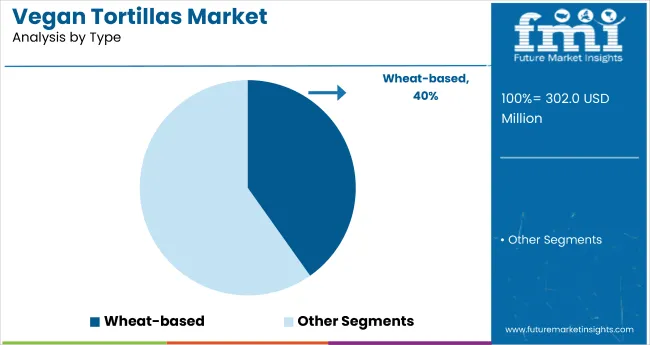
The flour tortillas segment of the market is expected to grow at a moderate pace, with an increasing preference for wheat-based tortillas as a healthier alternative to traditional corn-based tortillas. The increasing popularity of Mexican cuisine and Tex-Mex dishes, which typically use flour tortillas, is also expected to drive the market.
The increasing awareness of the health benefits of wheat-based tortillas, such as being gluten-free and high in fiber, is expected to attract a wider range of consumers, including health-conscious and gluten-sensitive consumers.
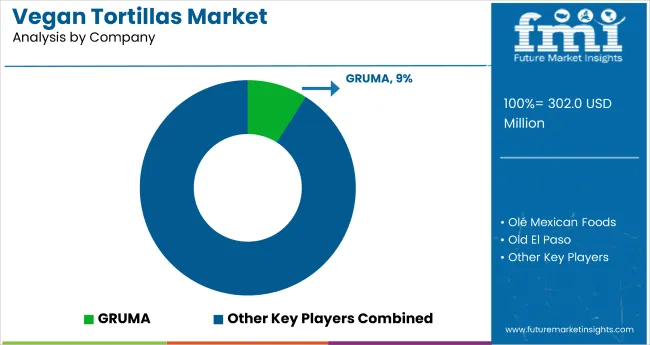
The vegan tortilla market is highly competitive with a large number of players offering a wide range of products. The major players in the market are well-established companies with a strong brand presence and distribution network. These companies have a significant market share and dominate the market with their wide range of products and strong distribution network.
However, the market also has a significant presence of regional and local players who have a strong hold on their specific regions. They may offer a limited range of products but have a loyal customer base due to their traditional and authentic flavors.
Some key strategies followed by companies in the market include:
Table 1: Global Market Value (US$ Million) Forecast by Region, 2018 to 2033
Table 2: Global Market Volume (Tons) Forecast by Region, 2018 to 2033
Table 3: Global Market Value (US$ Million) Forecast by Product Type, 2018 to 2033
Table 4: Global Market Volume (Tons) Forecast by Product Type, 2018 to 2033
Table 5: Global Market Value (US$ Million) Forecast by Source, 2018 to 2033
Table 6: Global Market Volume (Tons) Forecast by Source, 2018 to 2033
Table 7: Global Market Value (US$ Million) Forecast by Million, 2018 to 2033
Table 8: Global Market Volume (Tons) Forecast by Million, 2018 to 2033
Table 9: Global Market Value (US$ Million) Forecast by Distribution Channel, 2018 to 2033
Table 10: Global Market Volume (Tons) Forecast by Distribution Channel, 2018 to 2033
Table 11: North America Market Value (US$ Million) Forecast by Country, 2018 to 2033
Table 12: North America Market Volume (Tons) Forecast by Country, 2018 to 2033
Table 13: North America Market Value (US$ Million) Forecast by Product Type, 2018 to 2033
Table 14: North America Market Volume (Tons) Forecast by Product Type, 2018 to 2033
Table 15: North America Market Value (US$ Million) Forecast by Source, 2018 to 2033
Table 16: North America Market Volume (Tons) Forecast by Source, 2018 to 2033
Table 17: North America Market Value (US$ Million) Forecast by Million, 2018 to 2033
Table 18: North America Market Volume (Tons) Forecast by Million, 2018 to 2033
Table 19: North America Market Value (US$ Million) Forecast by Distribution Channel, 2018 to 2033
Table 20: North America Market Volume (Tons) Forecast by Distribution Channel, 2018 to 2033
Table 21: Latin America Market Value (US$ Million) Forecast by Country, 2018 to 2033
Table 22: Latin America Market Volume (Tons) Forecast by Country, 2018 to 2033
Table 23: Latin America Market Value (US$ Million) Forecast by Product Type, 2018 to 2033
Table 24: Latin America Market Volume (Tons) Forecast by Product Type, 2018 to 2033
Table 25: Latin America Market Value (US$ Million) Forecast by Source, 2018 to 2033
Table 26: Latin America Market Volume (Tons) Forecast by Source, 2018 to 2033
Table 27: Latin America Market Value (US$ Million) Forecast by Million, 2018 to 2033
Table 28: Latin America Market Volume (Tons) Forecast by Million, 2018 to 2033
Table 29: Latin America Market Value (US$ Million) Forecast by Distribution Channel, 2018 to 2033
Table 30: Latin America Market Volume (Tons) Forecast by Distribution Channel, 2018 to 2033
Table 31: Europe Market Value (US$ Million) Forecast by Country, 2018 to 2033
Table 32: Europe Market Volume (Tons) Forecast by Country, 2018 to 2033
Table 33: Europe Market Value (US$ Million) Forecast by Product Type, 2018 to 2033
Table 34: Europe Market Volume (Tons) Forecast by Product Type, 2018 to 2033
Table 35: Europe Market Value (US$ Million) Forecast by Source, 2018 to 2033
Table 36: Europe Market Volume (Tons) Forecast by Source, 2018 to 2033
Table 37: Europe Market Value (US$ Million) Forecast by Million, 2018 to 2033
Table 38: Europe Market Volume (Tons) Forecast by Million, 2018 to 2033
Table 39: Europe Market Value (US$ Million) Forecast by Distribution Channel, 2018 to 2033
Table 40: Europe Market Volume (Tons) Forecast by Distribution Channel, 2018 to 2033
Table 41: Asia Pacific Market Value (US$ Million) Forecast by Country, 2018 to 2033
Table 42: Asia Pacific Market Volume (Tons) Forecast by Country, 2018 to 2033
Table 43: Asia Pacific Market Value (US$ Million) Forecast by Product Type, 2018 to 2033
Table 44: Asia Pacific Market Volume (Tons) Forecast by Product Type, 2018 to 2033
Table 45: Asia Pacific Market Value (US$ Million) Forecast by Source, 2018 to 2033
Table 46: Asia Pacific Market Volume (Tons) Forecast by Source, 2018 to 2033
Table 47: Asia Pacific Market Value (US$ Million) Forecast by Million, 2018 to 2033
Table 48: Asia Pacific Market Volume (Tons) Forecast by Million, 2018 to 2033
Table 49: Asia Pacific Market Value (US$ Million) Forecast by Distribution Channel, 2018 to 2033
Table 50: Asia Pacific Market Volume (Tons) Forecast by Distribution Channel, 2018 to 2033
Table 51: MEA Market Value (US$ Million) Forecast by Country, 2018 to 2033
Table 52: MEA Market Volume (Tons) Forecast by Country, 2018 to 2033
Table 53: MEA Market Value (US$ Million) Forecast by Product Type, 2018 to 2033
Table 54: MEA Market Volume (Tons) Forecast by Product Type, 2018 to 2033
Table 55: MEA Market Value (US$ Million) Forecast by Source, 2018 to 2033
Table 56: MEA Market Volume (Tons) Forecast by Source, 2018 to 2033
Table 57: MEA Market Value (US$ Million) Forecast by Million, 2018 to 2033
Table 58: MEA Market Volume (Tons) Forecast by Million, 2018 to 2033
Table 59: MEA Market Value (US$ Million) Forecast by Distribution Channel, 2018 to 2033
Table 60: MEA Market Volume (Tons) Forecast by Distribution Channel, 2018 to 2033
Figure 1: Global Market Value (US$ Million) by Product Type, 2023 to 2033
Figure 2: Global Market Value (US$ Million) by Source, 2023 to 2033
Figure 3: Global Market Value (US$ Million) by Million, 2023 to 2033
Figure 4: Global Market Value (US$ Million) by Distribution Channel, 2023 to 2033
Figure 5: Global Market Value (US$ Million) by Region, 2023 to 2033
Figure 6: Global Market Value (US$ Million) Analysis by Region, 2018 to 2033
Figure 7: Global Market Volume (Tons) Analysis by Region, 2018 to 2033
Figure 8: Global Market Value Share (%) and BPS Analysis by Region, 2023 to 2033
Figure 9: Global Market Y-o-Y Growth (%) Projections by Region, 2023 to 2033
Figure 10: Global Market Value (US$ Million) Analysis by Product Type, 2018 to 2033
Figure 11: Global Market Volume (Tons) Analysis by Product Type, 2018 to 2033
Figure 12: Global Market Value Share (%) and BPS Analysis by Product Type, 2023 to 2033
Figure 13: Global Market Y-o-Y Growth (%) Projections by Product Type, 2023 to 2033
Figure 14: Global Market Value (US$ Million) Analysis by Source, 2018 to 2033
Figure 15: Global Market Volume (Tons) Analysis by Source, 2018 to 2033
Figure 16: Global Market Value Share (%) and BPS Analysis by Source, 2023 to 2033
Figure 17: Global Market Y-o-Y Growth (%) Projections by Source, 2023 to 2033
Figure 18: Global Market Value (US$ Million) Analysis by Million, 2018 to 2033
Figure 19: Global Market Volume (Tons) Analysis by Million, 2018 to 2033
Figure 20: Global Market Value Share (%) and BPS Analysis by Million, 2023 to 2033
Figure 21: Global Market Y-o-Y Growth (%) Projections by Million, 2023 to 2033
Figure 22: Global Market Value (US$ Million) Analysis by Distribution Channel, 2018 to 2033
Figure 23: Global Market Volume (Tons) Analysis by Distribution Channel, 2018 to 2033
Figure 24: Global Market Value Share (%) and BPS Analysis by Distribution Channel, 2023 to 2033
Figure 25: Global Market Y-o-Y Growth (%) Projections by Distribution Channel, 2023 to 2033
Figure 26: Global Market Attractiveness by Product Type, 2023 to 2033
Figure 27: Global Market Attractiveness by Source, 2023 to 2033
Figure 28: Global Market Attractiveness by Million, 2023 to 2033
Figure 29: Global Market Attractiveness by Distribution Channel, 2023 to 2033
Figure 30: Global Market Attractiveness by Region, 2023 to 2033
Figure 31: North America Market Value (US$ Million) by Product Type, 2023 to 2033
Figure 32: North America Market Value (US$ Million) by Source, 2023 to 2033
Figure 33: North America Market Value (US$ Million) by Million, 2023 to 2033
Figure 34: North America Market Value (US$ Million) by Distribution Channel, 2023 to 2033
Figure 35: North America Market Value (US$ Million) by Country, 2023 to 2033
Figure 36: North America Market Value (US$ Million) Analysis by Country, 2018 to 2033
Figure 37: North America Market Volume (Tons) Analysis by Country, 2018 to 2033
Figure 38: North America Market Value Share (%) and BPS Analysis by Country, 2023 to 2033
Figure 39: North America Market Y-o-Y Growth (%) Projections by Country, 2023 to 2033
Figure 40: North America Market Value (US$ Million) Analysis by Product Type, 2018 to 2033
Figure 41: North America Market Volume (Tons) Analysis by Product Type, 2018 to 2033
Figure 42: North America Market Value Share (%) and BPS Analysis by Product Type, 2023 to 2033
Figure 43: North America Market Y-o-Y Growth (%) Projections by Product Type, 2023 to 2033
Figure 44: North America Market Value (US$ Million) Analysis by Source, 2018 to 2033
Figure 45: North America Market Volume (Tons) Analysis by Source, 2018 to 2033
Figure 46: North America Market Value Share (%) and BPS Analysis by Source, 2023 to 2033
Figure 47: North America Market Y-o-Y Growth (%) Projections by Source, 2023 to 2033
Figure 48: North America Market Value (US$ Million) Analysis by Million, 2018 to 2033
Figure 49: North America Market Volume (Tons) Analysis by Million, 2018 to 2033
Figure 50: North America Market Value Share (%) and BPS Analysis by Million, 2023 to 2033
Figure 51: North America Market Y-o-Y Growth (%) Projections by Million, 2023 to 2033
Figure 52: North America Market Value (US$ Million) Analysis by Distribution Channel, 2018 to 2033
Figure 53: North America Market Volume (Tons) Analysis by Distribution Channel, 2018 to 2033
Figure 54: North America Market Value Share (%) and BPS Analysis by Distribution Channel, 2023 to 2033
Figure 55: North America Market Y-o-Y Growth (%) Projections by Distribution Channel, 2023 to 2033
Figure 56: North America Market Attractiveness by Product Type, 2023 to 2033
Figure 57: North America Market Attractiveness by Source, 2023 to 2033
Figure 58: North America Market Attractiveness by Million, 2023 to 2033
Figure 59: North America Market Attractiveness by Distribution Channel, 2023 to 2033
Figure 60: North America Market Attractiveness by Country, 2023 to 2033
Figure 61: Latin America Market Value (US$ Million) by Product Type, 2023 to 2033
Figure 62: Latin America Market Value (US$ Million) by Source, 2023 to 2033
Figure 63: Latin America Market Value (US$ Million) by Million, 2023 to 2033
Figure 64: Latin America Market Value (US$ Million) by Distribution Channel, 2023 to 2033
Figure 65: Latin America Market Value (US$ Million) by Country, 2023 to 2033
Figure 66: Latin America Market Value (US$ Million) Analysis by Country, 2018 to 2033
Figure 67: Latin America Market Volume (Tons) Analysis by Country, 2018 to 2033
Figure 68: Latin America Market Value Share (%) and BPS Analysis by Country, 2023 to 2033
Figure 69: Latin America Market Y-o-Y Growth (%) Projections by Country, 2023 to 2033
Figure 70: Latin America Market Value (US$ Million) Analysis by Product Type, 2018 to 2033
Figure 71: Latin America Market Volume (Tons) Analysis by Product Type, 2018 to 2033
Figure 72: Latin America Market Value Share (%) and BPS Analysis by Product Type, 2023 to 2033
Figure 73: Latin America Market Y-o-Y Growth (%) Projections by Product Type, 2023 to 2033
Figure 74: Latin America Market Value (US$ Million) Analysis by Source, 2018 to 2033
Figure 75: Latin America Market Volume (Tons) Analysis by Source, 2018 to 2033
Figure 76: Latin America Market Value Share (%) and BPS Analysis by Source, 2023 to 2033
Figure 77: Latin America Market Y-o-Y Growth (%) Projections by Source, 2023 to 2033
Figure 78: Latin America Market Value (US$ Million) Analysis by Million, 2018 to 2033
Figure 79: Latin America Market Volume (Tons) Analysis by Million, 2018 to 2033
Figure 80: Latin America Market Value Share (%) and BPS Analysis by Million, 2023 to 2033
Figure 81: Latin America Market Y-o-Y Growth (%) Projections by Million, 2023 to 2033
Figure 82: Latin America Market Value (US$ Million) Analysis by Distribution Channel, 2018 to 2033
Figure 83: Latin America Market Volume (Tons) Analysis by Distribution Channel, 2018 to 2033
Figure 84: Latin America Market Value Share (%) and BPS Analysis by Distribution Channel, 2023 to 2033
Figure 85: Latin America Market Y-o-Y Growth (%) Projections by Distribution Channel, 2023 to 2033
Figure 86: Latin America Market Attractiveness by Product Type, 2023 to 2033
Figure 87: Latin America Market Attractiveness by Source, 2023 to 2033
Figure 88: Latin America Market Attractiveness by Million, 2023 to 2033
Figure 89: Latin America Market Attractiveness by Distribution Channel, 2023 to 2033
Figure 90: Latin America Market Attractiveness by Country, 2023 to 2033
Figure 91: Europe Market Value (US$ Million) by Product Type, 2023 to 2033
Figure 92: Europe Market Value (US$ Million) by Source, 2023 to 2033
Figure 93: Europe Market Value (US$ Million) by Million, 2023 to 2033
Figure 94: Europe Market Value (US$ Million) by Distribution Channel, 2023 to 2033
Figure 95: Europe Market Value (US$ Million) by Country, 2023 to 2033
Figure 96: Europe Market Value (US$ Million) Analysis by Country, 2018 to 2033
Figure 97: Europe Market Volume (Tons) Analysis by Country, 2018 to 2033
Figure 98: Europe Market Value Share (%) and BPS Analysis by Country, 2023 to 2033
Figure 99: Europe Market Y-o-Y Growth (%) Projections by Country, 2023 to 2033
Figure 100: Europe Market Value (US$ Million) Analysis by Product Type, 2018 to 2033
Figure 101: Europe Market Volume (Tons) Analysis by Product Type, 2018 to 2033
Figure 102: Europe Market Value Share (%) and BPS Analysis by Product Type, 2023 to 2033
Figure 103: Europe Market Y-o-Y Growth (%) Projections by Product Type, 2023 to 2033
Figure 104: Europe Market Value (US$ Million) Analysis by Source, 2018 to 2033
Figure 105: Europe Market Volume (Tons) Analysis by Source, 2018 to 2033
Figure 106: Europe Market Value Share (%) and BPS Analysis by Source, 2023 to 2033
Figure 107: Europe Market Y-o-Y Growth (%) Projections by Source, 2023 to 2033
Figure 108: Europe Market Value (US$ Million) Analysis by Million, 2018 to 2033
Figure 109: Europe Market Volume (Tons) Analysis by Million, 2018 to 2033
Figure 110: Europe Market Value Share (%) and BPS Analysis by Million, 2023 to 2033
Figure 111: Europe Market Y-o-Y Growth (%) Projections by Million, 2023 to 2033
Figure 112: Europe Market Value (US$ Million) Analysis by Distribution Channel, 2018 to 2033
Figure 113: Europe Market Volume (Tons) Analysis by Distribution Channel, 2018 to 2033
Figure 114: Europe Market Value Share (%) and BPS Analysis by Distribution Channel, 2023 to 2033
Figure 115: Europe Market Y-o-Y Growth (%) Projections by Distribution Channel, 2023 to 2033
Figure 116: Europe Market Attractiveness by Product Type, 2023 to 2033
Figure 117: Europe Market Attractiveness by Source, 2023 to 2033
Figure 118: Europe Market Attractiveness by Million, 2023 to 2033
Figure 119: Europe Market Attractiveness by Distribution Channel, 2023 to 2033
Figure 120: Europe Market Attractiveness by Country, 2023 to 2033
Figure 121: Asia Pacific Market Value (US$ Million) by Product Type, 2023 to 2033
Figure 122: Asia Pacific Market Value (US$ Million) by Source, 2023 to 2033
Figure 123: Asia Pacific Market Value (US$ Million) by Million, 2023 to 2033
Figure 124: Asia Pacific Market Value (US$ Million) by Distribution Channel, 2023 to 2033
Figure 125: Asia Pacific Market Value (US$ Million) by Country, 2023 to 2033
Figure 126: Asia Pacific Market Value (US$ Million) Analysis by Country, 2018 to 2033
Figure 127: Asia Pacific Market Volume (Tons) Analysis by Country, 2018 to 2033
Figure 128: Asia Pacific Market Value Share (%) and BPS Analysis by Country, 2023 to 2033
Figure 129: Asia Pacific Market Y-o-Y Growth (%) Projections by Country, 2023 to 2033
Figure 130: Asia Pacific Market Value (US$ Million) Analysis by Product Type, 2018 to 2033
Figure 131: Asia Pacific Market Volume (Tons) Analysis by Product Type, 2018 to 2033
Figure 132: Asia Pacific Market Value Share (%) and BPS Analysis by Product Type, 2023 to 2033
Figure 133: Asia Pacific Market Y-o-Y Growth (%) Projections by Product Type, 2023 to 2033
Figure 134: Asia Pacific Market Value (US$ Million) Analysis by Source, 2018 to 2033
Figure 135: Asia Pacific Market Volume (Tons) Analysis by Source, 2018 to 2033
Figure 136: Asia Pacific Market Value Share (%) and BPS Analysis by Source, 2023 to 2033
Figure 137: Asia Pacific Market Y-o-Y Growth (%) Projections by Source, 2023 to 2033
Figure 138: Asia Pacific Market Value (US$ Million) Analysis by Million, 2018 to 2033
Figure 139: Asia Pacific Market Volume (Tons) Analysis by Million, 2018 to 2033
Figure 140: Asia Pacific Market Value Share (%) and BPS Analysis by Million, 2023 to 2033
Figure 141: Asia Pacific Market Y-o-Y Growth (%) Projections by Million, 2023 to 2033
Figure 142: Asia Pacific Market Value (US$ Million) Analysis by Distribution Channel, 2018 to 2033
Figure 143: Asia Pacific Market Volume (Tons) Analysis by Distribution Channel, 2018 to 2033
Figure 144: Asia Pacific Market Value Share (%) and BPS Analysis by Distribution Channel, 2023 to 2033
Figure 145: Asia Pacific Market Y-o-Y Growth (%) Projections by Distribution Channel, 2023 to 2033
Figure 146: Asia Pacific Market Attractiveness by Product Type, 2023 to 2033
Figure 147: Asia Pacific Market Attractiveness by Source, 2023 to 2033
Figure 148: Asia Pacific Market Attractiveness by Million, 2023 to 2033
Figure 149: Asia Pacific Market Attractiveness by Distribution Channel, 2023 to 2033
Figure 150: Asia Pacific Market Attractiveness by Country, 2023 to 2033
Figure 151: MEA Market Value (US$ Million) by Product Type, 2023 to 2033
Figure 152: MEA Market Value (US$ Million) by Source, 2023 to 2033
Figure 153: MEA Market Value (US$ Million) by Million, 2023 to 2033
Figure 154: MEA Market Value (US$ Million) by Distribution Channel, 2023 to 2033
Figure 155: MEA Market Value (US$ Million) by Country, 2023 to 2033
Figure 156: MEA Market Value (US$ Million) Analysis by Country, 2018 to 2033
Figure 157: MEA Market Volume (Tons) Analysis by Country, 2018 to 2033
Figure 158: MEA Market Value Share (%) and BPS Analysis by Country, 2023 to 2033
Figure 159: MEA Market Y-o-Y Growth (%) Projections by Country, 2023 to 2033
Figure 160: MEA Market Value (US$ Million) Analysis by Product Type, 2018 to 2033
Figure 161: MEA Market Volume (Tons) Analysis by Product Type, 2018 to 2033
Figure 162: MEA Market Value Share (%) and BPS Analysis by Product Type, 2023 to 2033
Figure 163: MEA Market Y-o-Y Growth (%) Projections by Product Type, 2023 to 2033
Figure 164: MEA Market Value (US$ Million) Analysis by Source, 2018 to 2033
Figure 165: MEA Market Volume (Tons) Analysis by Source, 2018 to 2033
Figure 166: MEA Market Value Share (%) and BPS Analysis by Source, 2023 to 2033
Figure 167: MEA Market Y-o-Y Growth (%) Projections by Source, 2023 to 2033
Figure 168: MEA Market Value (US$ Million) Analysis by Million, 2018 to 2033
Figure 169: MEA Market Volume (Tons) Analysis by Million, 2018 to 2033
Figure 170: MEA Market Value Share (%) and BPS Analysis by Million, 2023 to 2033
Figure 171: MEA Market Y-o-Y Growth (%) Projections by Million, 2023 to 2033
Figure 172: MEA Market Value (US$ Million) Analysis by Distribution Channel, 2018 to 2033
Figure 173: MEA Market Volume (Tons) Analysis by Distribution Channel, 2018 to 2033
Figure 174: MEA Market Value Share (%) and BPS Analysis by Distribution Channel, 2023 to 2033
Figure 175: MEA Market Y-o-Y Growth (%) Projections by Distribution Channel, 2023 to 2033
Figure 176: MEA Market Attractiveness by Product Type, 2023 to 2033
Figure 177: MEA Market Attractiveness by Source, 2023 to 2033
Figure 178: MEA Market Attractiveness by Million, 2023 to 2033
Figure 179: MEA Market Attractiveness by Distribution Channel, 2023 to 2033
Figure 180: MEA Market Attractiveness by Country, 2023 to 2033
The market is valued at USD 249.1 million in 2023.
China’s market is expected to rise at a CAGR of 7.9% through 2033.
The market is forecast to register a CAGR of 10.2% through 2033.
The United Kingdom market is expected to record a CAGR of 11.4% through 2033.
The rising popularity of Mexican and Tex-Mex cuisine is the key driver of the market.
Explore Similar Insights
Thank you!
You will receive an email from our Business Development Manager. Please be sure to check your SPAM/JUNK folder too.