Vegan Cheese Market Size and Share Forecast Outlook 2025 to 2035

The Vegan Cheese Market is estimated to be valued at USD 3.8 billion in 2025 and is projected to reach USD 8.9 billion by 2035, registering a compound annual growth rate (CAGR) of 8.9% over the forecast period.
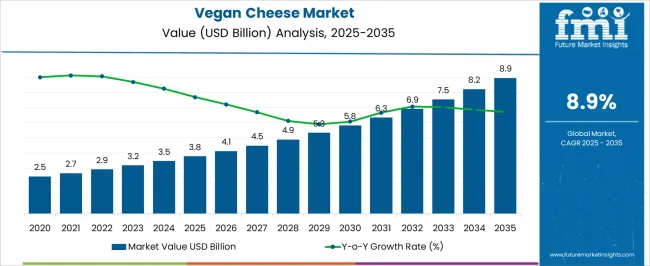
Quick Stats for Vegan Cheese Market

  • Vegan Cheese Market Industry Value (2025): USD 3.8 billion
  • Vegan Cheese Market Forecast Value (2035): USD 8.9 billion
  • Vegan Cheese Market Forecast CAGR: 8.9%
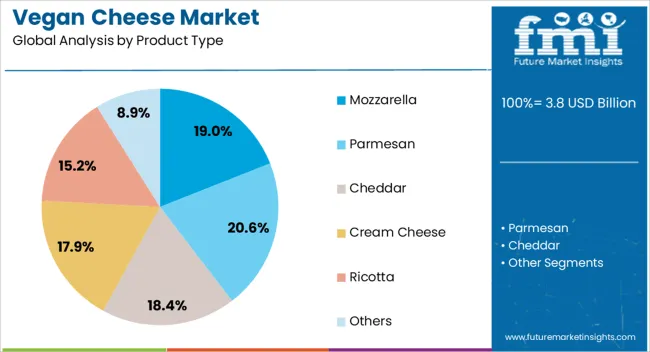
  • Leading Segment in Vegan Cheese Market in 2025: Mozzarella (19.0%)
  • Key Growth Region in Vegan Cheese Market: North America, Asia-Pacific, Europe
  • Top Key Players in Vegan Cheese Market: Daiya Foods Inc., Kite Hill, Violife, Dr-Cow Tree Nut Cheese, Treeline Cheese, Tofutti Brands, Inc., Tyne Chease Limited, Miyoko’s Creamery, Parmela Creamery, Gardener Cheese Company

Vegan Cheese Market Market Value Analysis

Metric Value
Vegan Cheese Market Estimated Value in (2025 E) USD 3.8 billion
Vegan Cheese Market Forecast Value in (2035 F) USD 8.9 billion
Forecast CAGR (2025 to 2035) 8.9%

Rationale for Segmental Growth in the Vegan Cheese Market

The vegan cheese market is expanding steadily, propelled by rising consumer preference for plant-based diets, heightened lactose intolerance awareness, and sustainability concerns linked to dairy production. Food industry publications and company reports have highlighted strong demand from both retail and foodservice channels, with vegan cheese increasingly incorporated into mainstream menus and packaged food products.

Advances in food technology have enabled producers to improve taste, texture, and meltability, narrowing the sensory gap between vegan and traditional cheese. Strategic investments in product innovation and raw material diversification, including nuts, seeds, and legumes, have further broadened product portfolios.

Growing health consciousness has also fueled demand for dairy-free alternatives that support cholesterol management and weight control. Looking ahead, market growth is expected to be supported by regulatory encouragement for plant-based labeling, expanding product availability across global supermarket chains, and rising consumer willingness to pay for sustainable and ethical food options. Segmental expansion is being led by mozzarella within product type, shreds as the dominant form, and almond milk as the primary source base.
Segmental Analysis

Insights into the Product Type Segment: Mozzarella

Vegan Cheese Market Analysis By Product Type

The Mozzarella segment is projected to hold 19.0% of the vegan cheese market revenue in 2025, establishing itself as the leading product type. Its dominance has been shaped by strong consumer demand for vegan cheese suitable for pizzas, sandwiches, and baked dishes, where mozzarella is traditionally used.

Food industry announcements have noted that mozzarella formulations have benefited from advancements in melting and stretching properties, aligning closely with consumer expectations. Retail sales data has reflected consistent growth in vegan mozzarella demand due to its versatility across home cooking and foodservice menus.

Manufacturers have prioritized mozzarella development because of its universal appeal and ability to drive repeat purchases. As global quick-service restaurants and bakery chains expand their plant-based offerings, the Mozzarella segment is expected to maintain a central role in sustaining vegan cheese adoption.
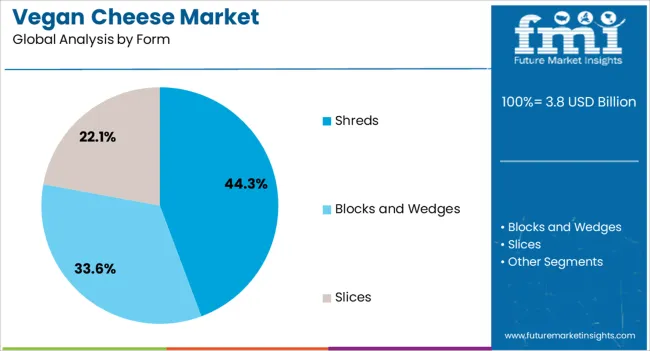
Insights into the Form Segment: Shreds

Vegan Cheese Market Analysis By Form

The Shreds segment is anticipated to account for 44.3% of the vegan cheese market revenue in 2025, sustaining its position as the leading form. This growth has been attributed to consumer preference for convenient, ready-to-use cheese formats that reduce preparation time in home and professional kitchens.

Industry sources have reported that shredded vegan cheese has been widely adopted by restaurants, bakeries, and packaged food companies due to its ease of portioning and consistent meltability. Additionally, shredded formats have gained traction in retail channels as they are perceived as versatile, suitable for a wide range of recipes from salads to baked goods.

Packaging innovations, such as resealable pouches, have further supported the popularity of shredded vegan cheese by preserving freshness and extending shelf life. With convenience continuing to shape consumer purchasing behavior, the Shreds segment is expected to remain the dominant choice among vegan cheese forms.
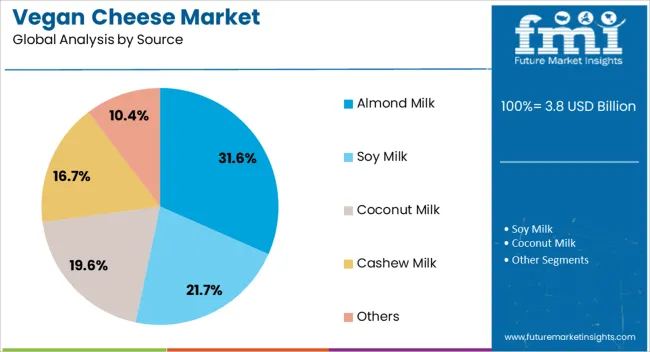
Insights into the Source Segment: Almond Milk

Vegan Cheese Market Analysis By Source

The Almond Milk segment is projected to contribute 31.6% of the vegan cheese market revenue in 2025, maintaining its leadership within source materials. Growth in this segment has been supported by the widespread acceptance of almond-based dairy alternatives across beverages, yogurts, and desserts, which has translated into cheese formulations.

Almond milk has been preferred for its neutral taste, creamy texture, and nutritional attributes, including healthy fats and vitamin E content. Food industry reports have highlighted strong consumer demand for almond-derived products due to their perceived natural and wholesome profile.

Moreover, almond milk-based vegan cheese has gained visibility in supermarkets and specialty stores, supported by brand marketing campaigns emphasizing plant-based wellness. Although concerns about almond cultivation’s water footprint exist, its established market recognition and consumer trust have kept almond milk at the forefront of vegan cheese innovation. This segment is expected to remain resilient as producers continue to refine flavor profiles and expand almond-based cheese varieties.

Market Trends and Drivers for Vegan Cheese Consumption

  • Veganism is gaining a massive following, which is directly impacting the sales of dairy-free cheese.
  • Factors like ethics, health, or sustainability concerns are also motivating "flexitarians" or "reducetarians" to seek plant-based cheese alternatives.
  • Growing cognizance about the environmental impact of animal agriculture and the potential health benefits of plant-based diets are impacting consumer preferences in favor of dairy-free cheese.
  • Players are formulating new vegan cheese flavors to attract a wider consumer base.
  • Players are continuously introducing new varieties of dairy-free cheese like cream cheese, brie, feta, etc. By releasing new products they meet the wider range of recipe needs as well as the taste and dietary preferences of different demographics.

Category-wise Vegan Cheese Market Analysis

Mozzarella Enjoys Hero Status in Several Popular Dishes

Mozzarella is estimated to acquire a share of 19% in 2025. The product enjoys significant use in popular dishes, especially pizza. The growing vegan movement is motivating consumers to go for delicious plant-based pizzas. Players are thus introducing improved vegan mozzarella to allow people to indulge in cheesy goodness made without dairy.

Leading Product Type Mozzarella
Value Share (2025) 19%

The application of vegan mozzarella extends to vegan takes on grilled cheese sandwiches, lasagna, salads, and pasta dishes to add the familiar cheesy element. A wide spectrum of applications is making mozzarella more attractive to consumers.

Hypermarkets/Supermarkets Stock More Options of Dairy-free Cheese Varieties

Hypermarkets/supermarkets make up 34% of the global market share. Consumers typically increasingly flock to this sales channel to purchase items after going through their ingredient lists and making a comparative judgment about the other available alternatives. These stores continuously offer discounts to compel consumers to buy from their stores.

Leading Sales Channel Hypermarkets/Supermarkets
Value Share (2025) 34%

These stores are allocating more shelf space to vegan products like dairy-free cheese to increase their visibility among consumers unaware of the product.
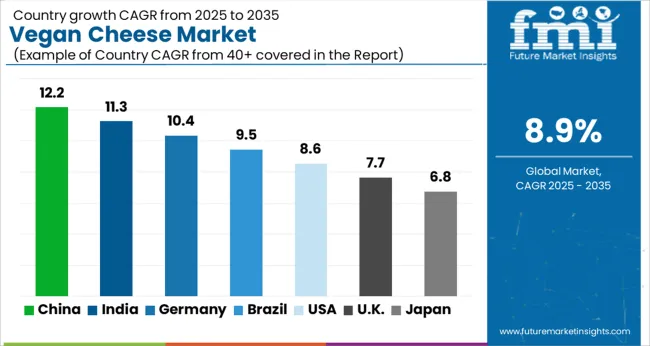
Global Vegan Cheese Industry Demand Analysis by Country

Vegan Cheese Market Cagr Analysis By Country

According to the latest industry projections, the demand for vegan cheese is going to be more pronounced in countries of North America and Europe. In Asia Pacific, consumption patterns vary significantly from country to country, with India showing massive demand for cruelty-free cheese.

Cheese Brands in the United States Industry Offering Vegan Cheese Choices

The United States vegan cheese industry is benefitting from the surge of interest in vegan products, cheese included. The United States Vegan Cheese Market share of 25.4% weighs heavily on the other regional markets. Thus, extending its influence in the global market.

The accelerated consumer demand for vegan cheese, increasing at 6.9% CAGR, is further attracting several key players like Miyoko's Creamery, Treeline Tree Nut Cheese, Follow Your Heart, etc. to absorb emerging demand through new key offerings.

Lactose-intolerant as well as health-conscious consumers are increasingly consuming dairy-free cheese to keep their health in check. The demand for vegan cheese is further supported by the rising availability of dairy-free cheese in popular stores and restaurant chains.

Vegan Population in the United Kingdom Relishes Tacos, Pizza, and Pasta with Dairy-free Cheese

Consumers in the United Kingdom are creating a consistent demand for vegan cheese. Through 2035, the industry is projected to expand at a 5.3% CAGR, supported by government promotion and awareness efforts about the product’s health benefits.

Popular dairy-free cheese brands like Violife are widely available across the country and are loved by the residents. This Greece-based company, especially, comes in slices, shreds, blocks, and more. Thus, impressing people with its flavor and meltability.

Growing vegan population in the country is further strengthening the demand for vegan cheese. Dairy-free cheese, due to its similar attributes to the conventional version, goes along with pasta, pizza, tacos, etc. Rising popularity of this cheese is inducing supermarkets and health food stores to stock innovations in vegan cheese.

eCommerce Websites a Boon for Vegan Cheese Brands Expanding in India

Population in India is on the radar of leading dairy-free cheese brands. Increasing income levels and surging willingness to pay for ethically-produced products are consolidating this sector in India. These industry dynamics are supporting the pace of 6.8% over the next decade.

Purchases of the Indian population are driven by concerns over personal health, animal welfare, and the environment. Customers are searching for these 100% cheese alternatives online to get these products quickly delivered to their order location. Stores, convenience stores, etc. are also stocking alternates for parmesan, mozzarella, cheddar, cheesy dips, and more to foster inclusivity.

Players are also introducing dairy-free cheese offerings that are cholesterol-free so that consumers can enjoy a guilt-free experience.
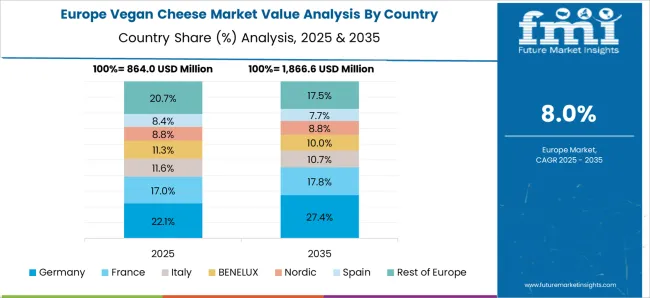
Expanding Plant-based movement in Germany is Encouraging Dairy-free Cheese

Vegan Cheese Market Europe Country Market Share Analysis, 2025 & 2035

The vegan cheese industry in Germany is predicted to expand at a promising 7.9% over the estimated period. The easy availability of vegan sliced cheese and other vegan cheese forms in German supermarkets is increasing the industry share for dairy-free cheese in the country.

Broader plant-based movement spurring in Germany, giving impetus to the growth of the vegan cheese industry. In line with this, the country is experiencing a steep rise in vegetarian and vegan diets. The plant-based movement is also supported by more people now opting for flexitarian and reducetarian diets to decrease their consumption of animal products.

Increasing awareness of lactose intolerance is also fueling the sales of plant-based cheese. In time, not far from now, dairy-free cheese producers are predicted to innovate more dairy-free cheese options, particularly fermented varieties, to draw in more customers.

Recipe Makers in China Experimenting with Dairy-free Cheese to Develop Novel Fusion Foods

Demand for plant-based cheese in China is expanding at a CAGR of 3.9% over the projected period. Rising population readiness to live more sustainably, consciously, and with a lesser carbon footprint, is fueling the demand for plant-based cheese.

Rising integration of dairy-free cheese and its byproducts in Chinese culinary culture to develop novel fusion foods is raising the consumer base of dairy-free cheese.

Companies are increasingly developing strategic partnerships with food distributors to broaden the reach of their dairy-free cheese line across China. For instance, in May 2025, Youkuai Group International, a Chinese plant-based food firm, partnered with Usource, a local food distributor, to enjoy a better reach across the country.

Youkuai’s dairy-free meat brand Zrou is benefitting from this alliance. This is because its products are increasingly being supplied across various food outlets like hotels, breweries, diners, etc. across Tianjin, Beijing, and other regions of North China.
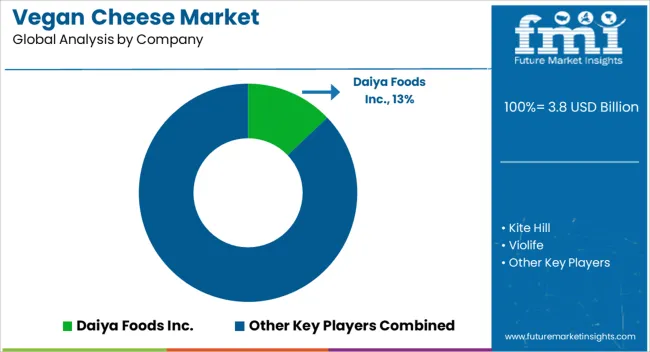
Competitive Landscape Evaluation of the Vegan Cheese Sector

Vegan Cheese Market Analysis By Company

Key players in the vegan cheese sector are focusing on strategic brand positioning in high-potential markets to increase their industry share. Increasingly, players are exploring new opportunities in the dairy alternatives sector to tap into untapped and niche segments for dairy-free cheese.

Despite the growing popularity of cruelty-free cheese, modern consumers are showing concern over the product’s nutritional value and quality. Consequently, full-scale research and development are being made to mimic the traditional cheese’ properties.

Players are also investing their money in these activities to closely replicate the flavor qualities and intricate structure of the cheese. Innovations in vegan cheese development are thus an effective strategy adopted by players to differentiate their product offerings and increase their competitiveness.

Players are also strengthening their ties with different distribution channels of plant-based cheese. Certain distribution channels employ point of sale (POS) marketing to players who give them a higher cut to reach the intended consumers. Thus, increasing their annual sales of dairy-free cheese.

Corporations are also maximizing business synergies to effectively complement their product pipelines to get ahead in this sector.

Following Latest Developments Molding the Vegan Cheese Sector

  • In February 2025, Stockeld Dreamery, which is a Swedish vegan dairy start-up, introduced a fermented Cheddar slice that would elevate the vegan cheese experience. This newly made plant-based cheese is developed from fermented legume milk. It is claimed to be pioneering the “third wave” of dairy-free cheese.
  • In October 2025, PETA published on its site that it will be giving away Babybel dairy-free cheese to passersby and attendees of the International Dairy Federation World Dairy Summit. So, PETA reminded people that loving cheese, yogurt, and milk can go hand-in-hand with being kind to animals.
  • In April 2025, The Compleat Food Group came back to the M&A industry by acquiring Palace Culture, which is a UK-based dairy-free cheese business. Palace Culture contributes to the group’s plant-based product line, but it is distinguished as it moves away from meat alternatives.

Enlisted Below are Key Vegan Cheese Players

  • Daiya Foods Inc.
  • Kite Hill
  • Violife
  • Dr-Cow Tree Nut Cheese
  • Treeline Cheese
  • Tofutti Brands, Inc.
  • Tyne Chease Limited
  • Miyoko’s Creamery
  • Parmela Creamery
  • Gardener Cheese Company
  • Others

Industry Segmentation of Vegan Cheese by Product Type, End-use, Region, etc

By Product Type:

Based on product type, the industry is segregated into mozzarella, parmesan, cheddar, cream cheese, ricotta, and others

By Form:

By form, the industry is trifurcated into shreds, slices, blocks, and wedges

By Source:

Various sources of dairy-free cheese are almond milk, soy milk, coconut milk, cashew milk, and others

By End-use:

Key end uses of dairy-free cheese include processed and packed foods, food processing, baked goods, sauces, snacks, ready meals, dairy and desserts, food service/HoReCa (hotels, restaurants, cafes), dips and dressings, and household/retail

By Nature:

Dairy-free cheese is available in both conventional and organic form

By Sales Channel:

Various sales channels for dairy-free cheese are traditional grocery stores, indirect sales, hypermarkets/supermarkets, convenience stores, direct sales, specialty retail stores, and online retailers

By Region:

Key countries taken for this research report are North America, Europe, Asia Pacific, Middle East and Africa, and Latin America

Table of Content

  1. Executive Summary
    • Global Market Outlook
    • Demand-side Trends
    • Supply-side Trends
    • Technology Roadmap Analysis
    • Analysis and Recommendations
  2. Market Overview
    • Market Coverage / Taxonomy
    • Market Definition / Scope / Limitations
  3. Market Background
    • Market Dynamics
      • Drivers
      • Restraints
      • Opportunity
      • Trends
    • Scenario Forecast
      • Demand in Optimistic Scenario
      • Demand in Likely Scenario
      • Demand in Conservative Scenario
    • Opportunity Map Analysis
    • Product Life Cycle Analysis
    • Supply Chain Analysis
    • Investment Feasibility Matrix
    • Value Chain Analysis
    • PESTLE and Porter’s Analysis
    • Regulatory Landscape
    • Regional Parent Market Outlook
    • Production and Consumption Statistics
    • Import and Export Statistics
  4. Global Market Analysis 2020 to 2024 and Forecast, 2025 to 2035
    • Historical Market Size Value (USD Million) Analysis, 2020 to 2024
    • Current and Future Market Size Value (USD Million) Projections, 2025 to 2035
      • Y-o-Y Growth Trend Analysis
      • Absolute $ Opportunity Analysis
  5. Global Market Pricing Analysis 2020 to 2024 and Forecast 2025 to 2035
  6. Global Market Analysis 2020 to 2024 and Forecast 2025 to 2035, By Product Type
    • Introduction / Key Findings
    • Historical Market Size Value (USD Million) Analysis By Product Type , 2020 to 2024
    • Current and Future Market Size Value (USD Million) Analysis and Forecast By Product Type , 2025 to 2035
      • Mozzarella
      • Parmesan
      • Cheddar
      • Cream Cheese
      • Ricotta
      • Others
    • Y-o-Y Growth Trend Analysis By Product Type , 2020 to 2024
    • Absolute $ Opportunity Analysis By Product Type , 2025 to 2035
  7. Global Market Analysis 2020 to 2024 and Forecast 2025 to 2035, By Form
    • Introduction / Key Findings
    • Historical Market Size Value (USD Million) Analysis By Form, 2020 to 2024
    • Current and Future Market Size Value (USD Million) Analysis and Forecast By Form, 2025 to 2035
      • Shreds
      • Blocks and Wedges
      • Slices
    • Y-o-Y Growth Trend Analysis By Form, 2020 to 2024
    • Absolute $ Opportunity Analysis By Form, 2025 to 2035
  8. Global Market Analysis 2020 to 2024 and Forecast 2025 to 2035, By Source
    • Introduction / Key Findings
    • Historical Market Size Value (USD Million) Analysis By Source, 2020 to 2024
    • Current and Future Market Size Value (USD Million) Analysis and Forecast By Source, 2025 to 2035
      • Almond Milk
      • Soy Milk
      • Coconut Milk
      • Cashew Milk
      • Others
    • Y-o-Y Growth Trend Analysis By Source, 2020 to 2024
    • Absolute $ Opportunity Analysis By Source, 2025 to 2035
  9. Global Market Analysis 2020 to 2024 and Forecast 2025 to 2035, By End-Use
    • Introduction / Key Findings
    • Historical Market Size Value (USD Million) Analysis By End-Use, 2020 to 2024
    • Current and Future Market Size Value (USD Million) Analysis and Forecast By End-Use, 2025 to 2035
      • Household
      • Food Processing
      • Baked Goods
      • Sauces, Dips and Dressings
      • Snacks
      • Processed and Packed Foods
      • Ready Meals
      • Dairy and Desserts
      • Food Service/HoReCa (Hotels, Restaurant, Cafes)
    • Y-o-Y Growth Trend Analysis By End-Use, 2020 to 2024
    • Absolute $ Opportunity Analysis By End-Use, 2025 to 2035
  10. Global Market Analysis 2020 to 2024 and Forecast 2025 to 2035, By Nature
    • Introduction / Key Findings
    • Historical Market Size Value (USD Million) Analysis By Nature, 2020 to 2024
    • Current and Future Market Size Value (USD Million) Analysis and Forecast By Nature, 2025 to 2035
      • Conventional
      • Organic
    • Y-o-Y Growth Trend Analysis By Nature, 2020 to 2024
    • Absolute $ Opportunity Analysis By Nature, 2025 to 2035
  11. Global Market Analysis 2020 to 2024 and Forecast 2025 to 2035, By Sales Channel
    • Introduction / Key Findings
    • Historical Market Size Value (USD Million) Analysis By Sales Channel, 2020 to 2024
    • Current and Future Market Size Value (USD Million) Analysis and Forecast By Sales Channel, 2025 to 2035
      • Hypermarkets/Supermarkets
      • Convenience Stores
      • Specialty Retail Stores
      • Online Retailers
    • Y-o-Y Growth Trend Analysis By Sales Channel, 2020 to 2024
    • Absolute $ Opportunity Analysis By Sales Channel, 2025 to 2035
  12. Global Market Analysis 2020 to 2024 and Forecast 2025 to 2035, By Region
    • Introduction
    • Historical Market Size Value (USD Million) Analysis By Region, 2020 to 2024
    • Current Market Size Value (USD Million) Analysis and Forecast By Region, 2025 to 2035
      • North America
      • Latin America
      • Western Europe
      • Eastern Europe
      • East Asia
      • South Asia and Pacific
      • Middle East & Africa
    • Market Attractiveness Analysis By Region
  13. North America Market Analysis 2020 to 2024 and Forecast 2025 to 2035, By Country
    • Historical Market Size Value (USD Million) Trend Analysis By Market Taxonomy, 2020 to 2024
    • Market Size Value (USD Million) Forecast By Market Taxonomy, 2025 to 2035
      • By Country
        • USA
        • Canada
        • Mexico
      • By Product Type
      • By Form
      • By Source
      • By End-Use
      • By Nature
      • By Sales Channel
    • Market Attractiveness Analysis
      • By Country
      • By Product Type
      • By Form
      • By Source
      • By End-Use
      • By Nature
      • By Sales Channel
    • Key Takeaways
  14. Latin America Market Analysis 2020 to 2024 and Forecast 2025 to 2035, By Country
    • Historical Market Size Value (USD Million) Trend Analysis By Market Taxonomy, 2020 to 2024
    • Market Size Value (USD Million) Forecast By Market Taxonomy, 2025 to 2035
      • By Country
        • Brazil
        • Chile
        • Rest of Latin America
      • By Product Type
      • By Form
      • By Source
      • By End-Use
      • By Nature
      • By Sales Channel
    • Market Attractiveness Analysis
      • By Country
      • By Product Type
      • By Form
      • By Source
      • By End-Use
      • By Nature
      • By Sales Channel
    • Key Takeaways
  15. Western Europe Market Analysis 2020 to 2024 and Forecast 2025 to 2035, By Country
    • Historical Market Size Value (USD Million) Trend Analysis By Market Taxonomy, 2020 to 2024
    • Market Size Value (USD Million) Forecast By Market Taxonomy, 2025 to 2035
      • By Country
        • Germany
        • UK
        • Italy
        • Spain
        • France
        • Nordic
        • BENELUX
        • Rest of Western Europe
      • By Product Type
      • By Form
      • By Source
      • By End-Use
      • By Nature
      • By Sales Channel
    • Market Attractiveness Analysis
      • By Country
      • By Product Type
      • By Form
      • By Source
      • By End-Use
      • By Nature
      • By Sales Channel
    • Key Takeaways
  16. Eastern Europe Market Analysis 2020 to 2024 and Forecast 2025 to 2035, By Country
    • Historical Market Size Value (USD Million) Trend Analysis By Market Taxonomy, 2020 to 2024
    • Market Size Value (USD Million) Forecast By Market Taxonomy, 2025 to 2035
      • By Country
        • Russia
        • Poland
        • Hungary
        • Balkan & Baltic
        • Rest of Eastern Europe
      • By Product Type
      • By Form
      • By Source
      • By End-Use
      • By Nature
      • By Sales Channel
    • Market Attractiveness Analysis
      • By Country
      • By Product Type
      • By Form
      • By Source
      • By End-Use
      • By Nature
      • By Sales Channel
    • Key Takeaways
  17. East Asia Market Analysis 2020 to 2024 and Forecast 2025 to 2035, By Country
    • Historical Market Size Value (USD Million) Trend Analysis By Market Taxonomy, 2020 to 2024
    • Market Size Value (USD Million) Forecast By Market Taxonomy, 2025 to 2035
      • By Country
        • China
        • Japan
        • South Korea
      • By Product Type
      • By Form
      • By Source
      • By End-Use
      • By Nature
      • By Sales Channel
    • Market Attractiveness Analysis
      • By Country
      • By Product Type
      • By Form
      • By Source
      • By End-Use
      • By Nature
      • By Sales Channel
    • Key Takeaways
  18. South Asia and Pacific Market Analysis 2020 to 2024 and Forecast 2025 to 2035, By Country
    • Historical Market Size Value (USD Million) Trend Analysis By Market Taxonomy, 2020 to 2024
    • Market Size Value (USD Million) Forecast By Market Taxonomy, 2025 to 2035
      • By Country
        • India
        • ASEAN
        • Australia & New Zealand
        • Rest of South Asia and Pacific
      • By Product Type
      • By Form
      • By Source
      • By End-Use
      • By Nature
      • By Sales Channel
    • Market Attractiveness Analysis
      • By Country
      • By Product Type
      • By Form
      • By Source
      • By End-Use
      • By Nature
      • By Sales Channel
    • Key Takeaways
  19. Middle East & Africa Market Analysis 2020 to 2024 and Forecast 2025 to 2035, By Country
    • Historical Market Size Value (USD Million) Trend Analysis By Market Taxonomy, 2020 to 2024
    • Market Size Value (USD Million) Forecast By Market Taxonomy, 2025 to 2035
      • By Country
        • Kingdom of Saudi Arabia
        • Other GCC Countries
        • Turkiye
        • South Africa
        • Other African Union
        • Rest of Middle East & Africa
      • By Product Type
      • By Form
      • By Source
      • By End-Use
      • By Nature
      • By Sales Channel
    • Market Attractiveness Analysis
      • By Country
      • By Product Type
      • By Form
      • By Source
      • By End-Use
      • By Nature
      • By Sales Channel
    • Key Takeaways
  20. Key Countries Market Analysis
    • USA
      • Pricing Analysis
      • Market Share Analysis, 2024
        • By Product Type
        • By Form
        • By Source
        • By End-Use
        • By Nature
        • By Sales Channel
    • Canada
      • Pricing Analysis
      • Market Share Analysis, 2024
        • By Product Type
        • By Form
        • By Source
        • By End-Use
        • By Nature
        • By Sales Channel
    • Mexico
      • Pricing Analysis
      • Market Share Analysis, 2024
        • By Product Type
        • By Form
        • By Source
        • By End-Use
        • By Nature
        • By Sales Channel
    • Brazil
      • Pricing Analysis
      • Market Share Analysis, 2024
        • By Product Type
        • By Form
        • By Source
        • By End-Use
        • By Nature
        • By Sales Channel
    • Chile
      • Pricing Analysis
      • Market Share Analysis, 2024
        • By Product Type
        • By Form
        • By Source
        • By End-Use
        • By Nature
        • By Sales Channel
    • Germany
      • Pricing Analysis
      • Market Share Analysis, 2024
        • By Product Type
        • By Form
        • By Source
        • By End-Use
        • By Nature
        • By Sales Channel
    • UK
      • Pricing Analysis
      • Market Share Analysis, 2024
        • By Product Type
        • By Form
        • By Source
        • By End-Use
        • By Nature
        • By Sales Channel
    • Italy
      • Pricing Analysis
      • Market Share Analysis, 2024
        • By Product Type
        • By Form
        • By Source
        • By End-Use
        • By Nature
        • By Sales Channel
    • Spain
      • Pricing Analysis
      • Market Share Analysis, 2024
        • By Product Type
        • By Form
        • By Source
        • By End-Use
        • By Nature
        • By Sales Channel
    • France
      • Pricing Analysis
      • Market Share Analysis, 2024
        • By Product Type
        • By Form
        • By Source
        • By End-Use
        • By Nature
        • By Sales Channel
    • India
      • Pricing Analysis
      • Market Share Analysis, 2024
        • By Product Type
        • By Form
        • By Source
        • By End-Use
        • By Nature
        • By Sales Channel
    • ASEAN
      • Pricing Analysis
      • Market Share Analysis, 2024
        • By Product Type
        • By Form
        • By Source
        • By End-Use
        • By Nature
        • By Sales Channel
    • Australia & New Zealand
      • Pricing Analysis
      • Market Share Analysis, 2024
        • By Product Type
        • By Form
        • By Source
        • By End-Use
        • By Nature
        • By Sales Channel
    • China
      • Pricing Analysis
      • Market Share Analysis, 2024
        • By Product Type
        • By Form
        • By Source
        • By End-Use
        • By Nature
        • By Sales Channel
    • Japan
      • Pricing Analysis
      • Market Share Analysis, 2024
        • By Product Type
        • By Form
        • By Source
        • By End-Use
        • By Nature
        • By Sales Channel
    • South Korea
      • Pricing Analysis
      • Market Share Analysis, 2024
        • By Product Type
        • By Form
        • By Source
        • By End-Use
        • By Nature
        • By Sales Channel
    • Russia
      • Pricing Analysis
      • Market Share Analysis, 2024
        • By Product Type
        • By Form
        • By Source
        • By End-Use
        • By Nature
        • By Sales Channel
    • Poland
      • Pricing Analysis
      • Market Share Analysis, 2024
        • By Product Type
        • By Form
        • By Source
        • By End-Use
        • By Nature
        • By Sales Channel
    • Hungary
      • Pricing Analysis
      • Market Share Analysis, 2024
        • By Product Type
        • By Form
        • By Source
        • By End-Use
        • By Nature
        • By Sales Channel
    • Kingdom of Saudi Arabia
      • Pricing Analysis
      • Market Share Analysis, 2024
        • By Product Type
        • By Form
        • By Source
        • By End-Use
        • By Nature
        • By Sales Channel
    • Turkiye
      • Pricing Analysis
      • Market Share Analysis, 2024
        • By Product Type
        • By Form
        • By Source
        • By End-Use
        • By Nature
        • By Sales Channel
    • South Africa
      • Pricing Analysis
      • Market Share Analysis, 2024
        • By Product Type
        • By Form
        • By Source
        • By End-Use
        • By Nature
        • By Sales Channel
  21. Market Structure Analysis
    • Competition Dashboard
    • Competition Benchmarking
    • Market Share Analysis of Top Players
      • By Regional
      • By Product Type
      • By Form
      • By Source
      • By End-Use
      • By Nature
      • By Sales Channel
  22. Competition Analysis
    • Competition Deep Dive
      • Daiya Foods Inc.
        • Overview
        • Product Portfolio
        • Profitability by Market Segments (Product/Age /Sales Channel/Region)
        • Sales Footprint
        • Strategy Overview
          • Marketing Strategy
          • Product Strategy
          • Channel Strategy
      • Kite Hill
      • Violife
      • Dr-Cow Tree Nut Cheese
      • Treeline Cheese
      • Tofutti Brands, Inc.
      • Tyne Chease Limited
      • Miyoko’s Creamery
      • Parmela Creamery
      • Gardener Cheese Company
  23. Assumptions & Acronyms Used
  24. Research Methodology

List of Tables

  • Table 1: Global Market Value (USD Million) Forecast by Region, 2020 to 2035
  • Table 2: Global Market Value (USD Million) Forecast by Product Type , 2020 to 2035
  • Table 3: Global Market Value (USD Million) Forecast by Form, 2020 to 2035
  • Table 4: Global Market Value (USD Million) Forecast by Source, 2020 to 2035
  • Table 5: Global Market Value (USD Million) Forecast by End-Use, 2020 to 2035
  • Table 6: Global Market Value (USD Million) Forecast by Nature, 2020 to 2035
  • Table 7: Global Market Value (USD Million) Forecast by Sales Channel, 2020 to 2035
  • Table 8: North America Market Value (USD Million) Forecast by Country, 2020 to 2035
  • Table 9: North America Market Value (USD Million) Forecast by Product Type , 2020 to 2035
  • Table 10: North America Market Value (USD Million) Forecast by Form, 2020 to 2035
  • Table 11: North America Market Value (USD Million) Forecast by Source, 2020 to 2035
  • Table 12: North America Market Value (USD Million) Forecast by End-Use, 2020 to 2035
  • Table 13: North America Market Value (USD Million) Forecast by Nature, 2020 to 2035
  • Table 14: North America Market Value (USD Million) Forecast by Sales Channel, 2020 to 2035
  • Table 15: Latin America Market Value (USD Million) Forecast by Country, 2020 to 2035
  • Table 16: Latin America Market Value (USD Million) Forecast by Product Type , 2020 to 2035
  • Table 17: Latin America Market Value (USD Million) Forecast by Form, 2020 to 2035
  • Table 18: Latin America Market Value (USD Million) Forecast by Source, 2020 to 2035
  • Table 19: Latin America Market Value (USD Million) Forecast by End-Use, 2020 to 2035
  • Table 20: Latin America Market Value (USD Million) Forecast by Nature, 2020 to 2035
  • Table 21: Latin America Market Value (USD Million) Forecast by Sales Channel, 2020 to 2035
  • Table 22: Western Europe Market Value (USD Million) Forecast by Country, 2020 to 2035
  • Table 23: Western Europe Market Value (USD Million) Forecast by Product Type , 2020 to 2035
  • Table 24: Western Europe Market Value (USD Million) Forecast by Form, 2020 to 2035
  • Table 25: Western Europe Market Value (USD Million) Forecast by Source, 2020 to 2035
  • Table 26: Western Europe Market Value (USD Million) Forecast by End-Use, 2020 to 2035
  • Table 27: Western Europe Market Value (USD Million) Forecast by Nature, 2020 to 2035
  • Table 28: Western Europe Market Value (USD Million) Forecast by Sales Channel, 2020 to 2035
  • Table 29: Eastern Europe Market Value (USD Million) Forecast by Country, 2020 to 2035
  • Table 30: Eastern Europe Market Value (USD Million) Forecast by Product Type , 2020 to 2035
  • Table 31: Eastern Europe Market Value (USD Million) Forecast by Form, 2020 to 2035
  • Table 32: Eastern Europe Market Value (USD Million) Forecast by Source, 2020 to 2035
  • Table 33: Eastern Europe Market Value (USD Million) Forecast by End-Use, 2020 to 2035
  • Table 34: Eastern Europe Market Value (USD Million) Forecast by Nature, 2020 to 2035
  • Table 35: Eastern Europe Market Value (USD Million) Forecast by Sales Channel, 2020 to 2035
  • Table 36: East Asia Market Value (USD Million) Forecast by Country, 2020 to 2035
  • Table 37: East Asia Market Value (USD Million) Forecast by Product Type , 2020 to 2035
  • Table 38: East Asia Market Value (USD Million) Forecast by Form, 2020 to 2035
  • Table 39: East Asia Market Value (USD Million) Forecast by Source, 2020 to 2035
  • Table 40: East Asia Market Value (USD Million) Forecast by End-Use, 2020 to 2035
  • Table 41: East Asia Market Value (USD Million) Forecast by Nature, 2020 to 2035
  • Table 42: East Asia Market Value (USD Million) Forecast by Sales Channel, 2020 to 2035
  • Table 43: South Asia and Pacific Market Value (USD Million) Forecast by Country, 2020 to 2035
  • Table 44: South Asia and Pacific Market Value (USD Million) Forecast by Product Type , 2020 to 2035
  • Table 45: South Asia and Pacific Market Value (USD Million) Forecast by Form, 2020 to 2035
  • Table 46: South Asia and Pacific Market Value (USD Million) Forecast by Source, 2020 to 2035
  • Table 47: South Asia and Pacific Market Value (USD Million) Forecast by End-Use, 2020 to 2035
  • Table 48: South Asia and Pacific Market Value (USD Million) Forecast by Nature, 2020 to 2035
  • Table 49: South Asia and Pacific Market Value (USD Million) Forecast by Sales Channel, 2020 to 2035
  • Table 50: Middle East & Africa Market Value (USD Million) Forecast by Country, 2020 to 2035
  • Table 51: Middle East & Africa Market Value (USD Million) Forecast by Product Type , 2020 to 2035
  • Table 52: Middle East & Africa Market Value (USD Million) Forecast by Form, 2020 to 2035
  • Table 53: Middle East & Africa Market Value (USD Million) Forecast by Source, 2020 to 2035
  • Table 54: Middle East & Africa Market Value (USD Million) Forecast by End-Use, 2020 to 2035
  • Table 55: Middle East & Africa Market Value (USD Million) Forecast by Nature, 2020 to 2035
  • Table 56: Middle East & Africa Market Value (USD Million) Forecast by Sales Channel, 2020 to 2035

List of Figures

  • Figure 1: Global Market Pricing Analysis
  • Figure 2: Global Market Value (USD Million) Forecast 2020-2035
  • Figure 3: Global Market Value Share and BPS Analysis by Product Type , 2025 and 2035
  • Figure 4: Global Market Y-o-Y Growth Comparison by Product Type , 2025-2035
  • Figure 5: Global Market Attractiveness Analysis by Product Type
  • Figure 6: Global Market Value Share and BPS Analysis by Form, 2025 and 2035
  • Figure 7: Global Market Y-o-Y Growth Comparison by Form, 2025-2035
  • Figure 8: Global Market Attractiveness Analysis by Form
  • Figure 9: Global Market Value Share and BPS Analysis by Source, 2025 and 2035
  • Figure 10: Global Market Y-o-Y Growth Comparison by Source, 2025-2035
  • Figure 11: Global Market Attractiveness Analysis by Source
  • Figure 12: Global Market Value Share and BPS Analysis by End-Use, 2025 and 2035
  • Figure 13: Global Market Y-o-Y Growth Comparison by End-Use, 2025-2035
  • Figure 14: Global Market Attractiveness Analysis by End-Use
  • Figure 15: Global Market Value Share and BPS Analysis by Nature, 2025 and 2035
  • Figure 16: Global Market Y-o-Y Growth Comparison by Nature, 2025-2035
  • Figure 17: Global Market Attractiveness Analysis by Nature
  • Figure 18: Global Market Value Share and BPS Analysis by Sales Channel, 2025 and 2035
  • Figure 19: Global Market Y-o-Y Growth Comparison by Sales Channel, 2025-2035
  • Figure 20: Global Market Attractiveness Analysis by Sales Channel
  • Figure 21: Global Market Value (USD Million) Share and BPS Analysis by Region, 2025 and 2035
  • Figure 22: Global Market Y-o-Y Growth Comparison by Region, 2025-2035
  • Figure 23: Global Market Attractiveness Analysis by Region
  • Figure 24: North America Market Incremental Dollar Opportunity, 2025-2035
  • Figure 25: Latin America Market Incremental Dollar Opportunity, 2025-2035
  • Figure 26: Western Europe Market Incremental Dollar Opportunity, 2025-2035
  • Figure 27: Eastern Europe Market Incremental Dollar Opportunity, 2025-2035
  • Figure 28: East Asia Market Incremental Dollar Opportunity, 2025-2035
  • Figure 29: South Asia and Pacific Market Incremental Dollar Opportunity, 2025-2035
  • Figure 30: Middle East & Africa Market Incremental Dollar Opportunity, 2025-2035
  • Figure 31: North America Market Value Share and BPS Analysis by Country, 2025 and 2035
  • Figure 32: North America Market Value Share and BPS Analysis by Product Type , 2025 and 2035
  • Figure 33: North America Market Y-o-Y Growth Comparison by Product Type , 2025-2035
  • Figure 34: North America Market Attractiveness Analysis by Product Type
  • Figure 35: North America Market Value Share and BPS Analysis by Form, 2025 and 2035
  • Figure 36: North America Market Y-o-Y Growth Comparison by Form, 2025-2035
  • Figure 37: North America Market Attractiveness Analysis by Form
  • Figure 38: North America Market Value Share and BPS Analysis by Source, 2025 and 2035
  • Figure 39: North America Market Y-o-Y Growth Comparison by Source, 2025-2035
  • Figure 40: North America Market Attractiveness Analysis by Source
  • Figure 41: North America Market Value Share and BPS Analysis by End-Use, 2025 and 2035
  • Figure 42: North America Market Y-o-Y Growth Comparison by End-Use, 2025-2035
  • Figure 43: North America Market Attractiveness Analysis by End-Use
  • Figure 44: North America Market Value Share and BPS Analysis by Nature, 2025 and 2035
  • Figure 45: North America Market Y-o-Y Growth Comparison by Nature, 2025-2035
  • Figure 46: North America Market Attractiveness Analysis by Nature
  • Figure 47: North America Market Value Share and BPS Analysis by Sales Channel, 2025 and 2035
  • Figure 48: North America Market Y-o-Y Growth Comparison by Sales Channel, 2025-2035
  • Figure 49: North America Market Attractiveness Analysis by Sales Channel
  • Figure 50: Latin America Market Value Share and BPS Analysis by Country, 2025 and 2035
  • Figure 51: Latin America Market Value Share and BPS Analysis by Product Type , 2025 and 2035
  • Figure 52: Latin America Market Y-o-Y Growth Comparison by Product Type , 2025-2035
  • Figure 53: Latin America Market Attractiveness Analysis by Product Type
  • Figure 54: Latin America Market Value Share and BPS Analysis by Form, 2025 and 2035
  • Figure 55: Latin America Market Y-o-Y Growth Comparison by Form, 2025-2035
  • Figure 56: Latin America Market Attractiveness Analysis by Form
  • Figure 57: Latin America Market Value Share and BPS Analysis by Source, 2025 and 2035
  • Figure 58: Latin America Market Y-o-Y Growth Comparison by Source, 2025-2035
  • Figure 59: Latin America Market Attractiveness Analysis by Source
  • Figure 60: Latin America Market Value Share and BPS Analysis by End-Use, 2025 and 2035
  • Figure 61: Latin America Market Y-o-Y Growth Comparison by End-Use, 2025-2035
  • Figure 62: Latin America Market Attractiveness Analysis by End-Use
  • Figure 63: Latin America Market Value Share and BPS Analysis by Nature, 2025 and 2035
  • Figure 64: Latin America Market Y-o-Y Growth Comparison by Nature, 2025-2035
  • Figure 65: Latin America Market Attractiveness Analysis by Nature
  • Figure 66: Latin America Market Value Share and BPS Analysis by Sales Channel, 2025 and 2035
  • Figure 67: Latin America Market Y-o-Y Growth Comparison by Sales Channel, 2025-2035
  • Figure 68: Latin America Market Attractiveness Analysis by Sales Channel
  • Figure 69: Western Europe Market Value Share and BPS Analysis by Country, 2025 and 2035
  • Figure 70: Western Europe Market Value Share and BPS Analysis by Product Type , 2025 and 2035
  • Figure 71: Western Europe Market Y-o-Y Growth Comparison by Product Type , 2025-2035
  • Figure 72: Western Europe Market Attractiveness Analysis by Product Type
  • Figure 73: Western Europe Market Value Share and BPS Analysis by Form, 2025 and 2035
  • Figure 74: Western Europe Market Y-o-Y Growth Comparison by Form, 2025-2035
  • Figure 75: Western Europe Market Attractiveness Analysis by Form
  • Figure 76: Western Europe Market Value Share and BPS Analysis by Source, 2025 and 2035
  • Figure 77: Western Europe Market Y-o-Y Growth Comparison by Source, 2025-2035
  • Figure 78: Western Europe Market Attractiveness Analysis by Source
  • Figure 79: Western Europe Market Value Share and BPS Analysis by End-Use, 2025 and 2035
  • Figure 80: Western Europe Market Y-o-Y Growth Comparison by End-Use, 2025-2035
  • Figure 81: Western Europe Market Attractiveness Analysis by End-Use
  • Figure 82: Western Europe Market Value Share and BPS Analysis by Nature, 2025 and 2035
  • Figure 83: Western Europe Market Y-o-Y Growth Comparison by Nature, 2025-2035
  • Figure 84: Western Europe Market Attractiveness Analysis by Nature
  • Figure 85: Western Europe Market Value Share and BPS Analysis by Sales Channel, 2025 and 2035
  • Figure 86: Western Europe Market Y-o-Y Growth Comparison by Sales Channel, 2025-2035
  • Figure 87: Western Europe Market Attractiveness Analysis by Sales Channel
  • Figure 88: Eastern Europe Market Value Share and BPS Analysis by Country, 2025 and 2035
  • Figure 89: Eastern Europe Market Value Share and BPS Analysis by Product Type , 2025 and 2035
  • Figure 90: Eastern Europe Market Y-o-Y Growth Comparison by Product Type , 2025-2035
  • Figure 91: Eastern Europe Market Attractiveness Analysis by Product Type
  • Figure 92: Eastern Europe Market Value Share and BPS Analysis by Form, 2025 and 2035
  • Figure 93: Eastern Europe Market Y-o-Y Growth Comparison by Form, 2025-2035
  • Figure 94: Eastern Europe Market Attractiveness Analysis by Form
  • Figure 95: Eastern Europe Market Value Share and BPS Analysis by Source, 2025 and 2035
  • Figure 96: Eastern Europe Market Y-o-Y Growth Comparison by Source, 2025-2035
  • Figure 97: Eastern Europe Market Attractiveness Analysis by Source
  • Figure 98: Eastern Europe Market Value Share and BPS Analysis by End-Use, 2025 and 2035
  • Figure 99: Eastern Europe Market Y-o-Y Growth Comparison by End-Use, 2025-2035
  • Figure 100: Eastern Europe Market Attractiveness Analysis by End-Use
  • Figure 101: Eastern Europe Market Value Share and BPS Analysis by Nature, 2025 and 2035
  • Figure 102: Eastern Europe Market Y-o-Y Growth Comparison by Nature, 2025-2035
  • Figure 103: Eastern Europe Market Attractiveness Analysis by Nature
  • Figure 104: Eastern Europe Market Value Share and BPS Analysis by Sales Channel, 2025 and 2035
  • Figure 105: Eastern Europe Market Y-o-Y Growth Comparison by Sales Channel, 2025-2035
  • Figure 106: Eastern Europe Market Attractiveness Analysis by Sales Channel
  • Figure 107: East Asia Market Value Share and BPS Analysis by Country, 2025 and 2035
  • Figure 108: East Asia Market Value Share and BPS Analysis by Product Type , 2025 and 2035
  • Figure 109: East Asia Market Y-o-Y Growth Comparison by Product Type , 2025-2035
  • Figure 110: East Asia Market Attractiveness Analysis by Product Type
  • Figure 111: East Asia Market Value Share and BPS Analysis by Form, 2025 and 2035
  • Figure 112: East Asia Market Y-o-Y Growth Comparison by Form, 2025-2035
  • Figure 113: East Asia Market Attractiveness Analysis by Form
  • Figure 114: East Asia Market Value Share and BPS Analysis by Source, 2025 and 2035
  • Figure 115: East Asia Market Y-o-Y Growth Comparison by Source, 2025-2035
  • Figure 116: East Asia Market Attractiveness Analysis by Source
  • Figure 117: East Asia Market Value Share and BPS Analysis by End-Use, 2025 and 2035
  • Figure 118: East Asia Market Y-o-Y Growth Comparison by End-Use, 2025-2035
  • Figure 119: East Asia Market Attractiveness Analysis by End-Use
  • Figure 120: East Asia Market Value Share and BPS Analysis by Nature, 2025 and 2035
  • Figure 121: East Asia Market Y-o-Y Growth Comparison by Nature, 2025-2035
  • Figure 122: East Asia Market Attractiveness Analysis by Nature
  • Figure 123: East Asia Market Value Share and BPS Analysis by Sales Channel, 2025 and 2035
  • Figure 124: East Asia Market Y-o-Y Growth Comparison by Sales Channel, 2025-2035
  • Figure 125: East Asia Market Attractiveness Analysis by Sales Channel
  • Figure 126: South Asia and Pacific Market Value Share and BPS Analysis by Country, 2025 and 2035
  • Figure 127: South Asia and Pacific Market Value Share and BPS Analysis by Product Type , 2025 and 2035
  • Figure 128: South Asia and Pacific Market Y-o-Y Growth Comparison by Product Type , 2025-2035
  • Figure 129: South Asia and Pacific Market Attractiveness Analysis by Product Type
  • Figure 130: South Asia and Pacific Market Value Share and BPS Analysis by Form, 2025 and 2035
  • Figure 131: South Asia and Pacific Market Y-o-Y Growth Comparison by Form, 2025-2035
  • Figure 132: South Asia and Pacific Market Attractiveness Analysis by Form
  • Figure 133: South Asia and Pacific Market Value Share and BPS Analysis by Source, 2025 and 2035
  • Figure 134: South Asia and Pacific Market Y-o-Y Growth Comparison by Source, 2025-2035
  • Figure 135: South Asia and Pacific Market Attractiveness Analysis by Source
  • Figure 136: South Asia and Pacific Market Value Share and BPS Analysis by End-Use, 2025 and 2035
  • Figure 137: South Asia and Pacific Market Y-o-Y Growth Comparison by End-Use, 2025-2035
  • Figure 138: South Asia and Pacific Market Attractiveness Analysis by End-Use
  • Figure 139: South Asia and Pacific Market Value Share and BPS Analysis by Nature, 2025 and 2035
  • Figure 140: South Asia and Pacific Market Y-o-Y Growth Comparison by Nature, 2025-2035
  • Figure 141: South Asia and Pacific Market Attractiveness Analysis by Nature
  • Figure 142: South Asia and Pacific Market Value Share and BPS Analysis by Sales Channel, 2025 and 2035
  • Figure 143: South Asia and Pacific Market Y-o-Y Growth Comparison by Sales Channel, 2025-2035
  • Figure 144: South Asia and Pacific Market Attractiveness Analysis by Sales Channel
  • Figure 145: Middle East & Africa Market Value Share and BPS Analysis by Country, 2025 and 2035
  • Figure 146: Middle East & Africa Market Value Share and BPS Analysis by Product Type , 2025 and 2035
  • Figure 147: Middle East & Africa Market Y-o-Y Growth Comparison by Product Type , 2025-2035
  • Figure 148: Middle East & Africa Market Attractiveness Analysis by Product Type
  • Figure 149: Middle East & Africa Market Value Share and BPS Analysis by Form, 2025 and 2035
  • Figure 150: Middle East & Africa Market Y-o-Y Growth Comparison by Form, 2025-2035
  • Figure 151: Middle East & Africa Market Attractiveness Analysis by Form
  • Figure 152: Middle East & Africa Market Value Share and BPS Analysis by Source, 2025 and 2035
  • Figure 153: Middle East & Africa Market Y-o-Y Growth Comparison by Source, 2025-2035
  • Figure 154: Middle East & Africa Market Attractiveness Analysis by Source
  • Figure 155: Middle East & Africa Market Value Share and BPS Analysis by End-Use, 2025 and 2035
  • Figure 156: Middle East & Africa Market Y-o-Y Growth Comparison by End-Use, 2025-2035
  • Figure 157: Middle East & Africa Market Attractiveness Analysis by End-Use
  • Figure 158: Middle East & Africa Market Value Share and BPS Analysis by Nature, 2025 and 2035
  • Figure 159: Middle East & Africa Market Y-o-Y Growth Comparison by Nature, 2025-2035
  • Figure 160: Middle East & Africa Market Attractiveness Analysis by Nature
  • Figure 161: Middle East & Africa Market Value Share and BPS Analysis by Sales Channel, 2025 and 2035
  • Figure 162: Middle East & Africa Market Y-o-Y Growth Comparison by Sales Channel, 2025-2035
  • Figure 163: Middle East & Africa Market Attractiveness Analysis by Sales Channel
  • Figure 164: Global Market - Tier Structure Analysis
  • Figure 165: Global Market - Company Share Analysis

Frequently Asked Questions

How big is the vegan cheese market in 2025?

The global vegan cheese market is estimated to be valued at USD 3.8 billion in 2025.

What will be the size of vegan cheese market in 2035?

The market size for the vegan cheese market is projected to reach USD 8.9 billion by 2035.

How much will be the vegan cheese market growth between 2025 and 2035?

The vegan cheese market is expected to grow at a 8.9% CAGR between 2025 and 2035.

What are the key product types in the vegan cheese market?

The key product types in vegan cheese market are mozzarella, parmesan, cheddar, cream cheese, ricotta and others.

Which form segment to contribute significant share in the vegan cheese market in 2025?

In terms of form, shreds segment to command 44.3% share in the vegan cheese market in 2025.

Explore Similar Insights

Future Market Insights

Vegan Cheese Market

Chat With MaRIA

Chat With

MaRIA

Hi There, I am MaRIA, Your Market Research Intelligence Assistant. How may I help you?