USA Bubble Tea Market Outlook (2023 to 2033)

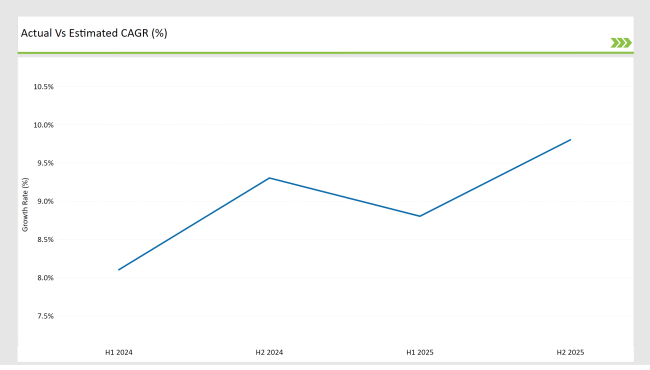
The USA bubble tea market size is forecast to increase from US$ 368.7 million in 2023 to US$ 1,245 million by 2033. Overall bubble tea sales in the United States will rise at 13.% CAGR through 2033. In 2022, the United States bubble tea industry was valued at US$ 329.5 million.

Bubble tea, also known as boba tea or tapioca milk tea, is a Taiwanese tea-based drink that has gained popularity worldwide. Its main ingredients include tea and tapioca balls. It can also be made in a variety of fruit flavors and may contain other toppings such as fruit jelly, popping boba, or pudding.

Bubble tea is a comparatively new market, having originated in Taiwan and spread to places such as the United States over the last 20 years through bubble tea franchises.

Bubble tea's success has spawned a slew of bubble tea-flavored snacks, including bubble tea ice cream and bubble tea candy. Increasing consumption of unique tea and coffee across the USA will boost the bubble tea market

Social media is playing a crucial role in fueling demand for bubble tea in the USA market. It is mostly through social media platforms that more and more Americans are developing an interest in this pearly drink.

Bubble tea is mostly consumed by millennials. A large portion of the United States population considers bubble tea as a healthier alternative to other sugary drinks. This will bolster bubble tea sales during the next ten years.

Availability of a variety of products will also play a key role in expanding the USA bubble tea industry size during the projection period.

Another factor that will boost bubble tea sales in the USA is the rising prevalence of cardiovascular diseases. With Americans becoming more aware of the health benefits of bubble tea, they are showing a keen interest in consuming it.

Demand remains especially high for bubble tea having low sugar content and green tea as its base. This is due to various health benefits that this type of drink offers. For instance, presence of green tea provides a wide array of antioxidants.

Leading players are focusing on launching new variants into the USA market to grab opportunities. For instance, recently the first ready-to-drink called BUBLUV Bubble Tea was introduced by BUBLUV, Inc. The new drink introduced by this New York-based startup contains no artificial ingredients or added sugar.

Attributes Key Insights
Estimated USA Bubble Tea Market Size (2023E) US$ 368.7 million
Projected Market Value (2033F) US$ 1,245 million
Value-based CAGR (2023 to 2033) 13%

Don't pay for what you don't need

Customize your report by selecting specific countries or regions and save 30%!

2018 to 2022 USA Bubble Tea Sales Outlook Compared to Demand Forecast from 2023 to 2033

Historically, from 2018 to 2022, sales of bubble tea across the United States increased at 10% CAGR. Total market size in the USA at the end of 2022 reached US$ 329.5 million. Between 2023 and 2033, bubble tea demand in the USA will increase at 13% CAGR.

Bubble tea was introduced several years ago, but it was not until recently that it gained attention due to information circulated via the internet.

Bubble tea shops started the trend of creating aesthetically pleasing drinks which encouraged consumers to take photos and post them on social media. Despite intense competition, the market continued to offer scope for differentiation, which is fueling the expansion of the bubble tea market in the USA.

Every producer has the opportunity to launch their versions of bubble tea with a variety of toppings and create a brand specialty. For instance, The Alley is known for its brown sugar tapioca pearl bubble tea, while Tiger Sugar’s specialty is its creamy bubble milk tea served with tiger stripes.

The expansion of the bubble tea market is credited to the adoption and improved availability of bubble tea. The bubble tea market in the United States has been steadily expanding with an increasing number of bubble tea shops opening across the country. This growth trend is likely to continue in 2023 as well.

There has also been an increase in the number of non-traditional bubble tea stores, such as cafes and smoothie shops, that offer bubble tea as a beverage option.

It is being observed that manufacturers are engaging to cater to every potential segment. For instance, recently they started offering healthier options to the health-conscious segment.

Various stores have begun to offer sugar-free or reduced-sugar choices while others are substituting natural sweeteners such as honey or agave for traditional sweeteners such as cane sugar.

This development of more natural and healthier bubble drink tea options will play a key role in boosting sales throughout the projection period.

How Convenient and Portable Packaging is Contributing to Market Development in the United States?

Convenience is essential in today’s fast-paced world. While bubble tea can be prepared at home, because of its portable cup and straw packaging, certain people choose to purchase it from their neighborhood bubble tea shop.

Younger shoppers seeking quick and simple solutions are drawn to its portable packing. It is simple to transport and can even be sipped while moving around or traveling.

Neighborhood shops are preferred in the USA for bubble tea-like beverages because these shops can quickly offer fresh tea in an easy-to-carry format. But packaged bubble tea instant kits are likely to gain popularity in areas such as Minnesota, Kansas, and Alaska during the forecast period.

Nandini Roy Choudhury

Principal Consultant

Talk to Analyst

Find your sweet spots for generating winning opportunities in this market.

What is the Outlook of Opportunities for Manufacturers in the USA?

Bubble tea chains are striving to reach a larger consumer base in untapped markets such as Michigan, Minnesota, Kansas, and Alaska to generate sales and increase their revenue.

In certain areas, bubble tea is available in an instant kit format, with the option to add fresh bubble tea.

The high cost of premium products has negatively impacted sales in these states. To reduce costs, companies are focusing on expanding and manufacturing their premium products within these states.

Low bubble tea penetration in certain states, coupled with the high cost of premium products, presents an opportunity for manufacturers to expand into these regions, which have a growing number of young people and colleges.

What are the Restraints Faced by Manufacturers in the USA Market?

Awareness about health issues due to the consumption of sugar is restricting market development to some extent. In 2020, nearly 1.5 million deaths were directly caused by diabetes worldwide.

Bubble tea consists of a little bit more sugar in it, and consumers’ rising awareness about the side effects of excessive sugar consumption is deterring consumers from drinking bubble tea frequently.

Besides this, manufacturers also face challenges in securing raw materials or components due to supply chain disruptions, including transportation issues, natural disasters, and geopolitical tensions.

Similarly, the market is extremely competitive in the USA with numerous manufacturers competing for market share. Individual firms sometimes find it difficult to differentiate themselves or retain pricing power as a result of this.

Get the data you need at a Fraction of the cost

Personalize your report by choosing insights you need
and save 40%!

Category-wise Insights

Which is the Most Popular Drink Type in the USA Bubble Tea Industry?

Pure Drink Remain the Most Popular Drink Type

Among all the drink types, the consumer’s preference for a pure drink has increased over the years. The target segment currently holds a market share of 23.4%. This large market share is due to the fact that it is the most common ready-to-go drink available in the USA.

Pure drink is considered a classic and popular category of bubble tea available in the market. This milk tea with tapioca as a "topping" is popular among many individuals.

Similarly, demand for smoothies is likely to increase during the projection period. The smoothie segment will progress at a healthy CAGR, reaching a valuation of US$ 214.4 million by 2033.

What is Demand for Ready-to-Drink Bubble Tea Rising?

Easy Accessibility and Presence of Various Flavors Driving RTD Bubble Tea Demand

Bubble tea is available in ready-to-drink (RTD) formats as well as instant mixes wherein consumers can blend in the ingredients at home to prepare a glass of their favorite bubble tea.

The ready-to-drink bubble tea segment is set to expand at a lucrative CAGR of 12.9% between 2023 and 2033. The same segment will generate revenues worth US$ 1,010.3 million by 2033.

Ready-to-drink bubble tea is available in a variety of flavors, including traditional milk tea, fruit tea, and herbal tea, making it easier for people to discover a flavor they enjoy. Instant mix, on the other hand, is typically available in only a few fundamental flavors.

Ready-to-drink bubble tea is easily accessible in supermarkets, convenience stores, and online sellers. This makes it simple to locate and buy. Instant mix, on the other hand, is a little bit difficult to locate due to which consumers’ preference for RTD bubble tea has been increasing.

Why are Consumers Preferring Flavored Bubble Tea Over Unflavoured Ones?

Based on flavor, the market is divided into unflavored and flavored segments. Among these, consumers prefer flavored bubble tea due to its unique taste.

Taste is one of the main reasons consumers prefer flavored bubble tea over unflavoured ones. It gives a distinct and enjoyable flavor to the drink, improving the overall experience. The flavor can also be used to mask any bitterness present in the tea.

Demand for flavored bubble tea in the USA is forecast to rise at a robust CAGR of 13.5% through 2033. Within flavored category, chocolate and fruit-flavored bubble tea are in more demand while nut-flavored and mocha are the least preferred bubble teas.

Why are the Sales of Sugar-Free Bubble Tea Rising Across the United States?

Rising Prevalence of Lifestyle Diseases Such as Diabetes Fueling Sugar-Free Bubble Tea Sales

As per Future Market Insights, reduced sugar/sugar-free bubble tea segment will expand at 14.4% CAGR. Overall sales of sugar/sugar-free bubble tea will total a valuation of US$ 434.4 million in 2033.

Increasing incidence of lifestyle diseases such as diabetes is a key factor prompting consumers to opt for sugar/sugar-free bubble tea.

Various customers could have dietary restrictions that require them to prevent or limit their sugar consumption. People with diabetes or other health conditions, for example, need to limit their sugar intake, and sugar-free or low-sugar options enable them to enjoy bubble tea without jeopardizing their health.

Similarly, bubble tea shops and brands are increasingly promoting their sugar-free or reduced-sugar options, which is helping to raise awareness and generate interest among consumers. As a result, more people are willing to try these options and are finding that they enjoy them.

Competitive Landscape

Earlier product portfolios were less diverse, but as time has passed and product demand has increased, key players are focussing on new product formation. Similarly, the growing online presence of B2B suppliers is benefiting them to spread awareness about their authentic ingredients resulting in reaching out to their end-user customers.

Suppliers are also focussing on unique packaging material as end-to-end solutions such as spill-proof cups, lids, and straws. Further, they are adopting strategies such as mergers, acquisitions, partnerships, facility expansions, and collaborations, and firming up distribution channels to expand their global sales footprint.

Recent Developments

  • In 2021, Gong cha extended its bubble tea offerings with the launch of Chocolate Lava Series and the Heart Shaped Jelly Series. These implementations are part of the company's efforts to expand its market footprint across countries such as the USA and Canada.
  • In 2022, Inspire Food Company launched its brand-new online store for premium bubble tea products in the USA, which will also have a physical presence in the country. The store will feature a range of products made specifically for the American market, including tapioca pearls, tea powders, and various sizes and flavors of exploding boba fruit pearls. These products are suitable for both home use and service establishments.

Scope of the Report

Attribute Details
Estimated Market Value (2023) US$ 368.7 million
Projected Market Value (2033) US$ 1,245 million
Anticipated Growth Rate (2023 to 2033) 13% CAGR
Forecast Period 2023 to 2033
Historical Data Available for 2018 to 2022
Market Analysis US$ million for Value
Key Countries Covered USA
Key Segments Covered Drink Type, Distributional Channel, Format, Flavor, Sugar Content
Key Companies Profiled CoCo Fresh Tea & Juice; Gong Cha; Kung Fu Tea; Lollicup USA; Quickly; Tiger Sugar; Sharetea; Boba Guys; Tapioca Express; La Kaffa International Co; Ten Ren Tea Co., Ltd.; DaBoba; Happy Lemon Bubble Tea; Yifang USA Inc.; Bubbleology; Del Monte Foods Inc; Boba Loca; J Way Foods; 7 Leaves Café; Jazen Tea
Report Coverage Company Share Analysis, Drivers Restraints Opportunity Trends Analysis, Market Forecast, Competition Intelligence, Strategic Growth Initiatives and Market Dynamics, Challenges

USA Bubble Tea Market by Category

By Drink Type:

  • Pure Drink
  • Fruit Tea
  • Milk Tea
  • Smoothie
  • Slush
  • Others (Yogurt, Soda and Water Based)

By Format:

  • Ready to Drink (RTD)
  • Instant Mixes

By Flavor:

  • Unflavored
  • Flavored

By Sugar Content:

  • Regular
  • Reduced Sugar/Sugar Free

By Distributional Channel:

  • Food Service Industry
  • Indirect (B2C) Retail
  • Online Retailing

Frequently Asked Questions

How Big is the Bubble Tea Market in the USA?

The bubble tea market in the USA is currently valued at US$ 368.7 million in 2023.

What is the Future Outlook for USA Bubble Tea Market?

The USA bubble tea market is anticipated to surge to US$ 1,245 million, exhibiting a CAGR of 13% through 2033.

What is the Predominant Drink Type in the USA Bubble Tea Market?

Pure drink is the predominant drink type in the USA bubble tea market.

What are the Prevailing Trends Shaping the USA Bubble Tea Market Landscape?

Prevailing trends in the market include the introduction of unique flavors and an increasing focus on health-conscious ingredients.

Which Leading Businesses Command a Large Portion of the USA Bubble Tea Market?

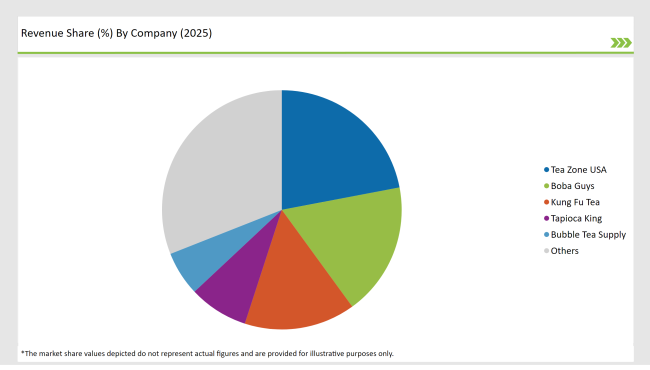
Prominent market players such as CoCo Fresh Tea & Juice, Gong Cha, Kung Fu Tea, Lollicup USA, and Quickly dominate the USA bubble tea market.

Table of Content

1. Executive Summary | USA Bubble Tea Market

    1.1. USA Bubble Tea Market Outlook

    1.2. Share analysis by segments

    1.3. Drivers, Challenges and Trends

    1.4. Wheel of Fortune

    1.5. Analysis and Recommendations

2. Market Overview

    2.1. Market Coverage / Taxonomy

    2.2. Market Definition

3. Market Dynamics

    3.1. Drivers

        3.1.1. Supply Side Drivers

        3.1.2. Demand Side drivers

        3.1.3. Economic Side Drivers

    3.2. Restraints

    3.3. Opportunity

    3.4. Market trends By Region

    3.5. Forecast Factors - Relevance & Impact

    3.6. Packaging & Labelling Regulations

    3.7. Regulatory Landscape

4. Value Chain Analysis

    4.1. Operating margins at each node of the supply chain

    4.2. List of Active Market Participants

5. USA - Pricing Analysis

    5.1. Price Point Assessment by Region

        5.1.1. Manufacturer-Level Pricing

        5.1.2. Distributor Level Pricing

    5.2. Price Point Assessment By Product

    5.3. Price Forecast till 2033

6. USA Bubble Tea Market Size (in Value (US$ million) and Volume (MT) Analysis 2018 to 2022 and Forecast, 2023 to 2033

    6.1. Historical Market Size (in Value (US$ million) and Volume (MT) Analysis, 2018 to 2022

    6.2. Current and Future Market Size (in Value (US$ million) and Volume (MT) Analysis, 2023 to 2033

        6.2.1. Y-o-Y Growth Trend Analysis

        6.2.2. Absolute $ Opportunity Analysis

7. USA Bubble Tea Market Analysis 2018 to 2022 and Forecast 2023 to 2033, By Drink Type

    7.1. Introduction / Key Findings

    7.2. Historical Market Size (in Value (US$ million) and Volume (MT) Analysis By Drink Type, 2018 to 2022

    7.3. Current and Future Market Size (in Value (US$ million) and Volume (MT) Analysis and Forecast By Drink Type, 2023 to 2033

        7.3.1. Pure Drink

        7.3.2. Fruit Tea

        7.3.3. Milk Tea

        7.3.4. Smoothie

        7.3.5. Slush

        7.3.6. Others (Yogurt, Soda and Water Based)

    7.4. Market Attractiveness Analysis By Drink Type

8. USA Bubble Tea Market Analysis 2018 to 2022 and Forecast 2023 to 2033, By Format

    8.1. Introduction / Key Findings

    8.2. Historical Market Size (in Value (US$ million) and Volume (MT) Analysis By Format, 2018 to 2022

    8.3. Current and Future Market Size (in Value (US$ million) and Volume (MT) Analysis and Forecast By Format, 2023 to 2033

        8.3.1. Ready to Drink (RTD)

        8.3.2. Instant Mixes

    8.4. Market Attractiveness Analysis By Format

9. USA Bubble Tea Market Analysis 2018 to 2022 and Forecast 2023 to 2033, By Flavor

    9.1. Introduction / Key Findings

    9.2. Historical Market Size (in Value (US$ million) and Volume (MT) Analysis By Flavor, 2018 to 2022

    9.3. Current and Future Market Size (in Value (US$ million) and Volume (MT) Analysis and Forecast By Flavor, 2023 to 2033

        9.3.1. Unflavored

        9.3.2. Flavored

    9.4. Market Attractiveness Analysis By Flavor

10. USA Bubble Tea Market Analysis 2018 to 2022 and Forecast 2023 to 2033, By Sugar Content

    10.1. Introduction / Key Findings

    10.2. Historical Market Size (in Value (US$ million) and Volume (MT) Analysis By Sugar Content, 2018 to 2022

    10.3. Current and Future Market Size (in Value (US$ million) and Volume (MT) Analysis and Forecast By Sugar Content, 2023 to 2033

        10.3.1. Regular

        10.3.2. Reduced Sugar/Sugar-Free

    10.4. Market Attractiveness Analysis By Sugar Content

11. USA Bubble Tea Market Analysis 2018 to 2022 and Forecast 2023 to 2033, By Distribution Channel

    11.1. Introduction / Key Findings

    11.2. Historical Market Size (in Value (US$ million) and Volume (MT) Analysis By Distribution Channel, 2018 to 2022

    11.3. Current and Future Market Size (in Value (US$ million) and Volume (MT) Analysis and Forecast By Distribution Channel, 2023 to 2033

        11.3.1. Food Service Industry

        11.3.2. Indirect (B2C) Retail

        11.3.3. Online Retailing

    11.4. Market Attractiveness Analysis By Distribution Channel

12. Market Structure Analysis

    12.1. USA Competition - a Dashboard View

    12.2. Industry Structure Analysis

        12.2.1. % tier 1 market players

        12.2.2. % tier 2 market players

        12.2.3. % tier 3 market players

    12.3. USA Bubble Tea Market Company Share Analysis

        12.3.1. For Tier 1 Market Players, 2023

        12.3.2. Company Market Share Analysis of Top 5 Players, By Region

    12.4. Key Participants Market Presence (Intensity Mapping) by Region

13. Competition Analysis

    13.1. Competition Dashboard

    13.2. Competition Benchmarking

    13.3. Competition Deep Dive

        13.3.1. La Kaffa International Co.

            13.3.1.1. Product Portfolio

            13.3.1.2. Product Claim

            13.3.1.3. Revenue by Market Segments (Product /Channel /Region)

            13.3.1.4. Sales Footprint

            13.3.1.5. Strategy Overview

                13.3.1.5.1. Marketing Strategy

                13.3.1.5.2. Product Strategy

                13.3.1.5.3. Channel Strategy

            13.3.1.6. SWOT Analysis

        13.3.2. Royal CoCo Fresh Tea & Juice

            13.3.2.1. Product Portfolio

            13.3.2.2. Product Claim

            13.3.2.3. Revenue by Market Segments (Product /Channel /Region)

            13.3.2.4. Sales Footprint

            13.3.2.5. Strategy Overview

                13.3.2.5.1. Marketing Strategy

                13.3.2.5.2. Product Strategy

                13.3.2.5.3. Channel Strategy

            13.3.2.6. SWOT Analysis

        13.3.3. Gong Cha

            13.3.3.1. Product Portfolio

            13.3.3.2. Product Claim

            13.3.3.3. Revenue by Market Segments (Product /Channel /Region)

            13.3.3.4. Sales Footprint

            13.3.3.5. Strategy Overview

                13.3.3.5.1. Marketing Strategy

                13.3.3.5.2. Product Strategy

                13.3.3.5.3. Channel Strategy

            13.3.3.6. SWOT Analysis

        13.3.4. Kung Fu Tea

            13.3.4.1. Product Portfolio

            13.3.4.2. Product Claim

            13.3.4.3. Revenue by Market Segments (Product /Channel /Region)

            13.3.4.4. Sales Footprint

            13.3.4.5. Strategy Overview

                13.3.4.5.1. Marketing Strategy

                13.3.4.5.2. Product Strategy

                13.3.4.5.3. Channel Strategy

            13.3.4.6. SWOT Analysis

        13.3.5. Lollicup USA

            13.3.5.1. Product Portfolio

            13.3.5.2. Product Claim

            13.3.5.3. Revenue by Market Segments (Product /Channel /Region)

            13.3.5.4. Sales Footprint

            13.3.5.5. Strategy Overview

                13.3.5.5.1. Marketing Strategy

                13.3.5.5.2. Product Strategy

                13.3.5.5.3. Channel Strategy

            13.3.5.6. SWOT Analysis

        13.3.6. Tiger Sugar

            13.3.6.1. Product Portfolio

            13.3.6.2. Product Claim

            13.3.6.3. Revenue by Market Segments (Product /Channel /Region)

            13.3.6.4. Sales Footprint

            13.3.6.5. Strategy Overview

                13.3.6.5.1. Marketing Strategy

                13.3.6.5.2. Product Strategy

                13.3.6.5.3. Channel Strategy

            13.3.6.6. SWOT Analysis

        13.3.7. Sharetea

            13.3.7.1. Product Portfolio

            13.3.7.2. Product Claim

            13.3.7.3. Revenue by Market Segments (Product /Channel /Region)

            13.3.7.4. Sales Footprint

            13.3.7.5. Strategy Overview

                13.3.7.5.1. Marketing Strategy

                13.3.7.5.2. Product Strategy

                13.3.7.5.3. Channel Strategy

            13.3.7.6. SWOT Analysis

        13.3.8. Boba Guys

            13.3.8.1. Product Portfolio

            13.3.8.2. Product Claim

            13.3.8.3. Revenue by Market Segments (Product /Channel /Region)

            13.3.8.4. Sales Footprint

            13.3.8.5. Strategy Overview

                13.3.8.5.1. Marketing Strategy

                13.3.8.5.2. Product Strategy

                13.3.8.5.3. Channel Strategy

            13.3.8.6. SWOT Analysis

        13.3.9. Tapioca Express

            13.3.9.1. Product Portfolio

            13.3.9.2. Product Claim

            13.3.9.3. Revenue by Market Segments (Product /Channel /Region)

            13.3.9.4. Sales Footprint

            13.3.9.5. Strategy Overview

                13.3.9.5.1. Marketing Strategy

                13.3.9.5.2. Product Strategy

                13.3.9.5.3. Channel Strategy

            13.3.9.6. SWOT Analysis

        13.3.10. Ten Ren Tea Co., Ltd.

            13.3.10.1. Product Portfolio

            13.3.10.2. Product Claim

            13.3.10.3. Revenue by Market Segments (Product /Channel /Region)

            13.3.10.4. Sales Footprint

            13.3.10.5. Strategy Overview

                13.3.10.5.1. Marketing Strategy

                13.3.10.5.2. Product Strategy

                13.3.10.5.3. Channel Strategy

            13.3.10.6. SWOT Analysis

        13.3.11. DaBoba

            13.3.11.1. Product Portfolio

            13.3.11.2. Product Claim

            13.3.11.3. Revenue by Market Segments (Product /Channel /Region)

            13.3.11.4. Sales Footprint

            13.3.11.5. Strategy Overview

                13.3.11.5.1. Marketing Strategy

                13.3.11.5.2. Product Strategy

                13.3.11.5.3. Channel Strategy

            13.3.11.6. SWOT Analysis

        13.3.12. Happy Lemon Bubble Tea

            13.3.12.1. Product Portfolio

            13.3.12.2. Product Claim

            13.3.12.3. Revenue by Market Segments (Product /Channel /Region)

            13.3.12.4. Sales Footprint

            13.3.12.5. Strategy Overview

                13.3.12.5.1. Marketing Strategy

                13.3.12.5.2. Product Strategy

                13.3.12.5.3. Channel Strategy

            13.3.12.6. SWOT Analysis

        13.3.13. Yifang USA Inc.

            13.3.13.1. Product Portfolio

            13.3.13.2. Product Claim

            13.3.13.3. Revenue by Market Segments (Product /Channel /Region)

            13.3.13.4. Sales Footprint

            13.3.13.5. Strategy Overview

                13.3.13.5.1. Marketing Strategy

                13.3.13.5.2. Product Strategy

                13.3.13.5.3. Channel Strategy

            13.3.13.6. SWOT Analysis

        13.3.14. Bubbleology

            13.3.14.1. Product Portfolio

            13.3.14.2. Product Claim

            13.3.14.3. Revenue by Market Segments (Product /Channel /Region)

            13.3.14.4. Sales Footprint

            13.3.14.5. Strategy Overview

                13.3.14.5.1. Marketing Strategy

                13.3.14.5.2. Product Strategy

                13.3.14.5.3. Channel Strategy

            13.3.14.6. SWOT Analysis

        13.3.15. Del Monte Foods Inc

            13.3.15.1. Product Portfolio

            13.3.15.2. Product Claim

            13.3.15.3. Revenue by Market Segments (Product /Channel /Region)

            13.3.15.4. Sales Footprint

            13.3.15.5. Strategy Overview

                13.3.15.5.1. Marketing Strategy

                13.3.15.5.2. Product Strategy

                13.3.15.5.3. Channel Strategy

            13.3.15.6. SWOT Analysis

        13.3.16. Boba Loca

            13.3.16.1. Product Portfolio

            13.3.16.2. Product Claim

            13.3.16.3. Revenue by Market Segments (Product /Channel /Region)

            13.3.16.4. Sales Footprint

            13.3.16.5. Strategy Overview

                13.3.16.5.1. Marketing Strategy

                13.3.16.5.2. Product Strategy

                13.3.16.5.3. Channel Strategy

            13.3.16.6. SWOT Analysis

        13.3.17. J Way Foods

            13.3.17.1. Product Portfolio

            13.3.17.2. Product Claim

            13.3.17.3. Revenue by Market Segments (Product /Channel /Region)

            13.3.17.4. Sales Footprint

            13.3.17.5. Strategy Overview

                13.3.17.5.1. Marketing Strategy

                13.3.17.5.2. Product Strategy

                13.3.17.5.3. Channel Strategy

            13.3.17.6. SWOT Analysis

        13.3.18. 7 Leaves Café

            13.3.18.1. Product Portfolio

            13.3.18.2. Product Claim

            13.3.18.3. Revenue by Market Segments (Product /Channel /Region)

            13.3.18.4. Sales Footprint

            13.3.18.5. Strategy Overview

                13.3.18.5.1. Marketing Strategy

                13.3.18.5.2. Product Strategy

                13.3.18.5.3. Channel Strategy

            13.3.18.6. SWOT Analysis

        13.3.19. Jazen Tea

            13.3.19.1. Product Portfolio

            13.3.19.2. Product Claim

            13.3.19.3. Revenue by Market Segments (Product /Channel /Region)

            13.3.19.4. Sales Footprint

            13.3.19.5. Strategy Overview

                13.3.19.5.1. Marketing Strategy

                13.3.19.5.2. Product Strategy

                13.3.19.5.3. Channel Strategy

            13.3.19.6. SWOT Analysis

        13.3.20. Other Players (On Additional Requests)

            13.3.20.1. Product Portfolio

            13.3.20.2. Product Claim

            13.3.20.3. Revenue by Market Segments (Product /Channel /Region)

            13.3.20.4. Sales Footprint

            13.3.20.5. Strategy Overview

                13.3.20.5.1. Marketing Strategy

                13.3.20.5.2. Product Strategy

                13.3.20.5.3. Channel Strategy

            13.3.20.6. SWOT Analysis

14. Assumptions and Acronyms Used

15. Research Methodology

Recommendations

Food and Beverage

Ready To Drink (RTD) Tea Market

May 2023

REP-GB-14341

342 pages

Food and Beverage

Tapioca Market

January 2023

REP-GB-16378

346 pages

Food and Beverage

Ready to Drink Shakes Market

July 2022

REP-GB-11120

350 pages

Food and Beverage

Tapioca Pearls Market

July 2022

REP-GB-9345

250 pages

Explore Food and Beverage Insights

View Reports
Future Market Insights

USA Bubble Tea Market

Schedule a Call