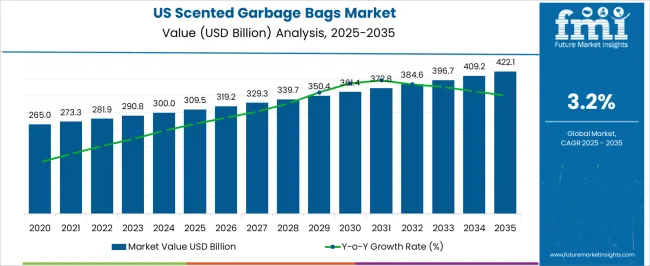
The United States Scented Garbage Bags Market is estimated to be valued at USD 309.5 billion in 2025 and is projected to reach USD 422.1 billion by 2035, registering a compound annual growth rate (CAGR) of 3.2% over the forecast period.
| Metric | Value |
|---|---|
| United States Scented Garbage Bags Market Estimated Value in (2025 E) | USD 309.5 billion |
| United States Scented Garbage Bags Market Forecast Value in (2035 F) | USD 422.1 billion |
| Forecast CAGR (2025 to 2035) | 3.2% |
The United States scented garbage bags market is experiencing consistent growth supported by rising consumer preference for convenience driven household products and increased emphasis on odor control solutions. Demand has been further encouraged by urban population growth, higher waste generation rates, and the adoption of fragranced and value added home care products.
Innovation in biodegradable and recyclable polyethylene based bags has aligned with sustainability goals while catering to odor neutralization needs. Branding and packaging differentiation in the retail space have strengthened product visibility and consumer loyalty.
Additionally, e commerce penetration and private label expansion by large retailers are contributing to market accessibility. The outlook remains positive as consumer spending on premium and eco friendly household consumables continues to rise, providing growth opportunities for both established players and emerging private brands.
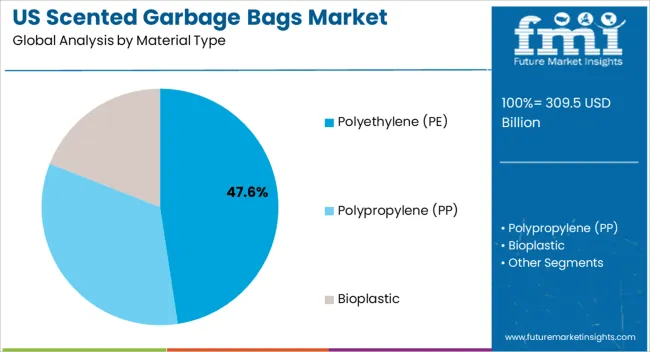
The polyethylene material type segment is expected to hold 47.60% of total market revenue by 2025, making it the dominant category. This leadership is supported by its durability, cost effectiveness, and wide availability, which collectively enhance its suitability for mass production and everyday household use.
Polyethylene offers strength, puncture resistance, and flexibility that consumers value in scented garbage bags. Additionally, the material’s adaptability with fragrance infusion and biodegradable formulations has further reinforced its widespread adoption.
Continuous innovation in recyclable and compostable polyethylene blends is also contributing to the sustained dominance of this material type.
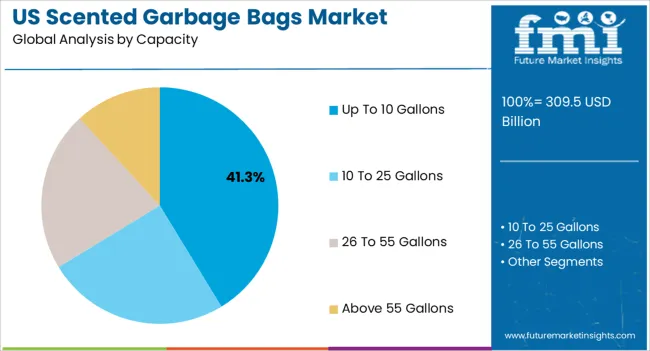
The up to 10 gallons capacity segment is projected to capture 41.30% of the total market by 2025, positioning it as the leading capacity category. This growth is driven by strong consumer demand for small sized garbage bags used in kitchens, bathrooms, and offices.
Their convenience, ease of storage, and affordability have made them a preferred choice in urban households with limited space. Retailers have responded with expanded product ranges and multi pack offerings to meet daily household needs.
The segment’s alignment with both premium fragranced variants and private label economy products has solidified its widespread presence in the market.
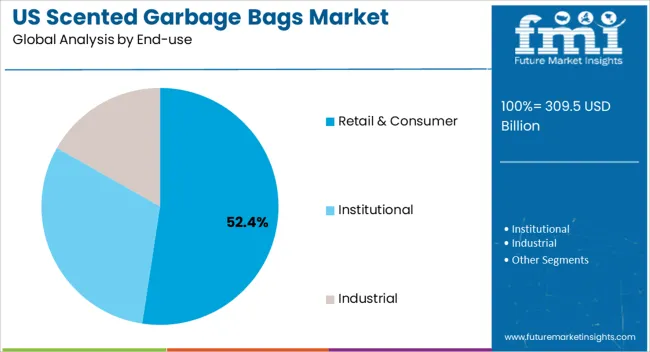
The retail and consumer segment is projected to hold 52.40% of total market revenue by 2025, making it the dominant end use category. Growth is being driven by rising household adoption of scented garbage bags as part of routine hygiene and waste management practices.
Retail shelf visibility, aggressive promotions, and the availability of diverse fragrance options have further supported consumer uptake. Expansion of private label offerings and the shift toward convenient subscription models via online platforms are adding to the segment’s momentum.
As household consumers continue to prioritize odor control and convenience in waste disposal, the retail and consumer segment will remain central to overall market growth.
| Attributes | Key Insights |
|---|---|
| Market Size 2025 | USD 290.6 million |
| Market Size 2035 | USD 386.1 million |
| Value-based CAGR (2025 to 2035) | 3.3% |
| Collective Value Share: Top 5 Companies (2025A) | 70 to 75% |
The scented waste bags market in the United States is predicted to rise at a rapid pace during the forecast period. Sales of scented garbage bags in the United States are projected to increase between 2025 and 2035 to create a lucrative opportunity for incremental revenues of USD 95.5 million.
The United States scented garbage bags industry registered a CAGR of 3% during the historic period 2020 to 2025. It reached a market value of USD 309.5 million in 2025 from USD 265 million in 2020.
Scented garbage bags are specially designed bags that have scent-infused ingredients in them. These bags help control odors and maintain a pleasant smell in the surrounding environment.
Scented garbage bags often contain a baking soda derivative powdered on the surface and a scented ingredient in the resin. Fragrances are injected between layers to help with odor control during the disposal process.
Consumers are becoming more discerning and are looking for ways to improve their quality of life. Scented garbage bags provide a convenient way to maintain a clean and fresh-smelling home. This has made them increasingly popular among consumers across the United States.
Growing attention to reducing the risk of disease spread, and proper waste disposal, is critical in preventing the spread of infectious diseases. Scented garbage bags can help control the odors that attract disease-carrying pests. This has led to an increased demand for scented garbage bags among consumers who are looking for ways to maintain a hygienic home environment.
Effective solid and other waste disposal methods have also become a prominent focus in the United States. The government has introduced regulations to encourage proper waste management practices.
This has led to an increased demand for products such as scented garbage bags across the country. These bags provide a convenient and effective way to dispose waste while controlling unpleasant odors. This lends to their significant popularity among consumers.
The United States government has implemented multiple regulations and policies to promote eco-friendly waste management practices. This includes limiting the amount of waste that goes to landfills and encouraging recycling. This has made a large share of Americans more conscious of their waste disposal habits.
Consumers are looking for ways to reduce waste and minimize environmental impact. It has led to an increased demand for scented garbage bags across the country. These bags can efficiently reduce unpleasant odors from garbage and encourage consumers to dispose of their waste through proper methods.
Several government agencies, such as the Environmental Protection Agency (EPA), have encouraged the use of eco-friendly products. These include biodegradable and recycled materials, to reduce waste and promote sustainable practices.
Scented garbage bags made from bioplastics and PE materials can meet regulatory requirements and also appeal to environmentally conscious consumers. Consumers looking for ways to reduce their environmental footprint can now opt for scented garbage bags as they become more easily accessible.
Growing Awareness Regarding Proper Waste Management in the United States to Boost Sales
According to the United States Environmental Protection Agency, the total quantity of municipal solid waste (MSW) produced in the United States in 2020 was registered at 265 million tons per day. This is a rise over the 268.7 million tons produced per day in 2020.
The United States has high standard of living, which means there is a strong demand for convenient and effective waste management solutions. Scented garbage bags provide a hassle-free way to dispose of garbage while controlling unpleasant odors, making them an appealing option for consumers.
Growing awareness regarding the importance of proper waste management practices in preventing the spread of infectious disease is anticipated to be a key driving factor. These developments is likely to further fuel the scented garbage bags market in the United States to grow at 3.3% CAGR through 2035.
Demand for Polyethylene (PE) to Remain High from Manufacturers
Based on material type, polyethylene (PE) is set to hold a mammoth share of about 69.1% in the United States market by 2035. This is due to its superior tear-resistance and durability.
Polyethylene is easy to scent with fragrances, making it an ideal material for producing scented trash bags. The scent can be added during the manufacturing process, ensuring that the smell is evenly distributed throughout the bag.
Adoption of Scented Garbage Bags in the Retail & Consumer Sector to Grow Exponentially
The retail & consumer segment is projected to hold approximately 51.1% shares in the United States scented garbage bags industry by 2035. Scented garbage bags are frequently used for waste storage and disposal because they help reduce odor from stored garbage.
Increasing consumer awareness regarding hygiene and cleanliness in homes is expected to drive demand for scented garbage bags during the projected period. With increasing urbanization and apartment living, there is a growing demand for products that help to control odors in small, urban living spaces.
Scented trash bags offer a practical and convenient solution for consumers living in apartments or small homes. These factors will help in supporting market growth over the forecast period.
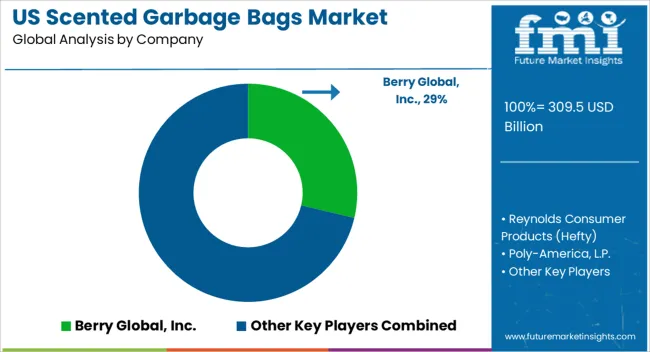
Key companies in the United States scented garbage bags industry are concentrating on developing sustainable solutions through innovation. They are investing in research and development to create bags with unique features. It includes enhanced odor-blocking properties, long-lasting fragrance, and eco-friendly measures.
They are also providing options in terms of bag size, fragrance, and special features. This approach allows them to capture a large market share to cater to a diverse customer base.
| Attribute | Details |
|---|---|
| Growth Rate | CAGR of 3.2% from 2025 to 2035 |
| Base Year for Estimation | 2025 |
| Historical Data | 2020 to 2025 |
| Forecast Period | 2025 to 2035 |
| Quantitative Units | Revenue in USD million, Volume in Units and CAGR from 2025 to 2035 |
| Report Coverage | Revenue Forecast, Volume Forecast, Company Ranking, Competitive Landscape, Growth Factors, Trends and Pricing Analysis |
| Segments Covered | Material, Capacity, End-use |
| Key Companies Profiled | Berry Global, Inc.; Reynolds Consumer Products (Hefty); Poly-America, L.P.; Presto Products Company; BeyondGREEN biotech, Inc.; Universal Plastic Bag Manufacturing Co.; American Plastic Mfg., Inc.; International Plastics, Inc; Four Star Plastics; American Plastics Company; Harwal Group of Companies |
The global United States scented garbage bags market is estimated to be valued at USD 309.5 billion in 2025.
The market size for the United States scented garbage bags market is projected to reach USD 422.1 billion by 2035.
The United States scented garbage bags market is expected to grow at a 3.2% CAGR between 2025 and 2035.
The key product types in United States scented garbage bags market are polyethylene (pe), _high-density polyethylene (hdpe), _low-density polyethylene (ldpe), _linear-low density polyethylene (lldpe), polypropylene (PP) and bioplastic.
In terms of capacity, up to 10 gallons segment to command 41.3% share in the United States scented garbage bags market in 2025.


Full Research Suite comprises of:
Market outlook & trends analysis
Interviews & case studies
Strategic recommendations
Vendor profiles & capabilities analysis
5-year forecasts
8 regions and 60+ country-level data splits
Market segment data splits
12 months of continuous data updates
DELIVERED AS:
PDF EXCEL ONLINE
United Kingdom Interesterified Fats Market Size and Share Forecast Outlook 2025 to 2035
United Kingdom Car Rental Market Analysis – Growth, Applications & Outlook 2025–2035
United Kingdom (UK) Veneered Panels Market Analysis & Insights for 2025 to 2035
United Kingdom Women's Footwear Market Trends-Growth & Industry Outlook 2025 to 2035
United Kingdom Automotive Turbocharger Market Outlook – Share, Growth & Forecast 2025–2035
United Kingdom Yeast Market Analysis – Size, Share & Forecast 2025–2035
United Kingdom Green and Bio-based Polyol Market Analysis – Size, Share & Forecast 2025–2035
United Kingdom Natural Food Color Market Outlook – Share, Growth & Forecast 2025–2035
United Kingdom Coated Fabrics Market Insights – Demand, Size & Industry Trends 2025–2035
United Kingdom Barite Market Analysis – Size, Share & Forecast 2025–2035
United Kingdom Compact Construction Equipment Market Growth – Trends, Demand & Innovations 2025–2035
UK Curtain Walling Market Report - Growth, Demand & Forecast 2025 to 2035
United Kingdom Flare Gas Recovery System Market Analysis – Size, Share & Forecast 2025–2035
United Kingdom Electric Golf Cart Market Growth – Demand, Trends & Forecast 2025–2035
United Kingdom Magnetic Separator Market Analysis – Size, Share & Forecast 2025-2035
UK River Cruise Market Analysis - Growth & Forecast 2025 to 2035
Competitive Breakdown of the United Kingdom Car Rental Market
United Kingdom Respiratory Inhaler Devices Market Growth – Demand, Trends & Forecast 2025 to 2035
United Kingdom Generic Injectable Market Trends – Size, Share & Growth 2025-2035
United Kingdom Zeolite for Detergent Market Analysis – Growth, Applications & Outlook 2025-2035

Thank you!
You will receive an email from our Business Development Manager. Please be sure to check your SPAM/JUNK folder too.
Chat With
MaRIA