
- Market Size (2026)
- USD 20.4 Bn
- Forecast (2036)
- USD 33.0 Bn
- CAGR (2026 to 2036)
- 4.9%
How big is the USA Boutique Hotel Market in 2026?
Revenue in the USA Boutique Hotel Market is projected to reach USD 33.0 billion by 2036. FMI estimates the 2026 value at USD 20.4 billion, which implies a 4.9% CAGR over 2026 to 2036.
The market was valued at USD 19.5 billion in 2025. Boutique revenue is set to outpace the wider hotel industry, where national RevPAR declined in 2025 according to the New York State Comptroller. The difference comes from pricing power. Boutique hotels sell location, design and dining to higher-income leisure households. The U.S. Travel Association identifies this group as the driver of 2026 travel spending. Distinctive brands are capturing a larger part of rate growth as a result. Hilton reported third-quarter 2026 RevPAR growth of 10.4% at its Graduate brand against 5.8% across its whole system.
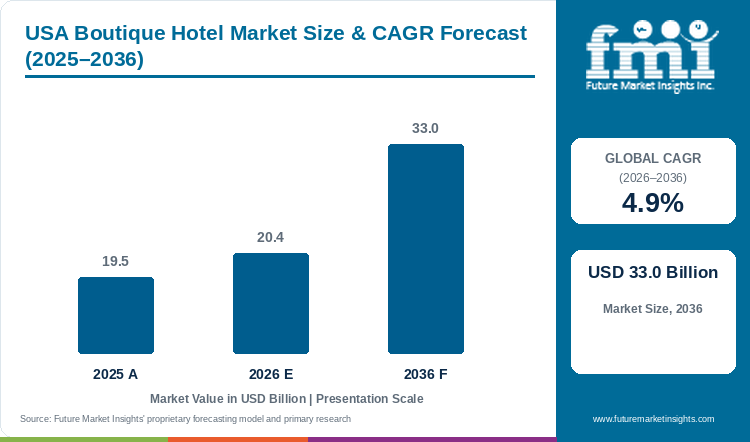
New supply is slow to arrive, which supports rates at existing hotels and pushes growth towards conversions of older buildings. The main limitation is foreign demand, as international arrivals fell 5.5% to 68.3 million in 2025. Labour cost is a second constraint, since average hotel salaries have risen 35.5% since 2019. Domestic leisure demand and its willingness to pay premium rates will therefore determine revenue over the forecast period.
Key Market Trends & Insights
- Room rate is generating most of the revenue growth at distinctive properties. Pebblebrook Hotel Trust reported third-quarter 2026 same-property RevPAR growth of 8.3%, with average daily rate up 7.0% and occupancy up 1.2%. Its resort food and beverage revenue rose 11.2% in the same quarter. Owners can therefore lift revenue per available room without adding inventory, which favours renovation spend over new construction.
- Independent hotels are joining soft-brand collections to access loyalty demand. Marriott's Autograph Collection had 169 properties and 38,737 rooms in the United States and Canada at the end of 2025. Loyalty members booked about 75.0% of the group's U.S. room nights that year. As a result, unaffiliated boutique owners compete against a large pool of captive demand.
- Conversion brands are extending boutique supply into new cities. Hyatt raised its U.S. signings by 30.0% in 2025, and half of those deals were in markets new to the company. Its Unscripted conversion brand offers owners the lightest-touch route into the system. Conversions bring boutique rooms to market faster than ground-up projects, which shortens the payback period for owners.
Regional Highlights
- In the Southern United States, road-trip leisure continues to expand. Tennessee recorded record visitor spending of USD 32.5 billion in 2025, up 2.7% against a national rate of 1.9%. Drive-to demand limits exposure to visa costs and airfare increases for boutique hotels near large cities.
- In the Western United States, coastal leisure and recovering city demand both support rates. California recorded record visitor spending of USD 158.9 billion in 2025, and San Francisco visitor spending passed its pre-pandemic high. Recovering urban demand reopens weekday revenue for city boutique hotels that relied on leisure weekends.
USA Boutique Hotel Market Size and Forecast
Table 1: USA Boutique Hotel Market Size and Forecast
| Market size and forecast | Value |
|---|---|
| Market size in 2025 | USD 19.5 billion |
| Estimated market size in 2026 | USD 20.4 billion |
| Projected market size by 2036 | USD 33.0 billion |
| CAGR from 2026 to 2036 | 4.9% |
Analyst Perspective
“Boutique hotel demand is selected on location, design and food and beverage quality. Guests benchmark the total price against branded alternatives before booking. Operator differentiation rests on a food and beverage offer that raises spend per stay and on a collection affiliation that delivers loyalty demand. Cost is the main barrier to growth because wage settlements and renovation budgets weigh hardest on small hotels that cannot spread fixed costs across many rooms.”
- Ronak Shah, Principal Consultant, FMI
How is the USA Boutique Hotel Market segmented?
- By nationality type: Domestic Travelers and International Travelers.
- By tour type: Independent Travelers and Tour Groups.
- By purpose of visit: Leisure & Vacation, Professional & Business, and Visiting Friends & Family.
- By demographic: Men and Women.
- By age group: 15 to 25 Years, 26 to 35 Years, 36 to 45 Years, 56 to 65 Years , 46 to 55 Years, and 66 to 75 Years.
- By duration of visit: 1 to 3 Nights, 4 to 6 Nights, and 7 Nights & More. Week-long stays overlap with the extended stay hotels market that FMI tracks separately.
- By organization of stay: Package and Non-package.
- By region: Northeastern United States, Midwest United States, Southern United States, and Western United States.
Why do Domestic Travelers lead by Nationality Type in the USA Boutique Hotel Market in 2026?
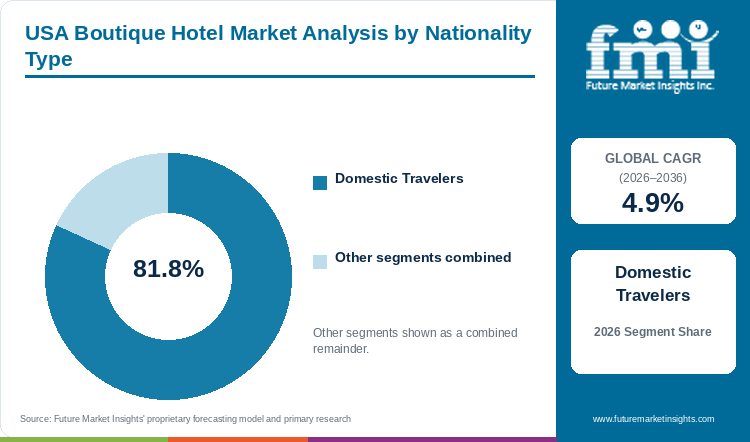
Domestic Travelers hold 81.8% of the USA Boutique Hotel Market by nationality type in 2026.
Domestic travelers lead because home demand is both larger and steadier than foreign demand. Domestic travel accounts for 87.0% of U.S. travel spending, according to the U.S. Travel Association. State and city data confirm the pattern. Florida estimated that 131.1 million of its 143.3 million visitors in 2025 were domestic, and New York City recorded 52.4 million domestic visitors out of 65.0 million. Short regional trips therefore provide the weekend base load for urban and coastal boutique properties.
Policy changes widened the advantage in 2025. International arrivals fell 5.5%, and Canadian arrivals dropped 20.9%. A new visa integrity fee of at least USD 250.0 adds cost for many overseas visitors. Hotels that draw mostly from regional drive markets have less exposure to these shifts.
International Travelers hold the remaining 18.2%. Their weight is far higher in gateway cities, where international visitors produced 50.0% of New York City tourism spending in 2025. A recovery in foreign arrivals would therefore lift gateway boutique hotels before properties in smaller towns.
Table 2: Nationality Type, 2026 Share
| Leading Share | 2026 market share |
|---|---|
| Domestic Travelers | 81.8% |
| All Other Segments Combined Share | 18.2% |
Source: Future Market Insights analysis of the USA boutique hotel market, 2026.
Why do Independent Travelers lead by Tour Type in the USA Boutique Hotel Market in 2026?
Independent Travelers account for 86.7% of tour type demand in the USA Boutique Hotel Market in 2026.
Independent travel leads because boutique hotels are designed for individual guests. Small room counts and limited meeting space restrict how much group business a property can accept. Accor's 21c Museum Hotels brand operated six hotels with 737 rooms at 30 June 2026. At that scale a large convention block would displace higher-rate individual guests, so operators price for individual bookings and use small events to fill quieter nights.
The size of each demand pool reinforces the model. The U.S. Travel Association forecasts domestic group travel spending of USD 118.0 billion in 2026. That compares with USD 909.0 billion expected for domestic leisure travel in the same year.
Tour Groups hold the remaining 13.3%. Group demand is smaller but steady, with domestic group spending forecast to rise 1.4% in 2026. Weddings, retreats and small meetings suit boutique hotels with private dining rooms. These events give operators a midweek revenue stream.
Table 3: Tour Type, 2026 Share
| Leading Share | 2026 market share |
|---|---|
| Independent Travelers | 86.7% |
| All Other Segments Combined Share | 13.3% |
Source: Future Market Insights analysis of the USA boutique hotel market, 2026.
Why does Leisure & Vacation lead by Purpose of Visit in the USA Boutique Hotel Market in 2026?
Leisure & Vacation stays represent 61.3% of the USA Boutique Hotel Market by purpose of visit in 2026.
Leisure leads because boutique hotels sell design, food and local character. Leisure guests value those attributes most. In New York City, domestic travelers made up about 81.0% of visitors in 2025 [3]. Hotel capital has followed that demand. Pebblebrook's resorts produced 48.0% of its Hotel EBITDA in 2025 against 17.0% in 2019. Its resort RevPAR rose 8.4% in the September 2026 quarter. Owners have shifted capital towards leisure destinations because guests there accept higher rates.
Professional & Business and Visiting Friends & Family stays account for the remaining 38.7%. Business travel spending is forecast at USD 319.0 billion in 2026, up only 0.7% in real terms. Midweek corporate demand remains material for city boutique hotels, although it adds little to growth.
Table 4: Purpose of Visit, 2026 Share
| Leading Share | 2026 market share |
|---|---|
| Leisure & Vacation | 61.3% |
| All Other Segments Combined Share | 38.7% |
Source: Future Market Insights analysis of the USA boutique hotel market, 2026.
What are the key drivers restraints and opportunities?
Boutique hotel revenue depends on room rates that guests will pay for a distinctive stay. The small scale that supports those rates also limits how widely fixed costs can be spread.
Driver
Higher-income domestic households are sustaining leisure travel spending, which supports premium room rates. The U.S. Travel Association says 2026 travel spending is being driven by higher-income households. Domestic leisure is also the only U.S. travel segment above its 2019 spending level in real terms. Because this group is the core boutique customer, rate growth at distinctive hotels can continue even when total trip volumes are flat.
Restraint
Travel costs and border policy are reducing parts of demand. Airline fares rose 22.4% in the year to September 2026, and gasoline prices rose 34.2%. The U.S. Travel Association expects travelers to shift towards shorter and lower-cost trips, which reduces nights per booking. Foreign guests face their own barriers, including the new visa integrity fee.
Opportunity
Food, beverage and wellness services can raise revenue per guest without adding rooms. Founder-led brands such as Ace Hotel build demand around their restaurants, public art and lobby events. Wellness programs extend the same model and connect boutique stays with the wellness tourism market. Operators should validate paid uptake at one property before committing capital across a portfolio.
How do fee rules and rental limits affect boutique hotel pricing in the United States?
A federal ban on hidden fees for short-term lodging took effect on 12 May 2025 under a Federal Trade Commission rule. It requires short-term lodging businesses to show the total price upfront, including mandatory fees. Resort and destination fees can no longer sit outside the advertised rate. Boutique hotels that relied on such fees must therefore fold them into room prices or remove them, which makes headline rates less comparable with prior years.
New York City has gone further. Its rule banning hidden hotel fees and unexpected credit card holds took effect on 21 February 2026. The city's Local Law 18 has also curbed short-term rentals, and the State Comptroller links that decline to high hotel occupancy and rates. Fewer legal rentals shift more visitors towards hotels in the five boroughs, which strengthens pricing for boutique operators there.
What limits boutique hotel capacity and service quality in the United States?
Staffing is the tightest constraint. U.S. hotel employment in 2025 was still 7.4% below its 2019 level. Boutique hotels promise personal service, so they cannot reduce staffing as readily as select-service hotels. Labour costs are rising as a result, and in May 2026 a New York City hotel union agreed an eight-year contract with wage increases of 50.0%.
New supply is slow to arrive. New York City had 5,778 rooms in active development through 2028, against 15,777 rooms under construction in 2020. Conversions avoid ground-up construction but still need new furniture and equipment, which ties renovation timing to the hotel furniture fixtures equipment market. Long lead times therefore delay the arrival of new boutique rooms.
Where can boutique hotel operators win additional business?
Collection brands give independent owners access to loyalty demand without erasing their identity. Hilton launched Outset Collection for independent, story-driven hotels. Conversion into such a collection gives owners access to members who book direct, which lowers distribution cost. Upscale properties can also compete for guests in the luxury hotel market by adding suites and personal service. Restaurants and bars that serve local diners provide a second revenue line that does not depend on room nights.
USA Boutique Hotel Market by Country (2026 to 2036)
Table 5: USA Boutique Hotel Market Growth Forecast by State
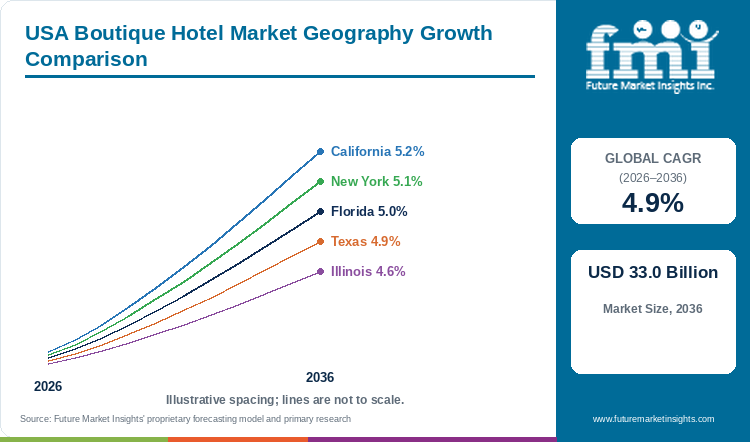
| Country | CAGR, 2026 to 2036 |
|---|---|
| California | 5.2% |
| New York | 5.1% |
| Florida | 5.0% |
| Texas | 4.9% |
| Illinois | 4.6% |
Source: Future Market Insights analysis of the USA boutique hotel market, 2026.
California
California has the largest hotel base among the profiled states, with 571,794 rooms in 2024, more than Texas or Florida. Demand is filling that base. The state added 1.2 million hotel room nights in 2025, ahead of national trends. Scale of this kind gives boutique operators a deep pool of leisure and city demand to draw on. San Francisco's return to above its pre-pandemic visitor spending level adds weekday city demand to that base.
Coastal towns are adding small, design-led hotels with wellness programs. IHG opened the 99-room Kimpton Mirador Pacific Grove on the Monterey Peninsula in January 2026. The hotel runs daily yoga, sound baths and fitness sessions with a local partner. Programs of this kind raise spend per guest, which supports rate growth in resort towns.
Strong domestic weekend demand supports California boutique revenue growth of 5.2% a year across the 2026 to 2036 window, the quickest pace among the profiled states. Foreign demand is the weak point. International visitor spending in the state fell by USD 1.0 billion to USD 25.0 billion in 2025. California still drew 1.8 million foreign air arrivals in the opening quarter of 2026. The 2028 Summer Olympics in Los Angeles give hotels a fixed date for rate planning and refurbishment. Operators that retain domestic leisure guests while overseas demand recovers will protect occupancy through the slower years.
New York
New York City runs the tightest hotel market in the country. The State Comptroller reports that its hotels led the nation on occupancy, room rate and RevPAR in 2025. Occupancy was 84.1% and the average daily rate reached USD 333.7. City RevPAR rose 4.5% in a year when it declined nationally.
Reuse of older buildings is the main route to new boutique rooms in Manhattan, where sites for ground-up hotels are scarce. IHG's Kimpton brand illustrates the approach with two openings in 2026. Era Midtown opened in the first quarter, and a 205-room Park Avenue hotel opened in April in a 1928 building near Grand Central Terminal.
Policy and labour pull in different directions behind the 5.1% CAGR expected for New York boutique hotels between 2026 and 2036. Local Law 18 has cut the supply of short-term rentals, and a city rule has banned hidden hotel fees since February 2026. Wages push costs up. Average hotel pay in the city reached USD 86,588.0 in 2025. Foreign visitors are also slower to return. They reached 92.6% of their 2019 level in 2025, against 98.7% for domestic visitors. NYC Tourism + Conventions expects international visitation to recover to 12.9 million in 2026. High occupancy leaves little room for volume growth, so New York revenue gains will come mostly from rate.
Florida
Florida welcomed a record 143.3 million visitors in 2025, according to preliminary VISIT FLORIDA estimates released by the Governor's office. Domestic travelers made up 91.5% of the total. Of those domestic visitors, 64.2% arrived by means other than air. That drive-in base protects occupancy when airfares rise.
Foreign demand adds a second revenue layer. Florida led all states for international air visitors in the first quarter of 2026, with 3.2 million arrivals. Miami and Orlando both ranked among the five cities that foreign air visitors chose most often. International demand therefore concentrates in gateway cities, which favours boutique hotels there over smaller coastal towns. That mix of home and foreign demand supports boutique revenue growth of 5.0% a year from 2026 to 2036, a little above the national rate.
Canada is the soft spot in Florida's demand mix. Canadian visitors totalled 2.9 million in 2025, about 2.0% of all visitors. Latin American markets offset part of that loss, as visitors from Brazil grew 10.4% and those from Argentina grew 17.8%. Boutique hotels that rely on Canadian winter guests have the largest exposure to that decline. Coastal boutique owners that build Latin American sales channels gain a second source of winter demand. Small waterfront hotels with strong dining are best suited to convert that demand into premium seasonal rates.
Texas
Texas ranks second among U.S. states by hotel room count, with 531,721 rooms in 2024 according to the New York State Comptroller. Recent tax receipts are softer. The Texas Comptroller collected USD 51.0 million in hotel occupancy tax in October 2026, down 21.0% from a year earlier. One month of receipts can reflect filing timing, so the decline needs confirming over several months.
Growth in Texas boutique revenue is forecast at 4.9% a year between 2026 and 2036, in line with the national rate. Its 629,000 overseas, Canadian and Mexican air visitors in early 2026 ranked fifth among all states. Large business centres in Dallas and Houston support midweek demand. Supply is the main pressure on rates, because a large existing room base can pull prices down when demand softens. Hotels with music, food and local design hold rate better than generic new builds in the same districts.
Austin is the state's boutique hub, and conversions are the preferred route into it. Hyatt plans to convert the South Congress Hotel into The Standard, Austin for a spring 2027 opening. Its Austin-based Bunkhouse team is supporting the project. It will be the brand's first U.S. opening in more than a decade. The hotel will offer social wellness spaces, a rooftop pool and several restaurants and bars. Conversions of this kind let a brand enter a city without adding rooms to local supply.
Illinois
Illinois sits at the slow end of the profiled group. The state welcomed 115 million visitors who spent USD 50.2 billion in fiscal year 2025, and hotel tax revenue reached a record USD 372.0 million. Chicago alone drew 56.8 million visitors and a record USD 21.5 billion of visitor spending in 2025. Repeat demand looks firm, with 92.0% of leisure visitors saying they plan to return within three years.
Hotel jobs have not kept pace with that demand. Chicago hotel employment of 26,300 in 2025 remained 14.5% below 2019. The county had 530 hotel establishments, only 2.3% more than in 2019. Slow supply growth supports pricing for existing boutique hotels, while thin staffing limits how far service-led concepts can expand.
A 4.6% annual rate for Illinois boutique revenue over 2026 to 2036 sits below the 4.9% national pace. Chicago is a convention city, so group and business demand weigh more heavily than in leisure states. The state is using grants to broaden its demand base. It awarded USD 0.7 million in grants to promote Illinois to international travelers. A further USD 2.0 million supports projects along Route 66 in its centennial year, which can draw road-trip guests to smaller towns. Success in those markets would help Chicago hotels fill weekends after the convention calendar thins out.
Who are the notable companies in the USA Boutique Hotel Market?
IHG, Hyatt, Marriott and Hilton reach boutique guests through brands that sit on large loyalty systems. IHG's Kimpton opened hotels in New York City, Scottsdale and Pacific Grove in the first quarter of 2026. IHG also brought its Ruby brand to the United States through Chicago. Hyatt bought Standard International's lifestyle brands and management platform in 2024. Its Lifestyle Portfolio now includes The Standard, Thompson Hotels, Bunkhouse Hotels and JdV by Hyatt. In April 2026 it reopened Hotel Solaya in Old Town Scottsdale under JdV. World of Hyatt member stays made up about 49.0% of system-wide room nights in 2025. More than 80.0% of Hyatt's U.S. pipeline consists of new builds. Marriott adds independent hotels to its system through Autograph Collection. Hilton reported 35 franchised Graduate by Hilton hotels with 5,881 rooms at 30 September 2026. It opened a Graduate in Dallas in 2025.
Ennismore is the lifestyle group in which Accor holds a majority stake. It runs The Hoxton and 21c Museum Hotels. Pebblebrook Hotel Trust owns 42 hotels with about 10,800 rooms and describes itself as the largest U.S. owner of urban and resort lifestyle hotels. Its portfolio includes resorts in Key West, Naples and Hollywood, Florida. In the third quarter of 2026 it reported RevPAR growth of 14.5% in San Francisco, 10.7% in Los Angeles and 12.7% in Chicago. Eight of its 13 resorts lifted Hotel EBITDA by 20.0% or more in that quarter.
Founder-led brands compete on design and food. Ace Hotel operates in Seattle, Palm Springs, New York and Brooklyn, along with hotels abroad. Lark Hotels runs a portfolio of boutique brands in New England and California. Nobu Hotels lists hotels in cities that include Chicago, Miami Beach and Las Vegas. Competitive advantage for these operators rests on a distinct identity, and they rely on owners and management contracts to add hotels.
Key Developments in the USA Boutique Hotel Market
- On 28 January 2026, IHG opened Kimpton Mirador Pacific Grove on the Monterey Peninsula in California under the Kimpton Hotels and Restaurants brand, adding 99 rooms and suites in a new Spanish Revival-inspired building to the Pacific Grove market [8].
- On 13 April 2026, Hyatt announced that Hotel Solaya in Old Town Scottsdale had opened under the JdV by Hyatt brand after a full transformation, with 194 redesigned rooms and suites [11].
- On 30 April 2026, IHG opened Kimpton Ashbel New York – Park Avenue, a 205-room hotel in a 1928 Beaux-Arts building in Midtown Manhattan [7].
Key Players in the USA Boutique Hotel Market
- IHG Hotels & Resorts (Kimpton Hotels & Restaurants)
- Hyatt Hotels Corporation (The Standard, Thompson Hotels, Bunkhouse Hotels, JdV by Hyatt)
- Marriott International, Inc. (Autograph Collection)
- Hilton Worldwide Holdings Inc. (Graduate by Hilton)
- Ennismore (The Hoxton, 21c Museum Hotels)
- Pebblebrook Hotel Trust
- Pendry Hotels & Resorts
- Proper Hotels
- Ace Hotel
- 1 Hotels
- Nobu Hotels
- Lark Hotels
- Sonesta Hotels of New York (formerly Affinia)
- Club Quarters Hotels
USA Boutique Hotel Market Report Scope
Table 6: USA Boutique Hotel Market Report Scope
| Coverage field | Report scope |
|---|---|
| Market definition | Revenue from rooms, food and beverage and events at boutique, lifestyle and collection-branded hotels in the United States with distinctive design and generally small room counts. Short-term rentals and select-service chain hotels are excluded. |
| Nationality Type | Domestic Travelers; International Travelers |
| Tour Type | Independent Travelers; Tour Groups |
| Purpose of Visit | Leisure & Vacation; Professional & Business; Visiting Friends & Family |
| Traveller profile | Demographic: Men; Women. Age Group: 15 to 25 Years; 26 to 35 Years; 36 to 45 Years; 46 to 55 Years; 66 to 75 Years |
| Stay profile | Duration of Visit: 1 to 3 Nights; 4 to 6 Nights; 7 Nights & More. Organization of Stay: Package; Non-package |
| Regions covered | Northeastern United States, Midwest United States, Southern United States, Western United States |
| Profiled states | California, New York, Florida, Texas, Illinois |
| Companies covered | IHG Hotels & Resorts (Kimpton); Hyatt Hotels Corporation; Marriott International, Inc.; Hilton Worldwide Holdings Inc.; Ennismore; Pebblebrook Hotel Trust; Pendry Hotels & Resorts; Proper Hotels; Ace Hotel; 1 Hotels; Nobu Hotels; Lark Hotels; Sonesta Hotels of New York; Club Quarters Hotels |
| Quantitative Units | USD billion |
Source: Future Market Insights analysis of the USA boutique hotel market, 2026.
USA Boutique Hotel Market Research Methodology
The boutique hotel assessment draws on federal travel statistics, state tourism releases, a state comptroller's hotel study and hotel company filings. FMI measures annual revenue from rooms, food and beverage and events at boutique and lifestyle hotels. Segment values are classified by guest origin, booking type and trip purpose. State forecasts reflect local visitor demand, hotel supply, labour cost and policy over the same 2026 to 2036 period. Visitor counts, room counts and revenue are reviewed as separate measures.
USA Boutique Hotel Market by Segments
USA Boutique Hotel Market segmented by Nationality Type:
- Domestic Travelers
- International Travelers
USA Boutique Hotel Market segmented by Tour Type:
- Independent Travelers
- Tour Groups
USA Boutique Hotel Market segmented by Purpose of Visit:
- Leisure & Vacation
- Professional & Business
- Visiting Friends & Family
USA Boutique Hotel Market segmented by Demographic:
- Men
- Women
USA Boutique Hotel Market segmented by Age Group:
- 15 to 25 Years
- 26 to 35 Years
- 36 to 45 Years
- 46 to 55 Years
- 56 to 65 Years
- 66 to 75 Years
USA Boutique Hotel Market segmented by Duration of Visit:
- 1 to 3 Nights
- 4 to 6 Nights
- 7 Nights & More
USA Boutique Hotel Market segmented by Organization of Stay:
- Package
- Non-package
USA Boutique Hotel Market by Region
- Northeastern United States
- New York
- Massachusetts
- Pennsylvania
- New Jersey
- Midwest United States
- Illinois
- Michigan
- Minnesota
- Ohio
- Southern United States
- Florida
- Texas
- Georgia
- Tennessee
- South Carolina
- Louisiana
- Western United States
- California
- Colorado
- Arizona
- Oregon
- Washington
- Nevada
Research Sources and Bibliography
- [1] U.S. Travel Association. (2026, May 7). U.S. Travel Forecast, Spring 2026 update.
- [2] Congressional Research Service. (2026, October 9). U.S. Tourism: Recent Developments and Data (R47857).
- [3] Office of the New York State Comptroller. (2026, October). The Hotel Industry in New York City (Report 6-2027).
- [4] Pebblebrook Hotel Trust. (2026, October 29). Pebblebrook Hotel Trust Reports Third Quarter 2026 Results. https://investor.pebblebrookhotels.com/news-1/news-releases/news-details/2026/Pebblebrook-Hotel-Trust-Reports-Third-Quarter-2026-Results/default.aspx
- [5] Marriott International, Inc. (2026). Form 10-K for the fiscal year ended December 31, 2025. U.S. Securities and Exchange Commission. https://www.sec.gov/Archives/edgar/data/1048286/000104828626000007/mar-20251231.htm
- [6] Hyatt Hotels Corporation. (2026). Form 10-K for the fiscal year ended December 31, 2025. U.S. Securities and Exchange Commission. https://www.sec.gov/Archives/edgar/data/1468174/000146817426000007/h-20251231.htm
- [7] IHG Hotels & Resorts. (2026, April 30). Kimpton Ashbel New York - Park Avenue opens in Historic Midtown Manhattan Landmark. https://www.ihgplc.com/en/news-and-media/news-releases/2026/kimpton-ashbel-new-york-park-avenue-opens-in-historic-midtown-manhattan-landmark
- [8] IHG Hotels & Resorts. (2026, January 28). Kimpton Mirador Pacific Grove brings coastal charm and California cool to the Monterey Peninsula. https://www.ihgplc.com/en/news-and-media/news-releases/2026/kimpton-mirador-pacific-grove-brings-coastal-charm-and-california-cool-to-the-monterey-peninsula
- [9] IHG Hotels & Resorts. (2026, May 14). IHG Hotels & Resorts Fuels Americas Growth with Strong Development Momentum. https://www.ihgplc.com/en/news-and-media/news-releases/2026/ihg-hotels-and-resorts-fuels-americas-growth-with-strong-development-momentum
- [10] Hyatt Hotels Corporation. (2026, April 1). The Standard Is Coming To Austin. https://newsroom.hyatt.com/Apr-1-2026-TheStandardAustin
- [11] Hyatt Hotels Corporation. (2026, April 13). Hotel Solaya Debuts in Old Town Scottsdale, Joining JdV by Hyatt as a Reimagined Desert Oasis. https://newsroom.hyatt.com/2026-april-13-Hotel-Solaya-Debuts-in-Old-Town-Scottsdale-Joining-JdV-by-Hyatt-as-a-Reimagined-Desert-Oasis
- [12] Hyatt Hotels Corporation. (2026, January 26). Hyatt Finishes 2025 with Highest Number of U.S. Room Signings in Five Years, Reaches Record Global Pipeline of Approximately 148,000 Rooms. https://newsroom.hyatt.com/1-26-2026-RecordPipeline
- [13] Hilton Worldwide Holdings Inc. (2026, October 27). Hilton Reports Third Quarter Results. https://ir.hilton.com/news-events/investor-news/detail/419/hilton-reports-third-quarter-results
- [14] Hilton Worldwide Holdings Inc. (2026, January 20). What's New At Hilton in 2026. https://stories.hilton.com/whats-new-at-hilton-in-2026
- [15] Accor. (2026). 21c Museum Hotels brand page, figures as of June 30, 2026, accessed 4 November 2026. https://group.accor.com/en/brands-and-experiences/our-hotel-brands/21c-museum-hotel
- [16] Ennismore. (2026). About Ennismore, accessed 4 November 2026. https://ennismore.com/about/
- [17] International Trade Administration, National Travel and Tourism Office. (2026). Survey of International Air Travelers Results 2026 Q1.
- [18] U.S. Bureau of Labor Statistics. (2026, October 14). Consumer Price Index, September 2026. https://www.bls.gov/news.release/cpi.nr0.htm
- [19] Federal Trade Commission. (2025, May 5). FTC Rule on Unfair or Deceptive Fees to Take Effect on May 12, 2025. https://www.ftc.gov/news-events/news/press-releases/2025/05/ftc-rule-unfair-or-deceptive-fees-take-effect-may-12-2025
- [20] City of New York, Office of the Mayor. (2026, January 21). Mamdani Administration Bans Hotel Hidden Fees and Unexpected Credit Card Holds. https://www.nyc.gov/mayors-office/news/2026/01/mamdani-administration-bans-hotel-hidden-fees-and-unexpected-cre
- [21] New York City Tourism + Conventions. (2026, March 24). New York City Tourism + Conventions 2025 Visitation Surpasses Forecast, Generating $84.7B in Economic Impact. https://www.business.nyctourism.com/press-media/press-releases/NYC-Tourism-Annual-Report-March-2026
- [22] Office of the Governor of California. (2026, May 12). California remains the nation's top travel destination, tourism spending climbs to a record high $158.9 billion. https://www.gov.ca.gov/2026/05/12/california-remains-the-nations-top-travel-destination-tourism-spending-climbs-to-a-record-high-158-9-billion/
- [23] Executive Office of the Governor of Florida. (2026, February 20). Governor Ron DeSantis Announces Another Record-Breaking Year for Florida Tourism: Florida Welcomes 143.3 Million Visitors in 2025. https://www.flgov.com/eog/news/press/2026/governor-ron-desantis-announces-another-record-breaking-year-florida-tourism
- [24] Texas Comptroller of Public Accounts. (2026, November 2). Texas Comptroller Huffines Reports Net State Sales Tax Revenue Totaled $4.8 Billion in October. https://comptroller.texas.gov/about/media-center/news/20261102-texas-comptroller-huffines-reports-net-state-sales-tax-revenue-totaled-48-billion-in-october-1793586689255
- [25] Office of the Governor of Illinois. (2026, September 28). Gov. Pritzker Awards $4.6 Million to Boost Tourism Across Illinois. https://gov.illinois.gov/news/press-release.32975.html
- [26] Choose Chicago. (2026, June 25). Chicago welcomes 56.8 million tourists in 2025, generating a record-breaking $21.5 billion in spending. https://www.choosechicago.com/press-media/press-releases/chicago-welcomes-56-8-million-tourists-in-2025-generating-a-record-breaking-21-5-billion-in-spending/
- [27] Tennessee Department of Tourist Development. (2026, August 4). Tennessee Tourism, Gov. Lee Commend State's Economic Impact and Record $32 Billion Visitor Spending. https://www.tn.gov/tourism/news/2026/8/4/tennessee-tourism-gov-lee-commend-states-economic-impact-record-32-billion-visitor-spending.html
- [28] Ace Hotel. (2026). Ace Hotel locations, accessed 4 November 2026. https://acehotel.com/
- [29] Lark Hotels, LLC. (2026). Boutique Hotels in New England and California, accessed 4 November 2026. https://www.larkhotels.com/
- [30] Nobu Hotels. (2026). Nobu Hotels locations, accessed 4 November 2026. https://www.nobuhotels.com/
- [31] Pebblebrook Hotel Trust. (2026). 2025 Annual Report and Form 10-K. https://s206.q4cdn.com/477567247/files/doc_financials/2025/ar/2025-Pebblebrook-Hotel-Trust-Annual-Report.pdf
Table of Content
- Key Takeaways
- Market Size and CAGR
- Top Growth Driver
- Fastest Growing Segment
- Leading Region
- Key Companies
- Emerging Opportunities
- Executive Summary
- Global Market Outlook
- Demand-side Trends
- Supply-side Trends
- Technology Roadmap Analysis
- Analysis and Recommendations
- Analyst Perspective (What is happening? Why now? What should investors know?)
- Key Questions Answered
- How large is the market?
- What is the CAGR?
- What are key trends?
- Which region dominates?
- Who are the leaders?
Read More...
- Market Overview
- Market Coverage / Taxonomy
- Market Definition / Scope / Limitations
- Research Methodology
- Chapter Orientation
- Analytical Lens and Working Hypotheses
- Market Structure, Signals, and Trend Drivers
- Benchmarking and Cross-market Comparability
- Market Sizing, Forecasting, and Opportunity Mapping
- Research Design and Evidence Framework
- Desk Research Programme (Secondary Evidence)
- Expert Input and Fieldwork (Primary Evidence)
- Tooling, Models, and Reference Databases
- Data Engineering and Model Build
- Quality Assurance and Audit Trail
- Market Background
- Market Dynamics (Drivers, Restraints, Opportunity, Trends)
- Scenario Forecast (Optimistic, Likely, Conservative)
- Impact Analysis
- AI Impact
- Sustainability Impact
- Regulatory Impact
- Technology Impact
- Consumer / Buyer Analysis
- Purchase Drivers
- Adoption Barriers
- Buyer Journey
- Opportunity Map Analysis
- Product Life Cycle Analysis
- Supply Chain Analysis
- Investment Feasibility Matrix
- Value Chain Analysis
- PESTLE and Porter's Analysis
- Regulatory Landscape
- Regional Parent Market Outlook
- Production and Consumption Statistics
- Import and Export Statistics
- Global Market Analysis and Forecast, 2021 to 2036
- Historical Market Size Value (USD Billion) Analysis, 2021 to 2025
- Current and Future Market Size Value (USD Billion) Projections, 2026 to 2036
- Y-o-Y Growth Trend Analysis
- Absolute $ Opportunity Analysis
- Global Market Pricing Analysis, 2021 to 2036
- Global Market Analysis and Forecast, By Nationality Type, 2021 to 2036
- Introduction / Key Findings
- Historical Market Size Value (USD Billion) Analysis By Nationality Type, 2021 to 2025
- Current and Future Market Size Value (USD Billion) Analysis and Forecast By Nationality Type, 2026 to 2036
- Domestic Travelers
- International Travelers
- Y-o-Y Growth Trend Analysis By Nationality Type, 2021 to 2025
- Absolute $ Opportunity Analysis By Nationality Type, 2026 to 2036
- Global Market Analysis and Forecast, By Tour Type, 2021 to 2036
- Introduction / Key Findings
- Historical Market Size Value (USD Billion) Analysis By Tour Type, 2021 to 2025
- Current and Future Market Size Value (USD Billion) Analysis and Forecast By Tour Type, 2026 to 2036
- Independent Travelers
- Tour Groups
- Y-o-Y Growth Trend Analysis By Tour Type, 2021 to 2025
- Absolute $ Opportunity Analysis By Tour Type, 2026 to 2036
- Global Market Analysis and Forecast, By Purpose of Visit, 2021 to 2036
- Introduction / Key Findings
- Historical Market Size Value (USD Billion) Analysis By Purpose of Visit, 2021 to 2025
- Current and Future Market Size Value (USD Billion) Analysis and Forecast By Purpose of Visit, 2026 to 2036
- Leisure & Vacation
- Professional & Business
- Visiting Friends & Family
- Y-o-Y Growth Trend Analysis By Purpose of Visit, 2021 to 2025
- Absolute $ Opportunity Analysis By Purpose of Visit, 2026 to 2036
- Global Market Analysis and Forecast, By Demographic, 2021 to 2036
- Introduction / Key Findings
- Historical Market Size Value (USD Billion) Analysis By Demographic, 2021 to 2025
- Current and Future Market Size Value (USD Billion) Analysis and Forecast By Demographic, 2026 to 2036
- Men
- Women
- Y-o-Y Growth Trend Analysis By Demographic, 2021 to 2025
- Absolute $ Opportunity Analysis By Demographic, 2026 to 2036
- Global Market Analysis and Forecast, By Age Group, 2021 to 2036
- Introduction / Key Findings
- Historical Market Size Value (USD Billion) Analysis By Age Group, 2021 to 2025
- Current and Future Market Size Value (USD Billion) Analysis and Forecast By Age Group, 2026 to 2036
- 15 to 25 Years
- 26 to 35 Years
- 36 to 45 Years
- 46 to 55 Years
- 66 to 75 Years
- Y-o-Y Growth Trend Analysis By Age Group, 2021 to 2025
- Absolute $ Opportunity Analysis By Age Group, 2026 to 2036
- Global Market Analysis and Forecast, By Duration of Visit, 2021 to 2036
- Introduction / Key Findings
- Historical Market Size Value (USD Billion) Analysis By Duration of Visit, 2021 to 2025
- Current and Future Market Size Value (USD Billion) Analysis and Forecast By Duration of Visit, 2026 to 2036
- 1 to 3 Nights
- 4 to 6 Nights
- 7 Nights & More
- Y-o-Y Growth Trend Analysis By Duration of Visit, 2021 to 2025
- Absolute $ Opportunity Analysis By Duration of Visit, 2026 to 2036
- Global Market Analysis and Forecast, By Organization of Stay, 2021 to 2036
- Introduction / Key Findings
- Historical Market Size Value (USD Billion) Analysis By Organization of Stay, 2021 to 2025
- Current and Future Market Size Value (USD Billion) Analysis and Forecast By Organization of Stay, 2026 to 2036
- Package
- Non-package
- Y-o-Y Growth Trend Analysis By Organization of Stay, 2021 to 2025
- Absolute $ Opportunity Analysis By Organization of Stay, 2026 to 2036
- Global Market Analysis and Forecast, By Region, 2021 to 2036
- Introduction
- Historical Market Size Value (USD Billion) Analysis By Region, 2021 to 2025
- Current Market Size Value (USD Billion) Analysis and Forecast By Region, 2026 to 2036
- USA
- Market Attractiveness Analysis By Region
- USA Market Analysis and Forecast, By Region
- Historical Market Size Value (USD Billion) Trend Analysis By Market Taxonomy, 2021 to 2025
- Market Size Value (USD Billion) Forecast By Market Taxonomy, 2026 to 2036
- By Region
- Northeastern United States
- New York
- Massachusetts
- Pennsylvania
- New Jersey
- Midwest United States
- Illinois
- Michigan
- Minnesota
- Ohio
- Southern United States
- Florida
- Texas
- Georgia
- Tennessee
- South Carolina
- Louisiana
- Western United States
- California
- Colorado
- Arizona
- Oregon
- Washington
- Nevada
- Northeastern United States
- By Nationality Type
- By Tour Type
- By Purpose of Visit
- By Demographic
- By Age Group
- By Duration of Visit
- By Organization of Stay
- By Region
- Market Attractiveness Analysis
- By Country
- By Nationality Type
- By Tour Type
- By Purpose of Visit
- By Demographic
- By Age Group
- By Duration of Visit
- By Organization of Stay
- Key Takeaways
- Key Regions Market Analysis
- California
- Pricing Analysis
- Market Share Analysis, 2025
- By Nationality Type
- By Tour Type
- By Purpose of Visit
- By Demographic
- By Age Group
- By Duration of Visit
- By Organization of Stay
- New York
- Pricing Analysis
- Market Share Analysis, 2025
- By Nationality Type
- By Tour Type
- By Purpose of Visit
- By Demographic
- By Age Group
- By Duration of Visit
- By Organization of Stay
- Florida
- Pricing Analysis
- Market Share Analysis, 2025
- By Nationality Type
- By Tour Type
- By Purpose of Visit
- By Demographic
- By Age Group
- By Duration of Visit
- By Organization of Stay
- Texas
- Pricing Analysis
- Market Share Analysis, 2025
- By Nationality Type
- By Tour Type
- By Purpose of Visit
- By Demographic
- By Age Group
- By Duration of Visit
- By Organization of Stay
- Illinois
- Pricing Analysis
- Market Share Analysis, 2025
- By Nationality Type
- By Tour Type
- By Purpose of Visit
- By Demographic
- By Age Group
- By Duration of Visit
- By Organization of Stay
- California
- Market Structure Analysis
- Competition Dashboard
- Competition Benchmarking
- Market Share Analysis of Top Players
- By Regional
- By Nationality Type
- By Tour Type
- By Purpose of Visit
- By Demographic
- By Age Group
- By Duration of Visit
- By Organization of Stay
- Emerging Startups
- Innovation Benchmarking
- Competition Analysis
- Competition Deep Dive
- IHG Hotels & Resorts (Kimpton)
- Overview
- Product Portfolio
- Profitability by Market Segments
- Sales Footprint
- Strategy Overview
- Marketing Strategy
- Product Strategy
- Channel Strategy
- Hyatt Hotels Corporation
- Marriott International, Inc.
- Hilton Worldwide Holdings Inc.
- Pebblebrook Hotel Trust
- IHG Hotels & Resorts (Kimpton Hotels & Restaurants)
- Hyatt Hotels Corporation (The Standard, Thompson Hotels, Bunkhouse Hotels, JdV by Hyatt)
- Marriott International, Inc. (Autograph Collection)
- Hilton Worldwide Holdings Inc. (Graduate by Hilton)
- Ennismore (The Hoxton, 21c Museum Hotels)
- Pendry Hotels & Resorts
- Proper Hotels
- Ace Hotel
- 1 Hotels
- Nobu Hotels
- Lark Hotels
- Sonesta Hotels of New York (formerly Affinia)
- Club Quarters Hotels
- IHG Hotels & Resorts (Kimpton)
- Case Studies
- Success Stories
- Recent Developments
- Competition Deep Dive
- Assumptions & Acronyms Used
List of Tables
- Table 1: Global Market Value (USD Billion) Forecast by Region, 2021 to 2036
- Table 2: Global Market Value (USD Billion) Forecast by Nationality Type, 2021 to 2036
- Table 3: Global Market Value (USD Billion) Forecast by Tour Type, 2021 to 2036
- Table 4: Global Market Value (USD Billion) Forecast by Purpose of Visit, 2021 to 2036
- Table 5: Global Market Value (USD Billion) Forecast by Demographic, 2021 to 2036
- Table 6: Global Market Value (USD Billion) Forecast by Age Group, 2021 to 2036
- Table 7: Global Market Value (USD Billion) Forecast by Duration of Visit, 2021 to 2036
- Table 8: Global Market Value (USD Billion) Forecast by Organization of Stay, 2021 to 2036
- Table 9: USA Market Value (USD Billion) Forecast by Country, 2021 to 2036
- Table 10: USA Market Value (USD Billion) Forecast by Nationality Type, 2021 to 2036
- Table 11: USA Market Value (USD Billion) Forecast by Tour Type, 2021 to 2036
- Table 12: USA Market Value (USD Billion) Forecast by Purpose of Visit, 2021 to 2036
- Table 13: USA Market Value (USD Billion) Forecast by Demographic, 2021 to 2036
- Table 14: USA Market Value (USD Billion) Forecast by Age Group, 2021 to 2036
- Table 15: USA Market Value (USD Billion) Forecast by Duration of Visit, 2021 to 2036
- Table 16: USA Market Value (USD Billion) Forecast by Organization of Stay, 2021 to 2036
List of Figures
- Figure 1: Global Market Pricing Analysis
- Figure 2: Global Market Value (USD Billion) Forecast 2021-2036
- Figure 3: Global Market Value Share and BPS Analysis by Nationality Type, 2026 and 2036
- Figure 4: Global Market Y-o-Y Growth Comparison by Nationality Type, 2026-2036
- Figure 5: Global Market Attractiveness Analysis by Nationality Type
- Figure 6: Global Market Value Share and BPS Analysis by Tour Type, 2026 and 2036
- Figure 7: Global Market Y-o-Y Growth Comparison by Tour Type, 2026-2036
- Figure 8: Global Market Attractiveness Analysis by Tour Type
- Figure 9: Global Market Value Share and BPS Analysis by Purpose of Visit, 2026 and 2036
- Figure 10: Global Market Y-o-Y Growth Comparison by Purpose of Visit, 2026-2036
- Figure 11: Global Market Attractiveness Analysis by Purpose of Visit
- Figure 12: Global Market Value Share and BPS Analysis by Demographic, 2026 and 2036
- Figure 13: Global Market Y-o-Y Growth Comparison by Demographic, 2026-2036
- Figure 14: Global Market Attractiveness Analysis by Demographic
- Figure 15: Global Market Value Share and BPS Analysis by Age Group, 2026 and 2036
- Figure 16: Global Market Y-o-Y Growth Comparison by Age Group, 2026-2036
- Figure 17: Global Market Attractiveness Analysis by Age Group
- Figure 18: Global Market Value Share and BPS Analysis by Duration of Visit, 2026 and 2036
- Figure 19: Global Market Y-o-Y Growth Comparison by Duration of Visit, 2026-2036
- Figure 20: Global Market Attractiveness Analysis by Duration of Visit
- Figure 21: Global Market Value Share and BPS Analysis by Organization of Stay, 2026 and 2036
- Figure 22: Global Market Y-o-Y Growth Comparison by Organization of Stay, 2026-2036
- Figure 23: Global Market Attractiveness Analysis by Organization of Stay
- Figure 24: Global Market Value (USD Billion) Share and BPS Analysis by Region, 2026 and 2036
- Figure 25: Global Market Y-o-Y Growth Comparison by Region, 2026-2036
- Figure 26: Global Market Attractiveness Analysis by Region
- Figure 27: USA Market Incremental Dollar Opportunity, 2026-2036
- Figure 28: USA Market Value Share and BPS Analysis by Country, 2026 and 2036
- Figure 29: USA Market Value Share and BPS Analysis by Nationality Type, 2026 and 2036
- Figure 30: USA Market Y-o-Y Growth Comparison by Nationality Type, 2026-2036
- Figure 31: USA Market Attractiveness Analysis by Nationality Type
- Figure 32: USA Market Value Share and BPS Analysis by Tour Type, 2026 and 2036
- Figure 33: USA Market Y-o-Y Growth Comparison by Tour Type, 2026-2036
- Figure 34: USA Market Attractiveness Analysis by Tour Type
- Figure 35: USA Market Value Share and BPS Analysis by Purpose of Visit, 2026 and 2036
- Figure 36: USA Market Y-o-Y Growth Comparison by Purpose of Visit, 2026-2036
- Figure 37: USA Market Attractiveness Analysis by Purpose of Visit
- Figure 38: USA Market Value Share and BPS Analysis by Demographic, 2026 and 2036
- Figure 39: USA Market Y-o-Y Growth Comparison by Demographic, 2026-2036
- Figure 40: USA Market Attractiveness Analysis by Demographic
- Figure 41: USA Market Value Share and BPS Analysis by Age Group, 2026 and 2036
- Figure 42: USA Market Y-o-Y Growth Comparison by Age Group, 2026-2036
- Figure 43: USA Market Attractiveness Analysis by Age Group
- Figure 44: USA Market Value Share and BPS Analysis by Duration of Visit, 2026 and 2036
- Figure 45: USA Market Y-o-Y Growth Comparison by Duration of Visit, 2026-2036
- Figure 46: USA Market Attractiveness Analysis by Duration of Visit
- Figure 47: USA Market Value Share and BPS Analysis by Organization of Stay, 2026 and 2036
- Figure 48: USA Market Y-o-Y Growth Comparison by Organization of Stay, 2026-2036
- Figure 49: USA Market Attractiveness Analysis by Organization of Stay
- Figure 50: Global Market - Tier Structure Analysis
- Figure 51: Global Market - Company Share Analysis
Frequently Asked Questions
How big is the USA Boutique Hotel Market in 2026?
FMI estimates the market at USD 20.4 billion in 2026, up from USD 19.5 billion in 2025. It is projected to reach USD 33.0 billion by 2036 at a 4.9% CAGR.
Which nationality type leads the USA Boutique Hotel Market in 2026?
Domestic Travelers lead by nationality type with 81.8% in 2026. International Travelers hold the other 18.2%.
Which tour type and purpose of visit lead in 2026?
Independent Travelers hold 86.7% by tour type. Leisure & Vacation stays hold 61.3% by purpose of visit in FMI's 2026 assessment.
Which state is forecast to grow fastest through 2036?
California has the highest forecast CAGR at 5.2% during 2026 to 2036, followed by New York at 5.1%. These are FMI forecasts and are not rates reported by the cited public bodies.
How do federal fee rules affect boutique hotel pricing?
Since 12 May 2025, the FTC rule on unfair or deceptive fees has required lodging businesses to show the total price upfront, including mandatory fees [19]. Resort and destination fees must now appear in the advertised price.
Preview the report firsthand - request a free sample
Get SampleGet the brochure for pricing and purchase details.
Get PDF
