The global ultra-thin glass market size is expected to witness a CAGR of 10.7% from 2023 to 2033. It is projected to surpass a valuation of US$ 29.5 billion by 2033. The market stands at US$ 10.7 billion in 2023.
The rising inclination of millennials toward foldable smartphones is also expected to push ultra-thin glass demand over the coming decade. New foldable smartphones are designed in such a way that they have ultra-thin glass sheet that offers an aesthetic appeal for customers demanding unique products. Millennials are expected to purchase these as they want to stand out from the conventional flat phones.
Smartphone companies such as Samsung and Oppo are expected to launch several models of foldable phones by 2033. This is due to the fact that these companies often strive to remain at the forefront of technological innovations. This is also projected to positively influence their brand image.
As foldable smartphones are usually more expensive than conventional flat-screen phones, they are considered a status symbol for several people. Hence, such phones are likely to be sold under premium brands.
The OnePlus Fold, OnePlus's eagerly awaited foldable smartphone, will soon be available. The business might introduce its first folding gadget in 2023. Even though OnePlus hasn't formally announced the launch, it is certain that the impending phone will hit the market. It might be able to take on long-standing competitors such as Samsung and Motorola, which have been active in the foldable phone sector for years.
In contrast to metropolitan areas, remote areas and non-metros are experiencing increased adoption of Samsung's foldable and flip phones. As there are now more financing alternatives available, purchasing these cell phones has become simpler.
In traditional flat phones, materials such as polymer and plastic were used due to their affordability. However, smartphone manufacturers are using ultra-thin glass in foldable phones as it is highly durable. Thin tempered glass/micro-thin glass or thin flexible glass are used for these phone screens. These can tolerate repeated unfolding and folding activities without damaging the screen.
All these above-mentioned factors are expected to propel sales of ultra-thin glass.
Ultra-thin Glass Market Insights:
Attributes | Key Insights |
---|---|
Ultra-thin Glass Market Size (2022A) | US$ 9.5 billion |
Estimated Market Size (2023E) | US$ 10.7 billion |
Projected Market Valuation (2033F) | US$ 29.5 billion |
Value-based CAGR (2023 to 2033) | 10.7% |
Don't pay for what you don't need
Customize your report by selecting specific countries or regions and save 30%!
The global market exhibited a robust CAGR of 13.7% during the historical period between 2018 and 2022. It is expected to grow at a 10.7% CAGR over the forecast period.
HCAGR | 13.7% |
---|---|
CAGR | 10.7% |
The global healthcare sector has been showcasing considerable growth in recent years. Leading medical device manufacturers are using ultra-thin glass in diagnostic tools, imaging equipment, and wearable devices to enhance remote patient monitoring.
Ultra-thin glass manufacturers are set to team up with government agencies in several countries. They might take the initiatives to use their product in the agriculture sector.
Newly developed and improved ultra-thin glass is expected to help in creating new opportunities in the agriculture sector worldwide. Owing to its excellent insulating features, this type of glass is gaining prominence in industries. Greenhouse owners are also projected to find the use of this type of glass to boost the growth of their plants. These factors are expected to drive growth in the ultra-thin glass market.
Current field research & development efforts are anticipated to offer promising commercial potential.
Increasing use of ultra-thin glass in smartwatches to enhance their durability is another vital factor driving the ultra-thin glass market growth. Several companies are launching new smartwatches with innovative features to compete with their rivals in the ultra-thin glass market.
Owing to the aforementioned factors, the ultra-thin glass market is set to reach a valuation of US$ 29.5 billion by 2033.
Attributes | Key Factors |
---|---|
Latest Trends |
|
Upcoming Opportunities |
|
Growth Obstacles |
|
The table below highlights the market size and CAGRs of the top 5 countries in the ultra-thin glass market. Among them, the ultra-thin glass market in China is anticipated to remain at the forefront by surpassing a valuation of US$ 6.4 billion by 2033, followed by Japan.
Country | Market Valuation (2033) |
---|---|
United States | US$ 5.4 billion |
United Kingdom | US$ 1.2 billion |
China | US$ 6.4 billion |
Japan | US$ 5.7 billion |
South Korea | US$ 1.5 billion |
In the table below, CAGRs of the top 5 countries are provided. Out of these, the United States market is expected to grow rapidly at a CAGR of 10.6% through 2033. Followed by these, the markets in the United Kingdom and South Korea are expected to witness CAGRs of 10.4% and 10.2%, respectively, over the forecast period.
Country | Value-based CAGR (2023 to 2033) |
---|---|
United States | 10.6% |
United Kingdom | 10.4% |
China | 10.6% |
Japan | 10.6% |
South Korea | 10.2% |
The United States ultra-thin glass market is anticipated to be valued at US$ 5.4 billion from 2023 to 2033. It is expected to grow at a CAGR of 10.6% through 2033.
Skyrocketing demand for electromobility and electric vehicles (EVs) in the United States is projected to augment the growth of the target market. Manufacturers prefer lightweight materials such as ultra-thin glass for the production of EV components.
Such materials are also anticipated to provide an extended battery life and enhanced fuel efficiency. Leading EV manufacturers are increasingly adopting ultra-thin glass for making windows, displays, and touchscreens to refine aesthetics and driving experience.
The United Kingdom ultra-thin glass market is expected to reach US$ 1.2 billion by 2033. The ultra-thin glass market is expected to record a CAGR of 10.4% over the forecast period.
Real estate agencies in the United Kingdom are expected to invest in smart city innovations over the coming decade. Hence, ultra-thin glass demand is anticipated to increase with the development of urban information hubs, public transportation displays, and smart kiosks.
Since the pandemic, several renowned companies have implemented the work-from-home policy for their employees. As remote work culture expands, demand for unique collaboration and video conferencing software & tools might rise. This is set to create new opportunities for ultra-glass companies as they can launch new products to boost their market presence. The emergence of digital classrooms, robust e-learning devices, and interactive whiteboards in the United Kingdom is another factor pushing the demand further. The rising need to improve the learning and teaching experience among students and teachers is expected to generate higher demand.
The ultra-thin glass market in China is expected to gain a complete financial prospect of US$ 6.4 billion by 2033. The market is expected to witness a CAGR of 10.6% during the projected period.
Growth of agriculture has long been a top goal for the Government of China. Since 1978, the country has been executing a program of gradual change and opening up. This has hastened the development and reform of the agriculture sector. The government has adhered to the practice of giving work related to agriculture, rural areas, and farmers priority, especially in recent years.
The country’s initiatives to enhance crop yield and simplify agriculture with modern technology are expected to fuel ultra-thin glass sales. These might be used in cutting-edge agriculture solutions, surveillance tools, and unique sensors.
The ultra-thin glass market in Japan is expected to generate a total monetary potential of US$ 5.7 billion by 2033. The ultra-thin glass market is estimated to grow at a CAGR of 10.6% through 2033.
Japan’s ever-evolving entertainment and gaming sectors are projected to contribute to the market’s growth. The use of ultra-thin glass in augmented or virtual reality devices, immersive displays, and gaming equipment is expected to boost sales. At the same time, these glasses are set to be used in malls across the country.
The country is also renowned for precision manufacturing with rising sales of scientific devices, precision instruments, and optics. Key companies are set to use ultra-thin glasses for producing mirrors and lenses.
The consumer electronics sector in Japan is constantly expanding. The country houses diverse electronics manufacturers that strive to produce efficient and portable devices. High demand for wearable devices, laptops, cameras, and smartphones is projected to push sales of ultra-thin glass for making sensors and displays.
The South Korea ultra-thin glass market is expected to obtain a valuation of US$ 1.5 billion by 2033. The ultra-thin glass market is estimated to progress at a CAGR of 10.2% during the forecast period.
Demand for ultra-thin glass is anticipated to surge in South Korea with increasing demand for e-learning services, digital classrooms, and online learning tools. The country is expected to focus on providing quality education, thereby boosting the ultra-thin glass market.
In terms of manufacturing process, the float segment is likely to witness a CAGR of 10.2% through 2033. It expanded at a considerable CAGR of 13.5% during the historical period.
Top Manufacturing Process | Float |
---|---|
Value-based CAGR (2023 to 2033) | 10.2% |
The popularity of the float ultra-thin glass manufacturing process is set to surge with constant research & development activities worldwide. These have led to the optimization of this process, thereby driving demand. This type of glass is expected to have similar bending properties as that of paper.
Demand for modern infrastructure is projected to skyrocket among millennial consumers who are influenced by social media. They are set to look for glass-intensive structures that might require superior-quality glass sheets. It is further estimated to propel the segment’s growth in the market.
The float glass manufacturing process is also expected to gain momentum due to the rising environmental concerns. As this process uses less energy and generates less waste, its adoption rate is expected to expand. Key companies are likely to use this process to keep up with their sustainable production goals.
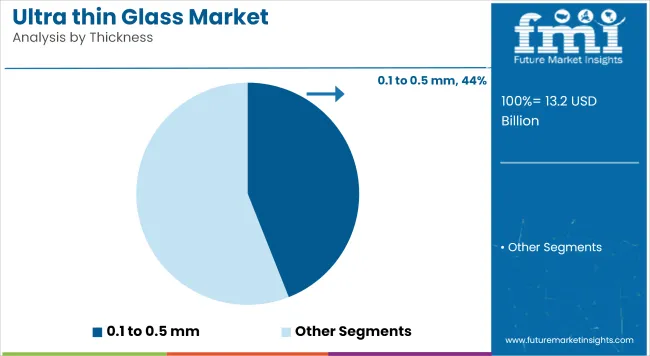
In terms of thickness, the less than 0.1 mm segment is expected to register a CAGR of 10% during the assessment period. It grew at a CAGR of 13.3% during the historical period.
Top Thickness | Less than 0.1 mm |
---|---|
Value-based CAGR (2023 to 2033) | 10% |
Ultra-thin glasses with a thickness of less than 0.1 mm, are set to find extensive use in medical equipment such as microscopes and endoscopes. These are expected to provide high clarity and compactness, thereby proving to be convenient for doctors.
These also find applications in wearable devices such as smart eyewear, fitness trackers, and smartwatches. Consumers are now looking for comfortable and lightweight devices, which require the use of thin materials such as ultra-thin glass.
Virtual reality and augmented reality headsets are gaining prominence among gamers worldwide. These are often equipped with robust and lightweight displays that can be smoothly incorporated into headsets.
Glass with less than 0.1 mm thickness provides a novel solution for gaining mesmerizing experiences. These aspects are projected to accelerate growth in the ultra-thin glass market.
Get the data you need at a Fraction of the cost
Personalize your report by choosing insights you need
and save 40%!
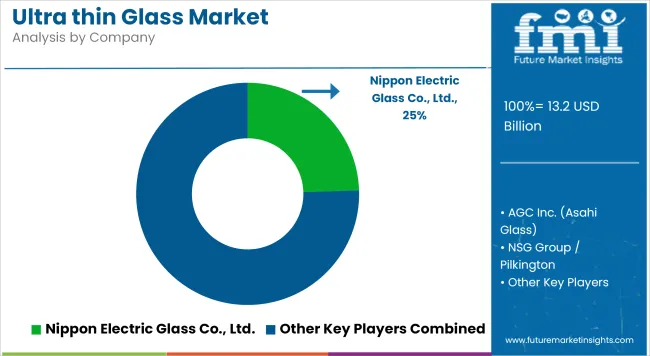
The global ultra-thin glass market is highly fragmented with the presence of several small- and large-scale companies. They are mainly focusing on creating innovative products to cater to the changing ultra-thin glass demands.
Leading ultra-thin glass market players are coming up with novel technologies to upgrade their products in the smartphone manufacturing sector. The high demand for foldable smartphones is set to create new opportunities for them. A handful of ultra-thin glass market participants are also conducting research & development activities to pave the way to success.
For instance,
Attribute | Details |
---|---|
Estimated Market Size (2023) | USD 10.7 billion |
Projected Market Valuation (2033) | USD 29.5 billion |
Value-based CAGR (2023 to 2033) | 10.7% |
Historical Data | 2018 to 2022 |
Forecast Period | 2023 to 2033 |
Quantitative Units | Value (USD billion) |
Segments Covered | Manufacturing Process, Thickness, Application, End Use, Region |
Regions Covered | North America; Latin America; East Asia; South Asia Pacific; Western Europe; Eastern Europe; Middle East & Africa |
Key Countries Covered | United States, Canada, Brazil, Mexico, Germany, Italy, France, United Kingdom, Spain, Russia, GCC Countries, India, China, Japan and Australia |
Key Companies Profiled | Aeon Glass (Aeon Industries Corp., Ltd); Air-Craftglass Inc.; Asahi Glass Co., Ltd; AvanStrate Inc. |
The ultra-thin glass market is valued at US$ 10.7 billion in 2023.
The ultra-thin glass market is set to expand at a 10.7% CAGR through 2033.
The ultra-thin glass market exhibited a CAGR of 13.7% during the historical period.
The ultra-thin glass market in Japan is estimated to record a CAGR of 10.6% by 2033.
The segment with less than 0.1 mm is expected to witness a CAGR of 10%.
China is expected to be a leading player in the global market, reaching US$ 6.4 billion by 2033.
1. Executive Summary
1.1. Global Market Outlook
1.2. Demand-side Trends
1.3. Supply-side Trends
1.4. Technology Roadmap Analysis
1.5. Analysis and Recommendations
2. Market Overview
2.1. Market Coverage / Taxonomy
2.2. Market Definition / Scope / Limitations
3. Market Background
3.1. Market Dynamics
3.1.1. Drivers
3.1.2. Restraints
3.1.3. Opportunity
3.1.4. Trends
3.2. Scenario Forecast
3.2.1. Demand in Optimistic Scenario
3.2.2. Demand in Likely Scenario
3.2.3. Demand in Conservative Scenario
3.3. Opportunity Map Analysis
3.4. Product Life Cycle Analysis
3.5. Supply Chain Analysis
3.5.1. Supply Side Participants and their Roles
3.5.1.1. Producers
3.5.1.2. Mid-Level Participants (Traders/ Agents/ Brokers)
3.5.1.3. Wholesalers and Distributors
3.5.2. Value Added and Value Created at Node in the Supply Chain
3.5.3. List of Raw Material Suppliers
3.5.4. List of Existing and Potential Buyer’s
3.6. Investment Feasibility Matrix
3.7. Value Chain Analysis
3.7.1. Profit Margin Analysis
3.7.2. Wholesalers and Distributors
3.7.3. Retailers
3.8. PESTLE and Porter’s Analysis
3.9. Regulatory Landscape
3.9.1. By Key Regions
3.9.2. By Key Countries
3.10. Regional Parent Market Outlook
3.11. Production and Consumption Statistics
3.12. Import and Export Statistics
4. Global Market Analysis 2018 to 2022 and Forecast, 2023 to 2033
4.1. Historical Market Size Value (US$ billion) & Volume (Sq.Ft) Analysis, 2018 to 2022
4.2. Current and Future Market Size Value (US$ billion) & Volume (Sq.Ft) Projections, 2023 to 2033
4.2.1. Y-o-Y Growth Trend Analysis
4.2.2. Absolute $ Opportunity Analysis
5. Global Market Analysis 2018 to 2022 and Forecast 2023 to 2033, By Manufacturing Process
5.1. Introduction / Key Findings
5.2. Historical Market Size Value (US$ billion) & Volume (Sq.Ft) Analysis By Manufacturing Process, 2018 to 2022
5.3. Current and Future Market Size Value (US$ billion) & Volume (Sq.Ft) Analysis and Forecast By Manufacturing Process, 2023 to 2033
5.3.1. Float
5.3.2. Fusion
5.3.3. Other Manufacturing Processes
5.4. Y-o-Y Growth Trend Analysis By Manufacturing Process, 2018 to 2022
5.5. Absolute $ Opportunity Analysis By Manufacturing Process, 2023 to 2033
6. Global Market Analysis 2018 to 2022 and Forecast 2023 to 2033, By Thickness
6.1. Introduction / Key Findings
6.2. Historical Market Size Value (US$ billion) & Volume (Sq.Ft) Analysis By Thickness, 2018 to 2022
6.3. Current and Future Market Size Value (US$ billion) & Volume (Sq.Ft) Analysis and Forecast By Thickness, 2023 to 2033
6.3.1. Less Than 0.1 mm
6.3.2. 0.1 to 0.5 mm
6.3.3. 0.5 to 1.0 mm
6.3.4. 1.0 to 1.2 mm
6.4. Y-o-Y Growth Trend Analysis By Thickness, 2018 to 2022
6.5. Absolute $ Opportunity Analysis By Thickness, 2023 to 2033
7. Global Market Analysis 2018 to 2022 and Forecast 2023 to 2033, By Application
7.1. Introduction / Key Findings
7.2. Historical Market Size Value (US$ billion) & Volume (Sq.Ft) Analysis By Application, 2018 to 2022
7.3. Current and Future Market Size Value (US$ billion) & Volume (Sq.Ft) Analysis and Forecast By Application, 2023 to 2033
7.3.1. Touch Panel Displays
7.3.2. Semiconductor Substrates
7.3.3. Fingerprint Sensors
7.3.4. Other Applications
7.4. Y-o-Y Growth Trend Analysis By Application, 2018 to 2022
7.5. Absolute $ Opportunity Analysis By Application, 2023 to 2033
8. Global Market Analysis 2018 to 2022 and Forecast 2023 to 2033, By End Use
8.1. Introduction / Key Findings
8.2. Historical Market Size Value (US$ billion) & Volume (Sq.Ft) Analysis By End Use, 2018 to 2022
8.3. Current and Future Market Size Value (US$ billion) & Volume (Sq.Ft) Analysis and Forecast By End Use, 2023 to 2033
8.3.1. Consumer Electronics
8.3.2. Automotive & Transportation
8.3.3. Medical & Healthcare
8.3.4. Other End Uses
8.4. Y-o-Y Growth Trend Analysis By End Use, 2018 to 2022
8.5. Absolute $ Opportunity Analysis By End Use, 2023 to 2033
9. Global Market Analysis 2018 to 2022 and Forecast 2023 to 2033, By Region
9.1. Introduction
9.2. Historical Market Size Value (US$ billion) & Volume (Sq.Ft) Analysis By Region, 2018 to 2022
9.3. Current Market Size Value (US$ billion) & Volume (Sq.Ft) Analysis and Forecast By Region, 2023 to 2033
9.3.1. North America
9.3.2. Latin America
9.3.3. Western Europe
9.3.4. Eastern Europe
9.3.5. South Asia and Pacific
9.3.6. East Asia
9.3.7. Middle East and Africa
9.4. Market Attractiveness Analysis By Region
10. North America Market Analysis 2018 to 2022 and Forecast 2023 to 2033, By Country
10.1. Historical Market Size Value (US$ billion) & Volume (Sq.Ft) Trend Analysis By Market Taxonomy, 2018 to 2022
10.2. Market Size Value (US$ billion) & Volume (Sq.Ft) Forecast By Market Taxonomy, 2023 to 2033
10.2.1. By Country
10.2.1.1. United States
10.2.1.2. Canada
10.2.2. By Manufacturing Process
10.2.3. By Thickness
10.2.4. By Application
10.2.5. By End Use
10.3. Market Attractiveness Analysis
10.3.1. By Country
10.3.2. By Manufacturing Process
10.3.3. By Thickness
10.3.4. By Application
10.3.5. By End Use
10.4. Key Takeaways
11. Latin America Market Analysis 2018 to 2022 and Forecast 2023 to 2033, By Country
11.1. Historical Market Size Value (US$ billion) & Volume (Sq.Ft) Trend Analysis By Market Taxonomy, 2018 to 2022
11.2. Market Size Value (US$ billion) & Volume (Sq.Ft) Forecast By Market Taxonomy, 2023 to 2033
11.2.1. By Country
11.2.1.1. Brazil
11.2.1.2. Mexico
11.2.1.3. Rest of Latin America
11.2.2. By Manufacturing Process
11.2.3. By Thickness
11.2.4. By Application
11.2.5. By End Use
11.3. Market Attractiveness Analysis
11.3.1. By Country
11.3.2. By Manufacturing Process
11.3.3. By Thickness
11.3.4. By Application
11.3.5. By End Use
11.4. Key Takeaways
12. Western Europe Market Analysis 2018 to 2022 and Forecast 2023 to 2033, By Country
12.1. Historical Market Size Value (US$ billion) & Volume (Sq.Ft) Trend Analysis By Market Taxonomy, 2018 to 2022
12.2. Market Size Value (US$ billion) & Volume (Sq.Ft) Forecast By Market Taxonomy, 2023 to 2033
12.2.1. By Country
12.2.1.1. Germany
12.2.1.2. United Kingdom
12.2.1.3. France
12.2.1.4. Spain
12.2.1.5. Italy
12.2.1.6. Rest of Western Europe
12.2.2. By Manufacturing Process
12.2.3. By Thickness
12.2.4. By Application
12.2.5. By End Use
12.3. Market Attractiveness Analysis
12.3.1. By Country
12.3.2. By Manufacturing Process
12.3.3. By Thickness
12.3.4. By Application
12.3.5. By End Use
12.4. Key Takeaways
13. Eastern Europe Market Analysis 2018 to 2022 and Forecast 2023 to 2033, By Country
13.1. Historical Market Size Value (US$ billion) & Volume (Sq.Ft) Trend Analysis By Market Taxonomy, 2018 to 2022
13.2. Market Size Value (US$ billion) & Volume (Sq.Ft) Forecast By Market Taxonomy, 2023 to 2033
13.2.1. By Country
13.2.1.1. Poland
13.2.1.2. Russia
13.2.1.3. Czech Republic
13.2.1.4. Romania
13.2.1.5. Rest of Eastern Europe
13.2.2. By Manufacturing Process
13.2.3. By Thickness
13.2.4. By Application
13.2.5. By End Use
13.3. Market Attractiveness Analysis
13.3.1. By Country
13.3.2. By Manufacturing Process
13.3.3. By Thickness
13.3.4. By Application
13.3.5. By End Use
13.4. Key Takeaways
14. South Asia and Pacific Market Analysis 2018 to 2022 and Forecast 2023 to 2033, By Country
14.1. Historical Market Size Value (US$ billion) & Volume (Sq.Ft) Trend Analysis By Market Taxonomy, 2018 to 2022
14.2. Market Size Value (US$ billion) & Volume (Sq.Ft) Forecast By Market Taxonomy, 2023 to 2033
14.2.1. By Country
14.2.1.1. India
14.2.1.2. Bangladesh
14.2.1.3. Australia
14.2.1.4. New Zealand
14.2.1.5. Rest of South Asia and Pacific
14.2.2. By Manufacturing Process
14.2.3. By Thickness
14.2.4. By Application
14.2.5. By End Use
14.3. Market Attractiveness Analysis
14.3.1. By Country
14.3.2. By Manufacturing Process
14.3.3. By Thickness
14.3.4. By Application
14.3.5. By End Use
14.4. Key Takeaways
15. East Asia Market Analysis 2018 to 2022 and Forecast 2023 to 2033, By Country
15.1. Historical Market Size Value (US$ billion) & Volume (Sq.Ft) Trend Analysis By Market Taxonomy, 2018 to 2022
15.2. Market Size Value (US$ billion) & Volume (Sq.Ft) Forecast By Market Taxonomy, 2023 to 2033
15.2.1. By Country
15.2.1.1. China
15.2.1.2. Japan
15.2.1.3. South Korea
15.2.2. By Manufacturing Process
15.2.3. By Thickness
15.2.4. By Application
15.2.5. By End Use
15.3. Market Attractiveness Analysis
15.3.1. By Country
15.3.2. By Manufacturing Process
15.3.3. By Thickness
15.3.4. By Application
15.3.5. By End Use
15.4. Key Takeaways
16. Middle East and Africa Market Analysis 2018 to 2022 and Forecast 2023 to 2033, By Country
16.1. Historical Market Size Value (US$ billion) & Volume (Sq.Ft) Trend Analysis By Market Taxonomy, 2018 to 2022
16.2. Market Size Value (US$ billion) & Volume (Sq.Ft) Forecast By Market Taxonomy, 2023 to 2033
16.2.1. By Country
16.2.1.1. GCC Countries
16.2.1.2. South Africa
16.2.1.3. Israel
16.2.1.4. Rest of Middle East and Africa
16.2.2. By Manufacturing Process
16.2.3. By Thickness
16.2.4. By Application
16.2.5. By End Use
16.3. Market Attractiveness Analysis
16.3.1. By Country
16.3.2. By Manufacturing Process
16.3.3. By Thickness
16.3.4. By Application
16.3.5. By End Use
16.4. Key Takeaways
17. Key Countries Market Analysis
17.1. United States
17.1.1. Pricing Analysis
17.1.2. Market Share Analysis, 2022
17.1.2.1. By Manufacturing Process
17.1.2.2. By Thickness
17.1.2.3. By Application
17.1.2.4. By End Use
17.2. Canada
17.2.1. Pricing Analysis
17.2.2. Market Share Analysis, 2022
17.2.2.1. By Manufacturing Process
17.2.2.2. By Thickness
17.2.2.3. By Application
17.2.2.4. By End Use
17.3. Brazil
17.3.1. Pricing Analysis
17.3.2. Market Share Analysis, 2022
17.3.2.1. By Manufacturing Process
17.3.2.2. By Thickness
17.3.2.3. By Application
17.3.2.4. By End Use
17.4. Mexico
17.4.1. Pricing Analysis
17.4.2. Market Share Analysis, 2022
17.4.2.1. By Manufacturing Process
17.4.2.2. By Thickness
17.4.2.3. By Application
17.4.2.4. By End Use
17.5. Germany
17.5.1. Pricing Analysis
17.5.2. Market Share Analysis, 2022
17.5.2.1. By Manufacturing Process
17.5.2.2. By Thickness
17.5.2.3. By Application
17.5.2.4. By End Use
17.6. United Kingdom
17.6.1. Pricing Analysis
17.6.2. Market Share Analysis, 2022
17.6.2.1. By Manufacturing Process
17.6.2.2. By Thickness
17.6.2.3. By Application
17.6.2.4. By End Use
17.7. France
17.7.1. Pricing Analysis
17.7.2. Market Share Analysis, 2022
17.7.2.1. By Manufacturing Process
17.7.2.2. By Thickness
17.7.2.3. By Application
17.7.2.4. By End Use
17.8. Spain
17.8.1. Pricing Analysis
17.8.2. Market Share Analysis, 2022
17.8.2.1. By Manufacturing Process
17.8.2.2. By Thickness
17.8.2.3. By Application
17.8.2.4. By End Use
17.9. Italy
17.9.1. Pricing Analysis
17.9.2. Market Share Analysis, 2022
17.9.2.1. By Manufacturing Process
17.9.2.2. By Thickness
17.9.2.3. By Application
17.9.2.4. By End Use
17.10. Poland
17.10.1. Pricing Analysis
17.10.2. Market Share Analysis, 2022
17.10.2.1. By Manufacturing Process
17.10.2.2. By Thickness
17.10.2.3. By Application
17.10.2.4. By End Use
17.11. Russia
17.11.1. Pricing Analysis
17.11.2. Market Share Analysis, 2022
17.11.2.1. By Manufacturing Process
17.11.2.2. By Thickness
17.11.2.3. By Application
17.11.2.4. By End Use
17.12. Czech Republic
17.12.1. Pricing Analysis
17.12.2. Market Share Analysis, 2022
17.12.2.1. By Manufacturing Process
17.12.2.2. By Thickness
17.12.2.3. By Application
17.12.2.4. By End Use
17.13. Romania
17.13.1. Pricing Analysis
17.13.2. Market Share Analysis, 2022
17.13.2.1. By Manufacturing Process
17.13.2.2. By Thickness
17.13.2.3. By Application
17.13.2.4. By End Use
17.14. India
17.14.1. Pricing Analysis
17.14.2. Market Share Analysis, 2022
17.14.2.1. By Manufacturing Process
17.14.2.2. By Thickness
17.14.2.3. By Application
17.14.2.4. By End Use
17.15. Bangladesh
17.15.1. Pricing Analysis
17.15.2. Market Share Analysis, 2022
17.15.2.1. By Manufacturing Process
17.15.2.2. By Thickness
17.15.2.3. By Application
17.15.2.4. By End Use
17.16. Australia
17.16.1. Pricing Analysis
17.16.2. Market Share Analysis, 2022
17.16.2.1. By Manufacturing Process
17.16.2.2. By Thickness
17.16.2.3. By Application
17.16.2.4. By End Use
17.17. New Zealand
17.17.1. Pricing Analysis
17.17.2. Market Share Analysis, 2022
17.17.2.1. By Manufacturing Process
17.17.2.2. By Thickness
17.17.2.3. By Application
17.17.2.4. By End Use
17.18. China
17.18.1. Pricing Analysis
17.18.2. Market Share Analysis, 2022
17.18.2.1. By Manufacturing Process
17.18.2.2. By Thickness
17.18.2.3. By Application
17.18.2.4. By End Use
17.19. Japan
17.19.1. Pricing Analysis
17.19.2. Market Share Analysis, 2022
17.19.2.1. By Manufacturing Process
17.19.2.2. By Thickness
17.19.2.3. By Application
17.19.2.4. By End Use
17.20. South Korea
17.20.1. Pricing Analysis
17.20.2. Market Share Analysis, 2022
17.20.2.1. By Manufacturing Process
17.20.2.2. By Thickness
17.20.2.3. By Application
17.20.2.4. By End Use
17.21. GCC Countries
17.21.1. Pricing Analysis
17.21.2. Market Share Analysis, 2022
17.21.2.1. By Manufacturing Process
17.21.2.2. By Thickness
17.21.2.3. By Application
17.21.2.4. By End Use
17.22. South Africa
17.22.1. Pricing Analysis
17.22.2. Market Share Analysis, 2022
17.22.2.1. By Manufacturing Process
17.22.2.2. By Thickness
17.22.2.3. By Application
17.22.2.4. By End Use
17.23. Israel
17.23.1. Pricing Analysis
17.23.2. Market Share Analysis, 2022
17.23.2.1. By Manufacturing Process
17.23.2.2. By Thickness
17.23.2.3. By Application
17.23.2.4. By End Use
18. Market Structure Analysis
18.1. Competition Dashboard
18.2. Competition Benchmarking
18.3. Market Share Analysis of Top Players
18.3.1. By Regional
18.3.2. By Manufacturing Process
18.3.3. By Thickness
18.3.4. By Application
18.3.5. By End Use
19. Competition Analysis
19.1. Competition Deep Dive
19.1.1. Aeon Glass - Aeon Industries Corp.
19.1.1.1. Overview
19.1.1.2. Product Portfolio
19.1.1.3. Profitability by Market Segments
19.1.1.4. Sales Footprint
19.1.1.5. Strategy Overview
19.1.1.5.1. Marketing Strategy
19.1.1.5.2. Product Strategy
19.1.1.5.3. Channel Strategy
19.1.2. Air-Craftglass Inc.
19.1.2.1. Overview
19.1.2.2. Product Portfolio
19.1.2.3. Profitability by Market Segments
19.1.2.4. Sales Footprint
19.1.2.5. Strategy Overview
19.1.2.5.1. Marketing Strategy
19.1.2.5.2. Product Strategy
19.1.2.5.3. Channel Strategy
19.1.3. Asahi Glass Co.
19.1.3.1. Overview
19.1.3.2. Product Portfolio
19.1.3.3. Profitability by Market Segments
19.1.3.4. Sales Footprint
19.1.3.5. Strategy Overview
19.1.3.5.1. Marketing Strategy
19.1.3.5.2. Product Strategy
19.1.3.5.3. Channel Strategy
19.1.4. AvanStrate Inc.
19.1.4.1. Overview
19.1.4.2. Product Portfolio
19.1.4.3. Profitability by Market Segments
19.1.4.4. Sales Footprint
19.1.4.5. Strategy Overview
19.1.4.5.1. Marketing Strategy
19.1.4.5.2. Product Strategy
19.1.4.5.3. Channel Strategy
19.1.5. AviationGlass & Technology BV
19.1.5.1. Overview
19.1.5.2. Product Portfolio
19.1.5.3. Profitability by Market Segments
19.1.5.4. Sales Footprint
19.1.5.5. Strategy Overview
19.1.5.5.1. Marketing Strategy
19.1.5.5.2. Product Strategy
19.1.5.5.3. Channel Strategy
19.1.6. Central Glass Co.
19.1.6.1. Overview
19.1.6.2. Product Portfolio
19.1.6.3. Profitability by Market Segments
19.1.6.4. Sales Footprint
19.1.6.5. Strategy Overview
19.1.6.5.1. Marketing Strategy
19.1.6.5.2. Product Strategy
19.1.6.5.3. Channel Strategy
19.1.7. Changzhou Almaden Co.
19.1.7.1. Overview
19.1.7.2. Product Portfolio
19.1.7.3. Profitability by Market Segments
19.1.7.4. Sales Footprint
19.1.7.5. Strategy Overview
19.1.7.5.1. Marketing Strategy
19.1.7.5.2. Product Strategy
19.1.7.5.3. Channel Strategy
19.1.8. China National Building Material Co.
19.1.8.1. Overview
19.1.8.2. Product Portfolio
19.1.8.3. Profitability by Market Segments
19.1.8.4. Sales Footprint
19.1.8.5. Strategy Overview
19.1.8.5.1. Marketing Strategy
19.1.8.5.2. Product Strategy
19.1.8.5.3. Channel Strategy
19.1.9. Corning
19.1.9.1. Overview
19.1.9.2. Product Portfolio
19.1.9.3. Profitability by Market Segments
19.1.9.4. Sales Footprint
19.1.9.5. Strategy Overview
19.1.9.5.1. Marketing Strategy
19.1.9.5.2. Product Strategy
19.1.9.5.3. Channel Strategy
19.1.10. CSG Holding Co. Ltd.
19.1.10.1. Overview
19.1.10.2. Product Portfolio
19.1.10.3. Profitability by Market Segments
19.1.10.4. Sales Footprint
19.1.10.5. Strategy Overview
19.1.10.5.1. Marketing Strategy
19.1.10.5.2. Product Strategy
19.1.10.5.3. Channel Strategy
19.1.11. Emerge Glass India Pvt. Ltd.
19.1.11.1. Overview
19.1.11.2. Product Portfolio
19.1.11.3. Profitability by Market Segments
19.1.11.4. Sales Footprint
19.1.11.5. Strategy Overview
19.1.11.5.1. Marketing Strategy
19.1.11.5.2. Product Strategy
19.1.11.5.3. Channel Strategy
19.1.12. Hilgenberg GmbH
19.1.12.1. Overview
19.1.12.2. Product Portfolio
19.1.12.3. Profitability by Market Segments
19.1.12.4. Sales Footprint
19.1.12.5. Strategy Overview
19.1.12.5.1. Marketing Strategy
19.1.12.5.2. Product Strategy
19.1.12.5.3. Channel Strategy
19.1.13. Hoya Corporation USA Optics Division
19.1.13.1. Overview
19.1.13.2. Product Portfolio
19.1.13.3. Profitability by Market Segments
19.1.13.4. Sales Footprint
19.1.13.5. Strategy Overview
19.1.13.5.1. Marketing Strategy
19.1.13.5.2. Product Strategy
19.1.13.5.3. Channel Strategy
19.1.14. Huihua Glass Co.
19.1.14.1. Overview
19.1.14.2. Product Portfolio
19.1.14.3. Profitability by Market Segments
19.1.14.4. Sales Footprint
19.1.14.5. Strategy Overview
19.1.14.5.1. Marketing Strategy
19.1.14.5.2. Product Strategy
19.1.14.5.3. Channel Strategy
19.1.15. Luoyang Glass Co.
19.1.15.1. Overview
19.1.15.2. Product Portfolio
19.1.15.3. Profitability by Market Segments
19.1.15.4. Sales Footprint
19.1.15.5. Strategy Overview
19.1.15.5.1. Marketing Strategy
19.1.15.5.2. Product Strategy
19.1.15.5.3. Channel Strategy
19.1.16. Nippon Electric Glass Co.
19.1.16.1. Overview
19.1.16.2. Product Portfolio
19.1.16.3. Profitability by Market Segments
19.1.16.4. Sales Footprint
19.1.16.5. Strategy Overview
19.1.16.5.1. Marketing Strategy
19.1.16.5.2. Product Strategy
19.1.16.5.3. Channel Strategy
19.1.17. Nippon Sheet Glass Co.
19.1.17.1. Overview
19.1.17.2. Product Portfolio
19.1.17.3. Profitability by Market Segments
19.1.17.4. Sales Footprint
19.1.17.5. Strategy Overview
19.1.17.5.1. Marketing Strategy
19.1.17.5.2. Product Strategy
19.1.17.5.3. Channel Strategy
19.1.18. Nitto Boseki Co.
19.1.18.1. Overview
19.1.18.2. Product Portfolio
19.1.18.3. Profitability by Market Segments
19.1.18.4. Sales Footprint
19.1.18.5. Strategy Overview
19.1.18.5.1. Marketing Strategy
19.1.18.5.2. Product Strategy
19.1.18.5.3. Channel Strategy
19.1.19. Noval Glass Group Ltd.
19.1.19.1. Overview
19.1.19.2. Product Portfolio
19.1.19.3. Profitability by Market Segments
19.1.19.4. Sales Footprint
19.1.19.5. Strategy Overview
19.1.19.5.1. Marketing Strategy
19.1.19.5.2. Product Strategy
19.1.19.5.3. Channel Strategy
19.1.20. Runtai Industry Co.
19.1.20.1. Overview
19.1.20.2. Product Portfolio
19.1.20.3. Profitability by Market Segments
19.1.20.4. Sales Footprint
19.1.20.5. Strategy Overview
19.1.20.5.1. Marketing Strategy
19.1.20.5.2. Product Strategy
19.1.20.5.3. Channel Strategy
20. Assumptions & Acronyms Used
21. Research Methodology
Chemicals & Materials
February 2023
REP-GB-167
325 pages
Explore Chemicals & Materials Insights
View Reports