Triathlon Clothing Market Snapshot (2023 to 2033)

According to the recent report by Future Market Insights (FMI), the triathlon clothing market is estimated to stand at US$ 4,928.61 million by 2033. Over the forecast period, the market is assessed to trail at a CAGR of 9%. For the year 2023, FMI has estimated the market to be worth US$ 2,081.90 million. Given below are some of the factors augmenting product sales:

  • Increase in events arranged by triathlon governing authorities of diverse regions.
  • Surge in the population participating in triathlons and other sports, such as running, cycling, and swimming.
  • Rapid commercialization and evolving lifestyle trends, especially in emerging economies.
  • Accelerating the rate of obesity and heightened public awareness regarding the benefits of cycling and swimming.
  • Growing emphasis of top manufacturers on technological upgradations of triathlon clothing.
  • Elevating the popularity of triathlon championships and competitions.
  • Expanding awareness regarding sports among women and millennials.

Market Trends:

  • Triathlon clothing is now being designed to protect from UV radiation and facilitate professional athletes to give superior performance.
  • Deployment of marketing strategies, along with brand positioning and creative advertising to invigorate interest in triathlon and associated apparel.

Market Growth Inhibitors:

  • Market growth may be restricted by the strong pricing pressure among manufacturers.
  • High prices associated with the production of premium-quality triathlon apparel.
  • Availability of alternatives in the market.
  • Feeble supply chain and the absence of a vigorous distribution channel might hinder the scope of the market.

Government Bodies of Different Countries Supporting the Sports Sector

Several government initiatives to build sports infrastructure in different countries is facilitating industry growth. In June 2019, for instance, the State General Sports Administration of China, MIIT, and nine departments together proceeded with an action plan to develop sports infrastructure on a domestic level. Plans like these are crucial in disseminating consumer awareness regarding domestic sports activities.

Triathlon Clothing Market Value (2023) US$ 2,081.90 million
Triathlon Clothing Market Forecast Value (2033) US$ 4,928.61 million
Triathlon Clothing Market CAGR (2023 to 2033) 9%

Don't pay for what you don't need

Customize your report by selecting specific countries or regions and save 30%!

2018 to 2022 Triathlon Clothing Demand Outlook Compared to 2023 to 2033 Market Forecast

The market generated a revenue of US$ 1,910 million in 2022. Going forward, the market is set to expand at a CAGR of 9% to reach US$ 2,081.90 million in 2023. By 2033 end, the market is anticipated to attain a market valuation of US$ 4,928.61 million.

The industry is being favored by the establishment of organizations to promote gender equality in sports. Women and girls across diverse sports, including triathlon, are seeking equal responsibilities, rights, and opportunities. Measures are being taken to bridge the gender gap in triathlon by empowering and supporting women spanning all sectors of the triathlon workforce. These include women in coaching, club administration, athletes, and officiating.

Since triathlon is gradually gaining worldwide recognition, the triathlon clothing market is, as a consequence, expected to generate significant revenue in the coming years. This is also supported by the upsurge in people taking up sports. FMI focuses on industry growth over the course of the forecast period.

Predicted Evolution of theTriathlon Clothing Industry Over the Forecast Period

Duration Market Analysis
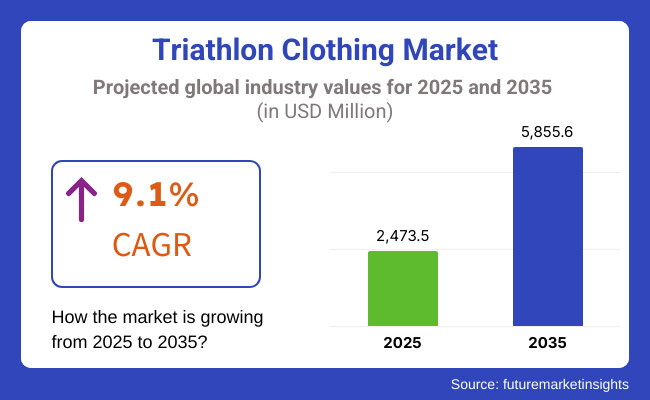
Short-term Growth (2022 to 2025) The market is anticipated to stand at a valuation of US$ 2,473.51 million by 2025. Triathlon sports are still way behind in being a mainstream sport in emerging economies, like India. Athletes do not get a specialized coach for this sport, and the lack of facilities, recognition, and awareness of triathlons is also pervasive in developing countries. However, due to the growing interest in these sports in such countries, as seen by sports enthusiasts taking up triathlon championships, the triathlon clothing manufacturers are tapping into the regions with low penetration. Certain factors, such as the increasing discretionary income, changing lifestyle, and rise in passion-related activities, are propelling the market growth.
Medium-term Growth (2025 to 2028) By 2028 end, the market is estimated to surpass the market worth of US$ 3,203.26 million. Increasing government initiatives to stimulate the sports industry is projected to foster market development. Triathlon apparel is necessary for efficiently performing different category sports. As a result, a surge in triathlon players is increasing the purchases related to triathlon apparel.
Long-term Growth (2028 to 2033) The market is projected to amass a total of US$ 4,928.61 million by 2033. In the long run, the triathlon apparel industry is expanding at a significant rate owing to many marketing strategies. The market expansion is expected to be supported by technological innovations in triathlon apparel to boost the overall performance efficiency of the wearer. Growing inclusivity in sports and efforts to give equal opportunities to females is expected to play a significant role in market growth.

Geographic Forecast:

United States to Take Hold of a Considerable Market Share

The United States triathlon clothing industry is estimated to account for a prominent share of the market over the forecast period. This can be attributed to the high density of national and international level competitions in the country. Competitions like Sprint Triathlon Championship takes place in the country on an annual basis. In addition to this, eight Ironman races are also observed that involve an average of 16,000 Ironmen and women.

The country significantly contributes towards the regional spending on research and development activities for ethical fashion materials and textiles made with low-impact methods like recycled nylon and organic cotton. In the long run, these factors are expected to have a positive impact on the triathlon clothing market.

The triathlon clothing industry in Canada is also witnessing healthy growth on account of various innovations developed by key players active in the region. The presence of active triathlon athletes in the country is another factor stimulating market growth.

Growing Consumer Engagement in Fitness and Sports to Stir Market Expansion in the United Kingdom

The triathlon clothing industry in the United Kingdom is expected to witness healthy growth in the coming years. As per the ‘European health and fitness market report 2020’, published by EuropeActive, the number of people who go to fitness and health clubs crossed 65 million in the year 2019.

The increasing purchases of triathlon clothing are being led by the surging participation of people in triathlon events. This trend further supports consumer engagement in fitness and sports clubs. In industrialized countries like the United Kingdom and Germany, where innovative triathlon clothing options are readily available, the surging consumer expenditure is anticipated to boost market growth in the coming years.

Sudip Saha
Sudip Saha

Principal Consultant

Talk to Analyst

Find your sweet spots for generating winning opportunities in this market.

Category-wise Insights:

Tri-suits to Acquire Large Portion of the Market

On the basis of type, the tri-suits segment is projected to account for a significant market percentage in the forecast period. The growing number of male and female triathletes is expected to propel the demand for tri-suits, which are suitable for men and women alike. Additionally, tri-suits are stretchable and support the body while cycling and jogging. Features such as breathability, quick drying technology, zipper access, quick wicking, etc. are also supporting the sale of tri-suits. In addition to this, the rising willingness of consumers to expend on triathlon clothing is expanding the segment growth.

Tri shorts Segment to Grow at a Robust Pace

The tri shorts segment is estimated to expand by 8% over the upcoming years. The growing interest of people in sports activities such as cycling, swimming, etc. is pushing the sales of tri shorts. Moreover, the increasing demand for comfortable yet stylish tri shorts has surged consumer inclination towards triathlon clothing. To cater to the surging consumer demand, manufacturers of triathlon apparel are releasing new products in a range of designs for every body shape and age group with the option for customization.

Men's Section to Account for a Dominant Share in Triathlon Clothing Industry

The men's section held a large proportion of the market in 2022. This can be attributed to the large attendance of males at informal and formal events such as Ironman. As per Triathlon Australia, in the year 2019, a mighty share of triathlon participants in Australia consisted of males. Furthermore, proactive players are also making investments in the launch of the triathlon-apparel collection to meet the country-based demand. Triathlon clothing brands such as HUUBINDIA have a selection of clothing for men, which comprises tri suits, wet suits, and different triathlon gear.

Increasing Women's Participation to Result in Robust Expansion of Women's Section

The women's section is anticipated to assume a robust pace, growing at a CAGR of 9.6%, in the coming years. An increase in women’s participation in triathlon events and government initiatives are chief drivers pushing the segment's growth. Take, for example, the investments made by the Canadian government for a total of US$ 7.5 billion as part of Investing in Canada Infrastructure Program (ICIP). More women are anticipated to participate in multiple sports categories on account of surging investments in sports infrastructure. Players like Coeur Sports are focusing on developing triathlon clothing, specially made for such activities. This is because the key players acknowledge the potential of this target demographic.

Online Segment to Acquire Significant Market Share

The online segment is assessed to hold a significant market share in the coming years. This can be credited to the shifting consumer inclination towards online distribution channels. Various benefits like simple payment methods, doorstep delivery, and wide product availability are propelling the growth of online shares. Online platforms are also motivated by the rising use of e-commerce websites and the deep penetration of internet facilities.

Competitive Intelligence

The competitive landscape of the triathlon clothing industry is marked by plentiful players. Top companies in the market are employing expansion tactics like partnerships, mergers, and acquisitions, and releasing novel products to gain a competitive edge over other players. Take for instance, in April 2022, Zone3 Ltd. introduced a breaststroke wetsuit. The launch of this product was in response to the widening population base seeking something they can swim breaststroke and front crawl with. The product is predicted to become necessary sportswear for open-water swimmers.

Companies and their Recent Innovations

Zoot Sports The company offers quality running shoes, cycle apparel, and wetsuits, among others, for running and triathlon sports.
News Release In October 2022, Zoot Sports introduced Ultra P1, a revolutionary triathlon race suit. Armed with 40 years of knowledge pertaining to triathlon apparel, the company has developed this incredibly fast race suit. The product is engineered for legendary speed, comfort, and functionality.
PEARL iZUMi The company is known for its expertise in cycling, mountain biking, and outdoor gear. The firm provides men’s and women’s cycling jerseys, bike shorts, bike shoes, etc.
News Release In April 2018, PEARL iZUMi partnered with iracelikagirl on an exclusive custom apparel collection.

Leading Players in the Triathlon Clothing Industry Include:

  • Zone3 Ltd.
  • Zoot Sports
  • De Soto Clothing Company, Inc
  • Louis Garneau Sports
  • Fanatics Inc.
  • 2XU
  • Pearl Izumi
  • Orca
  • Kiwami Triathlon
  • TYR SPORT. INC.

Get the data you need at a Fraction of the cost

Personalize your report by choosing insights you need
and save 40%!

Scope of Report

Attribute Details
Forecast Period 2023 to 2033
Historical Data Available for 2018 to 2022
Market Analysis US$ million for Value
Key Regions Covered North America; Latin America; Europe; East Asia; South Asia; Middle East & Africa; & Oceania
Key Countries Covered The USA, Canada, Germany, the United Kingdom, France, Italy, NORDICS, Spain, Russia, Poland, BENELUX, China, Japan, India, ASEAN, Oceania, South Korea, Brazil, Mexico, Argentina, GCC Countries, South Africa, Northern Africa, Türkiye
Key Segments Covered Type, Application, Distribution Channel, and Region
Key Companies Profiled Zone3 Ltd.; Zoot Sports; De Soto Clothing Company, Inc; Louis Garneau Sports; Fanatics Inc.; 2XU; Pearl Izumi; Orca; Kiwami Triathlon; TYR SPORT. INC.
Report Coverage Market Forecast, Company Share Analysis, Competition Intelligence, DROT Analysis, Market Dynamics and Challenges, and Strategic Growth Initiatives
Customization & Pricing Available upon Request

Triathlon Clothing Market by Category

By Type, the Triathlon Clothing Industry is segmented as:

  • Tri Tops
  • Tri Shorts
  • Tri Suits

By Application, the Triathlon Clothing Industry is categorized as:

  • Men
  • Women

By Distribution Channel, the Triathlon Clothing Industry is bifurcated as:

  • Online
  • Offline

By Region, the Industry of Triathlon Clothing is segmented as:

  • North America
  • Latin America
  • Europe
  • East Asia
  • South Asia
  • Oceania
  • Middle East & Africa

Frequently Asked Questions

How much is the Global Triathlon Clothing Market Projected to Attain by 2033 end?

The global triathlon clothing market is projected to reach a valuation of US$ 4,928.61 million by 2033.

Which are the Top Companies Providing Triathlon Clothing?

Zone3 Ltd. and Zoot Sports are the top players in the triathlon clothing industry.

Which Region is Expected to Dominate the Triathlon Clothing Market?

The United States is expected to dominate the triathlon clothing industry throughout the forecast period.

At what CAGR is the Global Triathlon Clothing Market Projected to Grow in the Forecast Period?

The global triathlon clothing industry is projected to grow at a CAGR of 9%.

Table of Content

1. Executive Summary | Triathlon Clothing Market

    1.1. Global Market Outlook

    1.2. Demand-side Trends

    1.3. Supply-side Trends

    1.4. Technology Roadmap Analysis

    1.5. Analysis and Recommendations

2. Market Overview

    2.1. Market Coverage / Taxonomy

    2.2. Market Definition / Scope / Limitations

3. Market Background

    3.1. Market Dynamics

        3.1.1. Drivers

        3.1.2. Restraints

        3.1.3. Opportunity

        3.1.4. Trends

    3.2. Scenario Forecast

        3.2.1. Demand in Optimistic Scenario

        3.2.2. Demand in Likely Scenario

        3.2.3. Demand in Conservative Scenario

    3.3. Opportunity Map Analysis

    3.4. Product Life Cycle Analysis

    3.5. Supply Chain Analysis

        3.5.1. Supply Side Participants and their Roles

            3.5.1.1. Producers

            3.5.1.2. Mid-Level Participants (Traders/ Agents/ Brokers)

            3.5.1.3. Wholesalers and Distributors

        3.5.2. Value Added and Value Created at Node in the Supply Chain

        3.5.3. List of Raw Material Suppliers

        3.5.4. List of Existing and Potential Buyers

    3.6. Investment Feasibility Matrix

    3.7. Value Chain Analysis

        3.7.1. Profit Margin Analysis

        3.7.2. Wholesalers and Distributors

        3.7.3. Retailers

    3.8. PESTLE and Porter’s Analysis

    3.9. Regulatory Landscape

        3.9.1. By Key Regions

        3.9.2. By Key Countries

    3.10. Regional Parent Market Outlook

    3.11. Production and Consumption Statistics

    3.12. Import and Export Statistics

4. Global Market Analysis 2018 to 2022 and Forecast, 2023 to 2033

    4.1. Historical Market Size Value (US$ Million) & Volume (Units) Analysis, 2018-2022

    4.2. Current and Future Market Size Value (US$ Million) & Volume (Units) Projections, 2023 to 2033

        4.2.1. Y-o-Y Growth Trend Analysis

        4.2.2. Absolute $ Opportunity Analysis

5. Global Market Analysis 2018 to 2022 and Forecast 2023 to 2033, By Type

    5.1. Introduction / Key Findings

    5.2. Historical Market Size Value (US$ Million) & Volume (Units) Analysis By Type, 2018-2022

    5.3. Current and Future Market Size Value (US$ Million) & Volume (Units) Analysis and Forecast By Type, 2023 to 2033

        5.3.1. Tri Tops

        5.3.2. Tri Shorts

        5.3.3. Tri Suits

    5.4. Y-o-Y Growth Trend Analysis By Type, 2018-2022

    5.5. Absolute $ Opportunity Analysis By Type, 2023 to 2033

6. Global Market Analysis 2018 to 2022 and Forecast 2023 to 2033, By Application

    6.1. Introduction / Key Findings

    6.2. Historical Market Size Value (US$ Million) & Volume (Units) Analysis By Application, 2018-2022

    6.3. Current and Future Market Size Value (US$ Million) & Volume (Units) Analysis and Forecast By Application, 2023 to 2033

        6.3.1. Men

        6.3.2. Women

    6.4. Y-o-Y Growth Trend Analysis By Application, 2018-2022

    6.5. Absolute $ Opportunity Analysis By Application, 2023 to 2033

7. Global Market Analysis 2018 to 2022 and Forecast 2023 to 2033, By Region

    7.1. Introduction

    7.2. Historical Market Size Value (US$ Million) & Volume (Units) Analysis By Region, 2018-2022

    7.3. Current Market Size Value (US$ Million) & Volume (Units) Analysis and Forecast By Region, 2023 to 2033

        7.3.1. North America

        7.3.2. Latin America

        7.3.3. Europe

        7.3.4. Asia Pacific

        7.3.5. MEA

    7.4. Market Attractiveness Analysis By Region

8. North America Market Analysis 2018 to 2022 and Forecast 2023 to 2033, By Country

    8.1. Historical Market Size Value (US$ Million) & Volume (Units) Trend Analysis By Market Taxonomy, 2018-2022

    8.2. Market Size Value (US$ Million) & Volume (Units) Forecast By Market Taxonomy, 2023 to 2033

        8.2.1. By Country

            8.2.1.1. USA

            8.2.1.2. Canada

        8.2.2. By Type

        8.2.3. By Application

    8.3. Market Attractiveness Analysis

        8.3.1. By Country

        8.3.2. By Type

        8.3.3. By Application

    8.4. Key Takeaways

9. Latin America Market Analysis 2018 to 2022 and Forecast 2023 to 2033, By Country

    9.1. Historical Market Size Value (US$ Million) & Volume (Units) Trend Analysis By Market Taxonomy, 2018-2022

    9.2. Market Size Value (US$ Million) & Volume (Units) Forecast By Market Taxonomy, 2023 to 2033

        9.2.1. By Country

            9.2.1.1. Brazil

            9.2.1.2. Mexico

            9.2.1.3. Rest of Latin America

        9.2.2. By Type

        9.2.3. By Application

    9.3. Market Attractiveness Analysis

        9.3.1. By Country

        9.3.2. By Type

        9.3.3. By Application

    9.4. Key Takeaways

10. Europe Market Analysis 2018 to 2022 and Forecast 2023 to 2033, By Country

    10.1. Historical Market Size Value (US$ Million) & Volume (Units) Trend Analysis By Market Taxonomy, 2018-2022

    10.2. Market Size Value (US$ Million) & Volume (Units) Forecast By Market Taxonomy, 2023 to 2033

        10.2.1. By Country

            10.2.1.1. Germany

            10.2.1.2. United Kingdom

            10.2.1.3. France

            10.2.1.4. Spain

            10.2.1.5. Italy

            10.2.1.6. Rest of Europe

        10.2.2. By Type

        10.2.3. By Application

    10.3. Market Attractiveness Analysis

        10.3.1. By Country

        10.3.2. By Type

        10.3.3. By Application

    10.4. Key Takeaways

11. Asia Pacific Market Analysis 2018 to 2022 and Forecast 2023 to 2033, By Country

    11.1. Historical Market Size Value (US$ Million) & Volume (Units) Trend Analysis By Market Taxonomy, 2018-2022

    11.2. Market Size Value (US$ Million) & Volume (Units) Forecast By Market Taxonomy, 2023 to 2033

        11.2.1. By Country

            11.2.1.1. China

            11.2.1.2. Japan

            11.2.1.3. South Korea

            11.2.1.4. Singapore

            11.2.1.5. Thailand

            11.2.1.6. Indonesia

            11.2.1.7. Australia

            11.2.1.8. New Zealand

            11.2.1.9. Rest of Asia Pacific

        11.2.2. By Type

        11.2.3. By Application

    11.3. Market Attractiveness Analysis

        11.3.1. By Country

        11.3.2. By Type

        11.3.3. By Application

    11.4. Key Takeaways

12. MEA Market Analysis 2018 to 2022 and Forecast 2023 to 2033, By Country

    12.1. Historical Market Size Value (US$ Million) & Volume (Units) Trend Analysis By Market Taxonomy, 2018-2022

    12.2. Market Size Value (US$ Million) & Volume (Units) Forecast By Market Taxonomy, 2023 to 2033

        12.2.1. By Country

            12.2.1.1. GCC Countries

            12.2.1.2. South Africa

            12.2.1.3. Israel

            12.2.1.4. Rest of MEA

        12.2.2. By Type

        12.2.3. By Application

    12.3. Market Attractiveness Analysis

        12.3.1. By Country

        12.3.2. By Type

        12.3.3. By Application

    12.4. Key Takeaways

13. Key Countries Market Analysis

    13.1. USA

        13.1.1. Pricing Analysis

        13.1.2. Market Share Analysis, 2022

            13.1.2.1. By Type

            13.1.2.2. By Application

    13.2. Canada

        13.2.1. Pricing Analysis

        13.2.2. Market Share Analysis, 2022

            13.2.2.1. By Type

            13.2.2.2. By Application

    13.3. Brazil

        13.3.1. Pricing Analysis

        13.3.2. Market Share Analysis, 2022

            13.3.2.1. By Type

            13.3.2.2. By Application

    13.4. Mexico

        13.4.1. Pricing Analysis

        13.4.2. Market Share Analysis, 2022

            13.4.2.1. By Type

            13.4.2.2. By Application

    13.5. Germany

        13.5.1. Pricing Analysis

        13.5.2. Market Share Analysis, 2022

            13.5.2.1. By Type

            13.5.2.2. By Application

    13.6. United Kingdom

        13.6.1. Pricing Analysis

        13.6.2. Market Share Analysis, 2022

            13.6.2.1. By Type

            13.6.2.2. By Application

    13.7. France

        13.7.1. Pricing Analysis

        13.7.2. Market Share Analysis, 2022

            13.7.2.1. By Type

            13.7.2.2. By Application

    13.8. Spain

        13.8.1. Pricing Analysis

        13.8.2. Market Share Analysis, 2022

            13.8.2.1. By Type

            13.8.2.2. By Application

    13.9. Italy

        13.9.1. Pricing Analysis

        13.9.2. Market Share Analysis, 2022

            13.9.2.1. By Type

            13.9.2.2. By Application

    13.10. China

        13.10.1. Pricing Analysis

        13.10.2. Market Share Analysis, 2022

            13.10.2.1. By Type

            13.10.2.2. By Application

    13.11. Japan

        13.11.1. Pricing Analysis

        13.11.2. Market Share Analysis, 2022

            13.11.2.1. By Type

            13.11.2.2. By Application

    13.12. South Korea

        13.12.1. Pricing Analysis

        13.12.2. Market Share Analysis, 2022

            13.12.2.1. By Type

            13.12.2.2. By Application

    13.13. Singapore

        13.13.1. Pricing Analysis

        13.13.2. Market Share Analysis, 2022

            13.13.2.1. By Type

            13.13.2.2. By Application

    13.14. Thailand

        13.14.1. Pricing Analysis

        13.14.2. Market Share Analysis, 2022

            13.14.2.1. By Type

            13.14.2.2. By Application

    13.15. Indonesia

        13.15.1. Pricing Analysis

        13.15.2. Market Share Analysis, 2022

            13.15.2.1. By Type

            13.15.2.2. By Application

    13.16. Australia

        13.16.1. Pricing Analysis

        13.16.2. Market Share Analysis, 2022

            13.16.2.1. By Type

            13.16.2.2. By Application

    13.17. New Zealand

        13.17.1. Pricing Analysis

        13.17.2. Market Share Analysis, 2022

            13.17.2.1. By Type

            13.17.2.2. By Application

    13.18. GCC Countries

        13.18.1. Pricing Analysis

        13.18.2. Market Share Analysis, 2022

            13.18.2.1. By Type

            13.18.2.2. By Application

    13.19. South Africa

        13.19.1. Pricing Analysis

        13.19.2. Market Share Analysis, 2022

            13.19.2.1. By Type

            13.19.2.2. By Application

    13.20. Israel

        13.20.1. Pricing Analysis

        13.20.2. Market Share Analysis, 2022

            13.20.2.1. By Type

            13.20.2.2. By Application

14. Market Structure Analysis

    14.1. Competition Dashboard

    14.2. Competition Benchmarking

    14.3. Market Share Analysis of Top Players

        14.3.1. By Regional

        14.3.2. By Type

        14.3.3. By Application

15. Competition Analysis

    15.1. Competition Deep Dive

        15.1.1. Zone3 Ltd.

            15.1.1.1. Overview

            15.1.1.2. Product Portfolio

            15.1.1.3. Profitability by Market Segments

            15.1.1.4. Sales Footprint

            15.1.1.5. Strategy Overview

                15.1.1.5.1. Marketing Strategy

                15.1.1.5.2. Product Strategy

                15.1.1.5.3. Channel Strategy

        15.1.2. Zoot Sports

            15.1.2.1. Overview

            15.1.2.2. Product Portfolio

            15.1.2.3. Profitability by Market Segments

            15.1.2.4. Sales Footprint

            15.1.2.5. Strategy Overview

                15.1.2.5.1. Marketing Strategy

                15.1.2.5.2. Product Strategy

                15.1.2.5.3. Channel Strategy

        15.1.3. De Soto Clothing Company, Inc.

            15.1.3.1. Overview

            15.1.3.2. Product Portfolio

            15.1.3.3. Profitability by Market Segments

            15.1.3.4. Sales Footprint

            15.1.3.5. Strategy Overview

                15.1.3.5.1. Marketing Strategy

                15.1.3.5.2. Product Strategy

                15.1.3.5.3. Channel Strategy

        15.1.4. Louis Garneau Sports

            15.1.4.1. Overview

            15.1.4.2. Product Portfolio

            15.1.4.3. Profitability by Market Segments

            15.1.4.4. Sales Footprint

            15.1.4.5. Strategy Overview

                15.1.4.5.1. Marketing Strategy

                15.1.4.5.2. Product Strategy

                15.1.4.5.3. Channel Strategy

        15.1.5. Fanatics Inc.

            15.1.5.1. Overview

            15.1.5.2. Product Portfolio

            15.1.5.3. Profitability by Market Segments

            15.1.5.4. Sales Footprint

            15.1.5.5. Strategy Overview

                15.1.5.5.1. Marketing Strategy

                15.1.5.5.2. Product Strategy

                15.1.5.5.3. Channel Strategy

        15.1.6. 2XU

            15.1.6.1. Overview

            15.1.6.2. Product Portfolio

            15.1.6.3. Profitability by Market Segments

            15.1.6.4. Sales Footprint

            15.1.6.5. Strategy Overview

                15.1.6.5.1. Marketing Strategy

                15.1.6.5.2. Product Strategy

                15.1.6.5.3. Channel Strategy

        15.1.7. Pearl Izumi

            15.1.7.1. Overview

            15.1.7.2. Product Portfolio

            15.1.7.3. Profitability by Market Segments

            15.1.7.4. Sales Footprint

            15.1.7.5. Strategy Overview

                15.1.7.5.1. Marketing Strategy

                15.1.7.5.2. Product Strategy

                15.1.7.5.3. Channel Strategy

        15.1.8. Orca

            15.1.8.1. Overview

            15.1.8.2. Product Portfolio

            15.1.8.3. Profitability by Market Segments

            15.1.8.4. Sales Footprint

            15.1.8.5. Strategy Overview

                15.1.8.5.1. Marketing Strategy

                15.1.8.5.2. Product Strategy

                15.1.8.5.3. Channel Strategy

        15.1.9. Kiwami Triathlon

            15.1.9.1. Overview

            15.1.9.2. Product Portfolio

            15.1.9.3. Profitability by Market Segments

            15.1.9.4. Sales Footprint

            15.1.9.5. Strategy Overview

                15.1.9.5.1. Marketing Strategy

                15.1.9.5.2. Product Strategy

                15.1.9.5.3. Channel Strategy

        15.1.10. TYR SPORT INC.

            15.1.10.1. Overview

            15.1.10.2. Product Portfolio

            15.1.10.3. Profitability by Market Segments

            15.1.10.4. Sales Footprint

            15.1.10.5. Strategy Overview

                15.1.10.5.1. Marketing Strategy

                15.1.10.5.2. Product Strategy

                15.1.10.5.3. Channel Strategy

16. Assumptions & Acronyms Used

17. Research Methodology

Explore Consumer Product Insights

View Reports
Future Market Insights

Triathlon Clothing Market

Schedule a Call