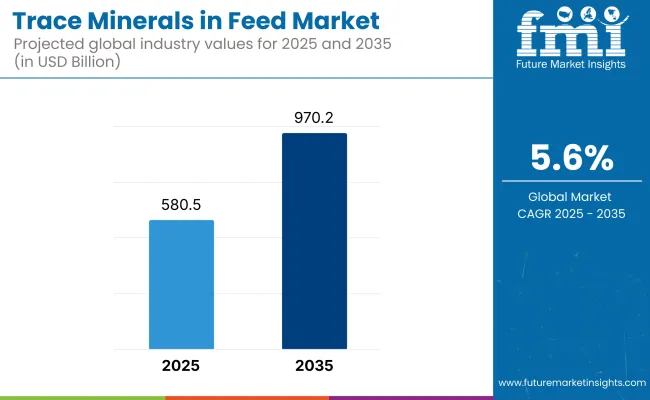
The trace minerals in feed market is estimated to be worth USD 580.5 billion in 2025 and is projected to reach a value of USD 970.2 billion by 2035, expanding at a CAGR of 5.6% over the assessment period of 2025 to 2035. There is a steady growth due to the rising importance given to animal nutrition and livestock productivity.
Trace minerals such as zinc, copper, manganese, iron, and selenium are the major growth factors for immune functions, reproduction, and overall animal health. The market is now expanding as the demand for high-quality animal protein is growing, and the need for quality feed is increasing.
The boom in the livestock and poultry sectors mainly powers the market rise. Farmers, alongside feed manufacturers, tend towards providing feed with a blend of important trace minerals in order to boost livestock performance and avoid nutrient deficiencies. The trend of precision nutrition and specialized feed options that are tailored to environmental and animal needs further drives the requirement for minerals in animal diets.
Additionally, the idea of being environmentally friendlier and the choice of going for organically grown animals without using chemical fertilizers is commendably changing the market trend. The move towards eating chelated trace minerals that are naturally sourced and are more bioavailable is a huge deal because they are better absorbed and have fewer negative effects on the environment. The use of antibiotic-free animal feed is another factor that has boosted trace minerals being used as products that will promote the health of animals and protect them from diseases.
R&D efforts in the areas of new feeding techniques and system transportation have sparked innovation within the industry. The use of fee additives that contain encapsulation techniques, nanotechnology-based mineral supplementation, and exposing microbes to certain nutrients and trace minerals are helping improve the environment in the livestock sector. The progress registered in these areas has been imperative in livestock production as the feed conversion ratio has increased, as well as meat and dairy yields.
On the other hand, the market is affected by fluctuating raw material prices and regulations on animal nutrition feed. Too much or too little mineral salt consumption can cause problems, which is the reason behind the strict rules on trace mineral inclusion levels in animal feed. Furthermore, the seeking of plant-based and alternative forms of protein may cause a decline in traditional livestock feed in the long term.
At the same time, the market poses enough opportunities that it seems like economic growth will never end. Newly established venture companies are expected to come with more applications of trace minerals in aquaculture feed and animal nutrition care. Moreover, funding in the areas of eco-friendly and organic trace mineral solutions will, as it seems, take care of the unmet demand, thereby leading to growth. The feed trace minerals market is bound to rise as animal feeding schemes continue to develop.
The market for feed trace minerals grew between 2020 to 2024, supported by rising awareness of animal nutrition and the need to sustain livestock health and productivity. Farmers and manufacturers directed efforts towards improving feed quality through the inclusion of critical trace minerals such as zinc, copper, manganese, and selenium to support immune systems, growth, and reproduction in livestock.
Research into chelated trace minerals improved bioavailability for greater uptake and less loss to the environment. Regulatory shifts, such as bans on the use of antibiotics in animal feed, also sped up trace mineral adoption as natural growth promoters. Nonetheless, raw material price volatility and supply chain interruptions tested market stability. Increased demand for animal products of superior quality, including meat and dairy, drove the demand for fortified feed solutions.
From 2025 to 2035, the market for feed trace minerals will be revolutionized by advancements in precision nutrition and biotechnology. Big data and AI will facilitate real-time monitoring of the welfare of animals such that trace mineral supplementation on an individual basis can be done according to the requirements of an individual animal.
Nano-encapsulation technology will stabilize trace minerals and make them extremely bioavailable for maximum use and waste reduction. Greener production technologies and green sourcing will be the norm with the industry attempting to reduce its carbon footprint.
Plant and non-meat protein sources will affect feed formulation, necessitating trace mineral solutions of a given animal by a given livestock. Regulatory systems will change to encourage the utilization of organic and naturally derived trace minerals based on environmental and food safety regulations. Traceability and blockchain traceability systems will enhance transparency in the feed supply chain.
A Comparative Market Shift Analysis 2020 to 2024 vs. 2025 to 2035
| 2020 to 2024 | 2025 to 2035 |
|---|---|
| Increased uses of chelated trace minerals for increased bioavailability. | Adoption of nano-encapsulation technology for better absorption and waste reduction. |
| Prioritization of strengthening livestock immunity and development using mineral-enriched feed. | Artificial intelligence-based precision nutrition for trace mineral supplementation specific to every animal. |
| Antibiotic usage regulatory limits extended the use of trace minerals. | Transition to naturally occurring and organic trace minerals to comply with regulation. |
| Breakdowns and volatility in supply chains disrupted market balance. | Blockchain-based tracking technologies to increase supply chain visibility and security. |
| High-value animal-derived materials generated demand for fortified feed products. | Green and sustainable sourcing to reduce environmental impact. |
The industry continues to grow steadily with a rising emphasis on sustainability, productivity, and livestock health. Trace minerals such as zinc, copper, iron, manganese, and selenium are essential for immune function, growth, and feed efficiency among different species of livestock
Cost and bioavailability are particularly important factors in poultry and swine nutrition, where food formulations need to optimize nutrient absorption against affordability considerations. Ruminants such as dairy cattle need highly tailored trace mineral mixes to maximize milk yield and overall health.
The animal food market is experiencing an increase in demand for organic and chelated trace minerals for improved digestibility and lower toxicity. Regulatory drivers and sustainability issues are also driving manufacturers towards organic and precision-formulated mineral supplements to reduce waste and environmental pressure.
Advances in nanotechnology and mineral encapsulation are anticipated to improve mineral absorption rates to optimize animal performance and health at a lower feed cost and environmental burden.
The global trace minerals in the feed market is largely driven by the ever-increasing requirement for animal nutrition and the subsequent benefits such as higher livestock productivity. Although the construction of such facilities takes considerable time, along with stringent regulatory frameworks with regard to permissible and excessive mineral concentrations, feed safety and environmental issues create compliance hurdles.
Along with other issues, supply chain problems such as the unavailability of raw materials, constant price changes, and trade restrictions that arise due to international conflicts are also factors that affect production stability. The reliance on minerals, such as zinc, copper, and manganese, is the main cause of the vulnerability.
Competition is increasing from other kinds of feed additives, such as probiotics and enzyme-based products, making the price and industry positions suffer. Companies need to put their emphasis on R&D and produce the most effective and species-specific trace mineral formulations that positively affect livestock health and performance.
There are several economic uncertainties and shifting livestock production patterns. The optimization of production efficiency, branching out into new industries, and teaming up with animal nutrition specialists and feed producers for the creation of new, economical trace mineral solutions are the must that businesses need to do to secure the long-term future.
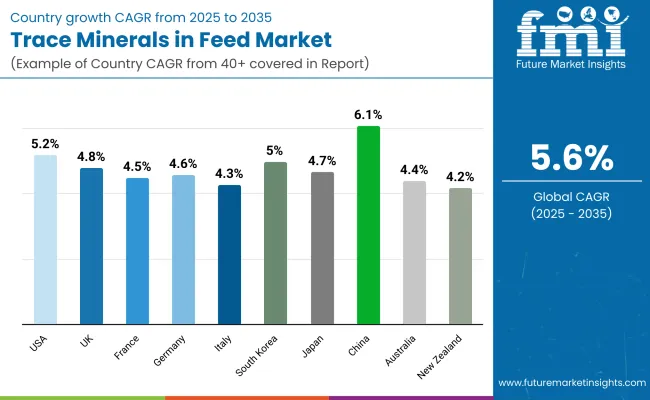
| Countries | CAGR (2025 to 2035) |
|---|---|
| USA | 5.2% |
| UK | 4.8% |
| France | 4.5% |
| Germany | 4.6% |
| Italy | 4.3% |
| South Korea | 5.0% |
| Japan | 4.7% |
| China | 6.1% |
| Australia | 4.4% |
| New Zealand | 4.2% |
The USA is anticipated to grow at a CAGR of 5.2% from 2025 to 2035. Increased demand for high-quality meat and dairy products has driven the adoption of mineral-enriched animal feed. The robust presence of players such as Cargill and Archer Daniels Midland (ADM) guarantees a strong supply chain driving growth. Government initiatives to encourage the production of minerals such as zinc, manganese, and selenium, which are required in animal nutrition, stimulate expansion.
The USA market is also experiencing expansion in precision nutrition agriculture, where the farmer customizes the formulation of feeds to improve the health and performance of animals. Greater uses of organic and non-GMO trace minerals as feed ingredients differentiate the country. Better technological innovation in the formulations of feed additives by companies such as Zinpro Corporation also enhances bioavailability, hence making trace minerals more bioactive in animal diets.
The UK boasts an estimated 4.8% CAGR from 2025 through 2035. The country is blessed to have stringent controls in place to address animal feed quality and sustainability. Innovation companies such as Alltech and AB Agri offer poultry-, swine-, and cattle-formulated trace mineral solutions. The demand for organic and chelated minerals was prompted by the country's trend toward sustainable farming.
The increasing tendency for antibiotic-free animal feed has further stimulated the growth, with farmers on the lookout for alternative methods for strengthening livestock immunity. The drift in animal husbandry for environmental reduction by the government of the UK has made the use of highly bioavailable trace minerals inevitable, lowering excretion and soil contamination. The increased use of aquaculture feed solutions further enhances sales expansion.
France is anticipated to grow at a rate of 4.5% CAGR from 2025 to 2035. France has well-established dairy and livestock sectors in areas such as Brittany and Normandy, which ensures a constant demand for such enriched feed products. Neovia and Olmix are two of the leading players among providers of next-generation trace minerals in the nation.
France's shift towards organic agriculture and low levels of antibiotic use in animal farming has boosted the demand for trace mineral-enriched feed blends. Government-sponsored initiatives for organic agriculture, combined with better feed conversion ratios, have also increased the utilization of high-quality trace minerals. Increased reliance on local raw material supplies for manufacturing feed also contributes to sales expansion.
It is increasing at 4.6% CAGR in the period 2025 to 2035. This is due to the fact that Germany's animal nutrition industry is very advanced and has a research-based solution orientation. Leading German players such as BASF and Evonik are significant drivers for the development of next-generation feed additives with enhanced mineral absorption efficiency.
Germany's regulation of feed under strict controls ensures trace minerals utilized in animal feed meet high standards of safety and sustainability. The demand for organic livestock commodities has heightened farmers' interest in investing in good-quality feed additives such as chelated minerals. A further increase in growth has resulted from the advancement in microencapsulation technology, which enhanced the stability and bioavailability of trace minerals.
Italy will grow at a 4.3% CAGR from 2025 to 2035 due to the premium focus on Italian meat and dairy. Italian organizations such as Vetagro and Adisseo have introduced new trace minerals for traditional as well as organic livestock rearing.
Increasing demand for quality animal protein in Italy has led to investment in mineral-fortified feed solutions. Italy's long history of dairy farming, particularly in Lombardy and Emilia-Romagna, is the foundation of demand for higher-quality nutrition solutions. Italy's stringent animal welfare laws have also encouraged feed producers to use highly digestible mineral additives.
South Korea is expected to post a 5.0% CAGR during 2025 to 2035 on the back of the country's well-developed livestock-rearing industry. Key leaders such as CJ CheilJedang lead by developing era-specific feeds with trace minerals that are designed to enhance growth performance in animals.
Increasing demand for antibiotic-free and functional animal feed has encouraged farmers to invest in superior mineral supplements. Increased pork and poultry consumption in South Korea also drives growth, with product makers seeking to enhance the quality of meat through the best mineral formulation. Government support for sustainable livestock production programs also offers greater potential.
Japan will grow at a CAGR of 4.7% from 2025 to 2035. Japan's industrially developed animal nutrition sector, led by the likes of Ajinomoto and Kemin, has a guaranteed supply of superior-quality feed additives.
Japan's emphasis on safe food and better meat production has pioneered the adoption of cutting-edge trace mineral solutions. Aquaculture, too, is in its rightful place as a significant industry, with aqua-feed nutrition specific to seawater fish aquaculture. Furthermore, Japan's animal agriculture is also supplemented by the adoption of precision feeding technologies that have boosted demand for highly bioavailable trace minerals.
China is also likely to expand at a CAGR of 6.1% from 2025 to 2035 and is one of the fastest-growing industries. China's huge poultry and livestock industry, along with its high speed of urbanization, makes the industry for mineral-fortified feed products colossal. New Hope Group and Wellhope Agritech are a few prominent Chinese players dominating the industry.
The Chinese government has put strict conditions on feed quality and safety, which promote the use of trace minerals as the driving force of enhanced animal productivity. Additionally, a shift to commercial large-scale agriculture and increased consumer demand for high-protein foods propel growth. The utilization of digital technologies in feed formulation also fuels growth.
Australia is expected to grow at a CAGR of 4.4% during 2025 to 2035. The strong beef and dairy industries in the country drive the demand for high-quality trace minerals in feed. Ridley Corporation and others are key players in delivering mineral-enhanced feed solutions to local farmers.
Australia's focus on sustainable animal production has witnessed very high rates of usage of organic and chelated trace minerals. Australia's stringent biosecurity regulations ensure feed additives are very safe. Additionally, the demand for premium meat and dairy products for export encourages farmers to utilize high-quality feed formulations.
New Zealand will grow at a 4.2% CAGR between 2025 and 2035. The globally recognized dairy industry of the country, in which Fonterra is the largest player, continues to be a primary driver of acceptance of mineral-additive feed.
Growing demand for green agriculture and animal welfare has driven demand for good-quality trace minerals used in animal feed. New Zealand's emphasis on grass-based beef and dairy farming has been a major driver of mineral supplementation technology development to enhance nutrition. Growing export demand for high-grade animal products is also the driving force behind industry growth.
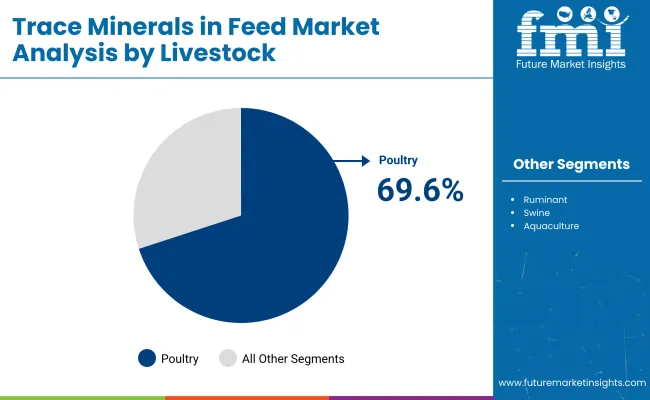
Optimized Chelated Minerals Enhancing Poultry Growth, Immunity, and Egg Production
| Segment | Poultry (Livestock) |
|---|---|
| Value Share (2025) | 69.6% |
The poultry segment leads the market and holds a 69.6% share in 2025. The strong demand for poultry feed supplements is influenced by the growing global consumption of chicken meat and eggs, especially in the Asia-Pacific, North America, and European regions. Key trace minerals such as zinc, copper, manganese, and selenium are important in immune function, bone growth, and egg production efficiency in poultry production.
Major players such as Cargill, Alltech, and DSM are developing innovative chelated mineral formulations for enhanced bioavailability, gut health, and poultry performance. As intensive farming operations and mineral deficiency concerns are on the rise, fortified poultry feed is becoming an industry norm to maximize growth rates and feed conversion efficiency.
The ruminant segment accounts for 9.0%, which is dominated by cattle and dairy farming. In fact, cobalt, copper, selenium, and other trace minerals are vital for ruminants' metabolism, reproductive activity, and milk production. And that more bioavailable organic trace minerals are alleviating environmental discomforts and challenging regulators' use of inorganic minerals.
There is more focus on animal nutrition in consideration of disease resistance and sustainable livestock production, and this will grow the demand for trace minerals in the feed.
Increasing Use of Amino Acid-Trace Mineral Blends for Poultry Growth
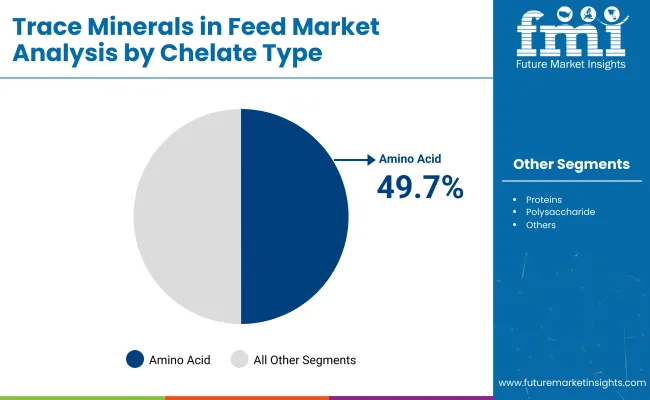
| Segment | Amino acids ( Chelate Type ) |
|---|---|
| Value Share (2025) | 49.7% |
In 2025, the Amino Acids segment leads the Trace Minerals in the Feed Market with a share of 49.7%. A higher bioavailability and absorption efficiency of chelated trace minerals such as zinc methionine, copper lysine, and manganese glycinate, as compared to inorganic minerals.
For other livestock classes, e.g., poultry, swine, etc., animal growth performance (e.g., growth performance and feed efficiency) has been enhanced using veterinary chelates, as have immune status and reproductive performance. The literature highlights many performance-enhancing feed ingredients focusing on gut health and precision nutrition, among which chelated minerals are leading the way in optimizing feed with decreased mineral excretion.
Major multinational companies like Balchem, Novus International, and Zinpro Corporation are broadening the offering of amino acid-chelated trace minerals to fulfill the increasing demand for sustainable and performance-enhancing feed additives.
The Proteinates segment accounts for the largest share, owing to its high stability and bioavailability. It is projected to witness a 6.7% CAGR during the forecast period and is estimated to hold an 18.0% share. Proteinates (small peptides or hydrolyzed proteins bound to trace minerals) have been commonly used in aquaculture and ruminant feed to enhance mineral retention and milk production and improve resistance to stress. The organic composition of proteinates supports clean-label and antibiotic-free feed trends and, hence, is the choice in high-end and specialty livestock nutrition.
With growing regulatory limitations on inorganic trace minerals and a move toward sustainable animal nutrition, the demand for chelated trace minerals, especially amino acid-based and proteinate products, is likely to experience consistent growth in the years to come.
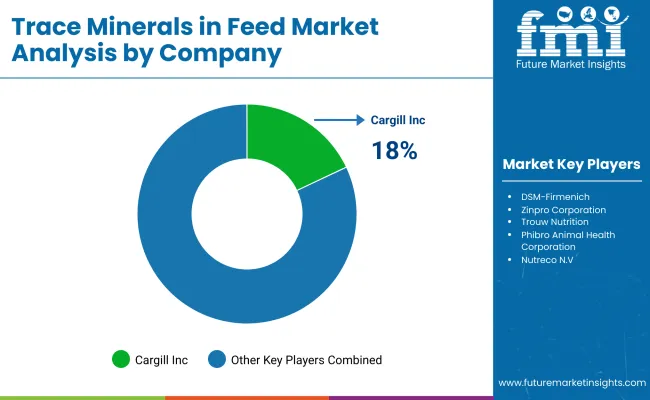
The demand for trace minerals in feed is growing with the increasing requirement for optimized animal nutrition, enhanced productivity in livestock, and improved disease resistance. Major factors driving demand include an increase in meat consumption, industrial livestock farming, and stringent regulations concerning feed quality.
Leading players in the industry, namely Cargill Inc., Archer Daniels Midland (ADM), DSM-Firmenich, and Zinpro Corporation, dominate the industry and provide bulk mineral premixes, trace minerals to organic standards, and feed supplements that comply with bioavailability. On the other hand, specialized firms in animal nutrition are innovating chelated minerals, sustainable sourcing, and precision feeding to adapt to the changing demands of the current industrial scenario.
The industry is evolving toward organic and hydroxy trace minerals that have superior absorbability, environmentally conscious design, and improved animal performance. Companies invest in biotechnology-based formulations and in strategic alliances with feed manufacturers to strengthen their position.
A few key strategic considerations are the alignment of supply chains, regional advancement, compliance with regulations, and sustainability matters in the current global environment. Hence, the industry would prefer conscientious manufacturing processes and traceable sourcing to swim with the livestock industry tide globally.
Market Share Analysis by Company
| Company Name | Estimated Market Share (%) |
|---|---|
| Cargill Inc. | 18-22% |
| Archer Daniels Midland (ADM) | 15-19% |
| DSM-Firmenich | 12-16% |
| Zinpro Corporation | 10-14% |
| Trouw Nutrition | 8-12% |
| Other Companies (Combined) | 30-40% |
| Company Name | Key Offerings/Activities |
|---|---|
| Cargill Inc. | Provides organic and hydroxy trace minerals for enhanced livestock health and nutrient absorption. Focuses on sustainability and precise nutrition. |
| ADM | Develops chelated trace minerals, supporting improved bioavailability and reduced environmental impact in animal nutrition. |
| DSM-Firmenich | Specializes in essential feed micronutrients, offering innovative formulations with high absorption rates. |
| Zinpro Corporation | Pioneers perform trace minerals using advanced chelation technology to maximize livestock productivity. |
| Trouw Nutrition | Offers customized trace mineral premixes with a focus on improving feed conversion efficiency and immune response. |
Key Company Insights
Cargill Inc. (18-22%)
Cargill leads through an aggressive portfolio of feed trace minerals that support nutrient uptake and digestive health. The company's BIOPLEX organic minerals are formulated for superior bioavailability, minimizing mineral losses and environmental concerns.
Archer Daniels Midland (ADM) (15-19%)
The company will be focusing on chelated and hydroxy trace minerals in its feed range as a measure of feed efficiency while also aligning with sustainability trends. The company's expansion within the global animal nutrition sector was a result of the acquisition of Neovia.
DSM-Firmenich (12-16%)
Among leading brands dealing with essential feed micronutrients, DSM has a high R&D effort towards increasing bioavailability. Such a vitamin would include Hy-D, a vitamin D metabolite from DSM that promotes mineral absorption in poultry and swine feed.
Zinpro Corporation (10-14%)
Zinpro expects to increase the productivity of livestock through the use of amino acid-chelated performance trace minerals. Visibly, it specializes in the product lines of 4-Plex and Availa.
Trouw Nutrition (8-12%)
Trouw Nutrition offers precision nutrition solutions such as Selko IntelliBond trace minerals that enhance feed conversion efficiency and immune health among livestock.
Other Key Players (30-40% Combined)
This segment is further categorized into Zinc, Copper, Cobalt, Manganese, Iron, Chromium, and Others (Iodine and Selenium).
This segment is further categorized into poultry, ruminant, swine, aquaculture, and other categories (e.g., equine and pet).
This segment is further categorized into amino acids, proteins, polysaccharides, and other substances (propionates and peptides).
This segment is further categorized into Dry, Liquid.
Industry analysis has been carried out in key countries such as North America, Latin America, Eastern Europe, Western Europe, East Asia, South Asia & Pacific, Central Asia, Balkan and Baltic Countries, Russia & Belarus, and the Middle East & Africa.
The global Trace Minerals in Feed industry is estimated to be valued at USD 580.5 billion in 2025.
Sales of Trace Minerals in Feed increased at a CAGR of 5.6% between 2020 and 2024.
According to forecasts, the market is expected to be worth USD 970.2 billion by 2035, growing at an estimated CAGR of 5.6% during the forecast period (2025 to 2035).
Some of the leading players in this industry include DSM-Firmenich, Cargill Animal Nutrition, Alltech Inc., Nutreco (Trouw Nutrition), Zinpro Corporation, Kemin Industries, Phibro Animal Health Corporation, Novus International, Tecton Bio, and Vitam International.
The Asia-Pacific region is projected to hold a revenue share of 38% over the forecast period.
North America holds a 32% share of the global demand space for Trace Minerals in Feed.


Our Research Products

The "Full Research Suite" delivers actionable market intel, deep dives on markets or technologies, so clients act faster, cut risk, and unlock growth.

The Leaderboard benchmarks and ranks top vendors, classifying them as Established Leaders, Leading Challengers, or Disruptors & Challengers.

Locates where complements amplify value and substitutes erode it, forecasting net impact by horizon

We deliver granular, decision-grade intel: market sizing, 5-year forecasts, pricing, adoption, usage, revenue, and operational KPIs—plus competitor tracking, regulation, and value chains—across 60 countries broadly.

Spot the shifts before they hit your P&L. We track inflection points, adoption curves, pricing moves, and ecosystem plays to show where demand is heading, why it is changing, and what to do next across high-growth markets and disruptive tech

Real-time reads of user behavior. We track shifting priorities, perceptions of today’s and next-gen services, and provider experience, then pace how fast tech moves from trial to adoption, blending buyer, consumer, and channel inputs with social signals (#WhySwitch, #UX).

Partner with our analyst team to build a custom report designed around your business priorities. From analysing market trends to assessing competitors or crafting bespoke datasets, we tailor insights to your needs.
Supplier Intelligence
Discovery & Profiling
Capacity & Footprint
Performance & Risk
Compliance & Governance
Commercial Readiness
Who Supplies Whom
Scorecards & Shortlists
Playbooks & Docs
Category Intelligence
Definition & Scope
Demand & Use Cases
Cost Drivers
Market Structure
Supply Chain Map
Trade & Policy
Operating Norms
Deliverables
Buyer Intelligence
Account Basics
Spend & Scope
Procurement Model
Vendor Requirements
Terms & Policies
Entry Strategy
Pain Points & Triggers
Outputs
Pricing Analysis
Benchmarks
Trends
Should-Cost
Indexation
Landed Cost
Commercial Terms
Deliverables
Brand Analysis
Positioning & Value Prop
Share & Presence
Customer Evidence
Go-to-Market
Digital & Reputation
Compliance & Trust
KPIs & Gaps
Outputs
Full Research Suite comprises of:
Market outlook & trends analysis
Interviews & case studies
Strategic recommendations
Vendor profiles & capabilities analysis
5-year forecasts
8 regions and 60+ country-level data splits
Market segment data splits
12 months of continuous data updates
DELIVERED AS:
PDF EXCEL ONLINE
Animal Feed Organic Trace Minerals Market Size and Share Forecast Outlook 2025 to 2035
Trace Oxygen Analyzer Market Analysis - Size, Share & Forecast 2025-2035
Trace Chemical Detector Market Growth – Trends & Forecast 2019-2027
Ultracentrifugation Tubes Market Size and Share Forecast Outlook 2025 to 2035
Nutraceutical CDMO Market Size and Share Forecast Outlook 2025 to 2035
Nutraceutical Excipients Market Analysis - Size, Share, and Forecast Outlook 2025 to 2035
Nutraceutical Gummies Market Analysis - Size, Share, and Forecast 2025 to 2035
Nutraceutical Actives Market Analysis - Size, Share, and Forecast Outlook 2025 to 2035
Nutraceuticals Market Size, Growth, and Forecast for 2025 to 2035
Nutraceutical Ingredients Market Analysis by Product, Form, Application and Region through 2035
Nutraceutical Packaging Market Size and Share Forecast Outlook 2025 to 2035
Key Companies & Market Share in Nutraceutical Packaging Sector
Nutraceutical Rigid Packaging Market Analysis - Size, Share, and Forecast Outlook 2025 to 2035
Extracellular Matrix Proteins Market
Nutraceutical Flexible Packaging Market
Nutraceutical Contract Manufacturing Services Market Size and Share Forecast Outlook 2025 to 2035
Contraceptives Market Analysis – Growth & Forecast 2024-2034
Food Traceability Market Size and Share Forecast Outlook 2025 to 2035
Wire Tracer Market
Curve Tracer Market

Thank you!
You will receive an email from our Business Development Manager. Please be sure to check your SPAM/JUNK folder too.
Chat With
MaRIA