Tortilla Machine Market Outlook (2023 to 2033)

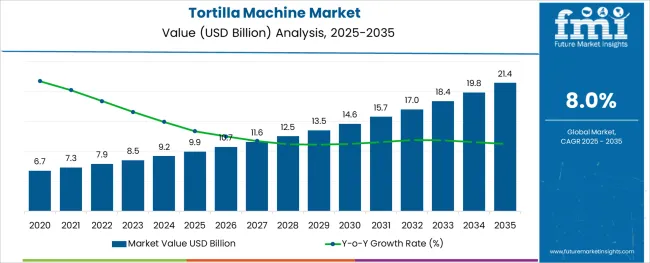
The global tortilla machine market size is expected to grow from US$ 8,500.0 Million in 2023 to US$ 19,756.4 Million by 2033, with overall sales accelerating at 8.8% CAGR throughout the forecast period (2023 to 2033). Rising adoption across food processing industries, restaurants, and households is a key factor boosting sales of tortilla machines in the market.

Tortillas are unleavened flatbreads that are commonly used in Mexican food to make burritos, tacos, enchiladas, and other dishes. They are made with either corn or wheat flour and are soft and savory like chapati. These flatbreads are rich in nutrients like proteins, vitamins, and minerals, and have become a staple diet for the Hispanic community.

High nutritional benefits and growing health awareness among consumers across the globe are generating enormous demand for tortillas. This in turn will continue to boost the tortilla machine market during the forecast period.

Tortilla machines are equipment designed for manufacturing tortillas on large scales. These machines include tortilla baking ovens, cooling machines, and grouping machines that perform specific functions during tortilla manufacturing.

Similarly, the growing adoption of tortillas as a healthier alternative to sandwich bread across many regions is expected to positively influence the sales of tortilla machines during the next ten years.

In addition to this, growing demand for processed food products due to changing lifestyles and the rising need for improving productivity across food manufacturing industries are likely to generate growth prospects within the global tortilla machine market.

Leading manufacturers are continuously innovating to develop advanced tortilla machines with higher efficiency and lower power consumption. This will help them to increase their customer base

Attribute Key Insights
Tortilla Machine Market Estimated Value (2023) US$ 8,500.0 Million
Projected Market Value (2032) US$ 19,756.4 Million
Value-based CAGR (2023 to 2033) 8.8%
North America Market Value in 2023 US$ 2,196.4 Million

Don't pay for what you don't need

Customize your report by selecting specific countries or regions and save 30%!

2017 to 2022 Tortilla Machine Market Outlook Compared to 2023 to 2033 Forecast

The global demand for tortilla machines is projected to grow at 8.8% CAGR between 2023 and 2033 in comparison to the 10.4% CAGR registered during the historical period of 2017 to 2022.

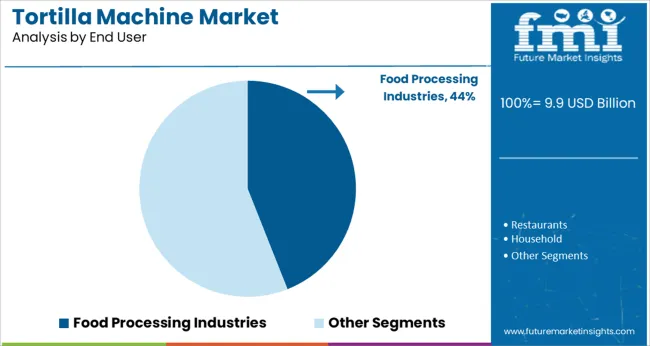
Rising consumption of tortillas and growing adoption of tortilla machines across food processing industries, households, restaurants, catering companies, and several other end-use sectors are key factors driving growth in the global tortilla machine market.

Similarly, increasing usage of tortillas for making a wide range of dishes due to their numerous health benefits is projected to push the demand for tortilla machines during the forecast period.

In addition to this, technological advancements in tortilla-making machines along with the growing popularity of fully-automatic machinery will generate growth prospects within the global market over the next ten years.

Overview of Key Trends Shaping the Market 

Growing Awareness About Health Benefits of Tortillas to Boost Market Over the Projected Period

In recent years, increasing consumer awareness about the health benefits of tortillas has generated high demand for this product, and the trend is likely to continue during the forecast period.

Tortillas are generally made from corn or wheat and are thus rich in proteins, vitamins, minerals, and other essential nutrients. Further, they contain low-fat content which makes them an ideal alternative to bread made from refined flour.

Growing demand for gluten-free products, the high nutritional benefits of tortillas, and rising health consciousness among consumers are expected to propel the tortilla machine market forward during the next ten years.
Nandini Roy Choudhury

Principal Consultant

Talk to Analyst

Find your sweet spots for generating winning opportunities in this market.

Country-wise Insights

Why is the USA Considered a Prominent Tortilla Machine Market?

Increasing Production and Consumption of Tortilla Pushing Demand in the USA
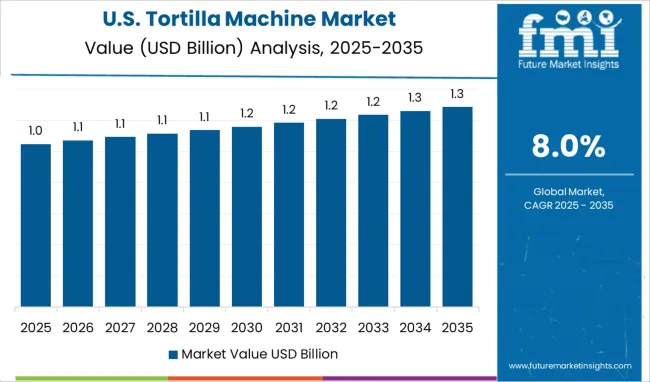
As per FMI, the USA will continue to dominate the global tortilla machine market during the forecast period owing to the rising consumption of tortillas and the rapid growth of the food processing industry.

Similarly, the presence of leading tortilla machine manufacturers along with continuous new product launches is expected to boost the market during the next ten years.

One of the fastest-expanding baked manufacturing industries in the USA is tortilla production. This is due to the growing Hispanic population, which has increased demand for the product over the last five years.

Many tortilla manufacturers have added nutrients to their goods, such as flax and fiber, and improved their tortilla equipment to appeal to a wider range of customers. These enhancements have piqued the interest of health-conscious customers who see tortillas as a better alternative to bread. As a result of the increased demand for tortillas, sales of tortilla machines are expected to grow at a robust pace across the USA during the projected period.

How is the Tortilla Machine Market Shaping in India?

Rising Popularity of Tortilla Boosting Market in India

The tortilla market in India is predicted to grow at a healthy CAGR during the forecast period owing to the rapidly growing population, increasing adoption of tortilla machines across households, and increasing popularity of automatic machines.

With increasing urbanization, the country's youth live a busy and chaotic lifestyle, necessitating the constant demand for quick food items. Tortillas serve this role as well as provide an unusual snack alternative. The Indian snack industry is seeing a rise in cross-cultural cuisine consumption.

Tortillas are a well-known Mexican cuisine that has piqued the interest of Indian foodies. Thus, the growing popularity of tortillas across the country will continue to propel sales of tortilla machines during the forecast period.

Similarly, increasing the adoption of semi-automatic and fully-automatic tortilla machines to reduce costs and improve productivity is expected to propel growth in the Indian tortilla machine market.

Why is Mexico Emerging as a Lucrative Tortilla Machine Market?

Increasing Consumption of Tortilla-based Dishes Generating Demand in Mexico

According to Future Market Insights, the Mexican tortilla machine market is likely to expand at a robust pace during the next ten years, owing to the growing usage of tortillas for various cuisines, the increasing adoption of fully automatic machines, and booming food tourism.

Corn tortillas, whole wheat tortillas, and tortilla chips are all sweeping the food sector across Mexica. The popularity of Mexican food is growing, and tortillas are becoming more and more well-liked among younger people due to their better nutritional profile.

Tortillas, tacos, and enchiladas are all made with tortillas, a thin flatbread that is high in protein, vitamins, and minerals. They are an essential component of Mexican cuisine and a common staple in the Hispanic population. Because of this progressive increase in demand for tortillas in Mexico, it is anticipated that the demand for tortilla machines will increase in the future.

Category-wise Insights

Which is the Top Selling Equipment in the Tortilla Machine Market?

Demand Likely to Remain High for Tortilla Baking Oven

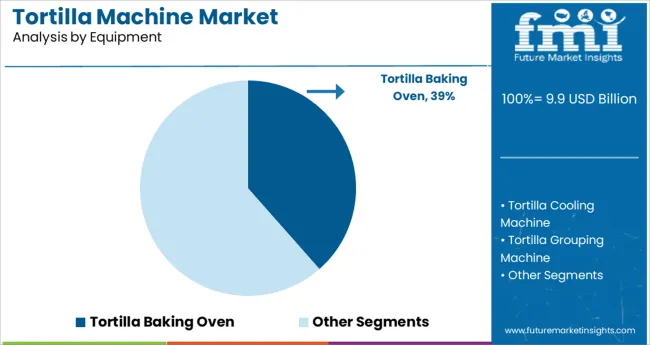
Based on equipment, the tortilla machine market is segmented into tortilla baking ovens, tortilla cooling machines, and tortilla grouping machines.

Among these, the tortilla baking oven segment is likely to lead the global tortilla machine market during the forecast period. This can be attributed to the rising adoption of tortilla baking ovens across various food processing industries, restaurants, and households.

Tortilla baking ovens are machines designed for baking flat bread (tortilla, pitta, chapatti, lavash, etc.). As a result, they are being increasingly used by various end users.

Why is Demand for Fully Automatic Tortilla Machines Rising?

Need for Reducing Human Intervention Fuelling Adoption of Automatic Tortilla Machines

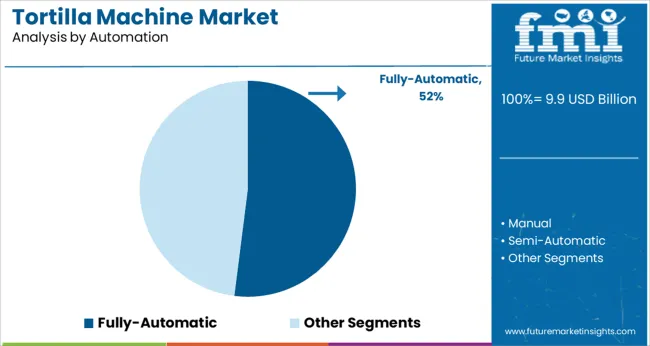
Based on automation, the fully automatic segment is expected to grow at a higher pace during the forecast period. This can be attributed to the rising end-user preference for automatic machines to reduce human intervention, improve overall productivity, and reduce labor costs.

Besides this, the growing need for improving product quality and safety is expected to encourage the adoption of fully automatic tortilla machines during the forecast period.
Get the data you need at a Fraction of the cost

Personalize your report by choosing insights you need
and save 40%!

Competitive Landscape

The quickly changing technical environment is compelling tortilla machine manufacturers to refresh their product portfolio regularly. Hence, they are investing in research and development activities to develop advanced tortilla machines with user-friendly features. Besides this, they are adopting strategies such as partnerships, mergers, acquisitions, and collaborations to expand their global footprint. For instance,

  • In 2021, Dowson launched a new tortilla line designed to be reliable, low maintenance, and deliver a high product throughput.
  • HIV Corp. recently launched Heat Transfer Devices in the NEW EVO Series. The Latest HIX EVO pro-s-650 clamshell heat press is made to be tough, resilient, and to function exactly as it has for more than 40 years. It includes a lower platen that floats, an easy-to-use auto-open function, and spring assistance that exerts 20% more pressure than straight-handle designs. It now comes with an updated FULL-COLOR LCD touchscreen controller, a full metal enclosure, and an enhanced molded lower platen pad for better performance across a range of applications.

Key Tortilla Machine Makers Saving the Budget and Making the Dishes Delicious - UTF Group, BE&SCO Manufacturing, and Heisler Industries, Inc.

Leading tortilla machine manufacturers are supplying their products to improve end users’ food production process and for quality control purposes. The quality control department inspects each batch of tortillas that comes out of the machine, ensuring it’s up to code. And finally, some use these machines as a way to minimize costs. As large batches of tortillas can be produced all at once which eliminates the need for other types of machinery and equipment like flattening presses or hand-rolling stands which also saves space within their facility as well.

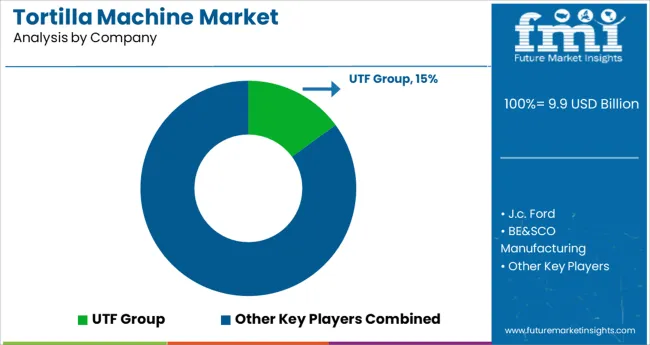
UTF-GROUP is one of the largest firms in Eastern Europe that manufactures industrial food processing equipment. The firm has been designing and producing high-quality machinery and production lines for various bread, wheat snacks, pasta, and confectionary items for over 25 years.

In recent years, UTF has been working to innovate its product offerings, introduce new technology, and change how tortillas are made worldwide. In 2019, UTF introduced its newest innovation - a new machine called Pro-Tekt 4000. This machine offers three advantages over traditional machines: it requires less floor space, can produce more tortillas per hour than a standard machine, and is easier to maintain. UTF group believes these innovations will help them keep up with demand for the company's products, which have increased significantly as Latin American cuisine becomes increasingly popular across North America.

Another key player, BE&SCO, is a manufacturer of tortilla machines, tamale machines, pizza machines, flatbread machines, tortilla presses, tortilla grills, tortilla ovens, electric tamale machines, electric tortilla machines, automatic tortilla presses, pizza presses, commercial tamale machines, bakery equipment, high-production machines, high-volume machines, mixers, dough dividers, rotating grills, comals, and tortilla systems.

In 2019, BE&SCO Manufacturing debuted at IFT Food Expo to showcase their recent developments after being acquired by Unitex. With a focus on innovation, they are proud to introduce four new product offerings for food manufacturing professionals. They offer machines for pre-sliced frozen dough products like bread and buns and ovens that can bake in three different flavors. There is also a machine that dispenses taco shells and tortillas, which has been popular among food service providers. A machine that rotates around products to create panini or grilled sandwiches is also available through BE&SCO Manufacturing.

Additionally, Heisler designs and produces automatic packaging and handling systems for plastic and metal containers ranging in size from pints to 55-gallon drums. The firm works with pails, jugs, cases, and trays in round, square, and F-style containers.

Heisler has been a pioneering company in food service equipment for over 50 years. One of their most recent developments is an organic line that meets USDA standards. With this new development, they're now able to offer not only gluten-free options but also more traditional products as well. For example, all ingredients are sourced locally in California and Mexico, offering the best prices and quality.

A key component of Heisler's success is innovation. Their primary focus is to design user-friendly and efficient machines with easy installation. They're constantly finding ways to improve production speed while maintaining quality. They currently have six lines of tortilla machines with eight models in each category. Every model offers different features, so it can be hard to decide which machine suits your needs best. Luckily, Heisler has developed a way for customers to see the differences between models before making a purchase decision.

Tortilla Machine Market Report Scope

Attribute Details
Estimated Market Size (2023) US$ 8,500.0 Million
Projected Market Size (2033) US$ 19,756.4 Million
Anticipated Growth Rate (2023 to 2033) 8.8%
Forecast Period 2023 to 2033
Historical Data Available for 2017 to 2022
Key Regions Covered North America; Europe; Asia Pacific; South America; Middle East and Africa (MEA)
Key Countries Covered USA, Mexico, UK, France, Italy, Russia, Turkey, Spain, China, Japan, Korea, India, Indonesia, Thailand, Philippines, Malaysia, Vietnam, South Korea, Australia, Brazil
Key Segments Covered Equipment, End User, Automation, Region
Key Companies Profiled Mexican Tortilla Machine; UTF Group; BE&SCO Manufacturing; Coperion & Coperion K-Tron; Heisler Industries, Inc.; Culinary Depot Inc.; HIX Corp.; Special Projects International, Inc; Empire Bakery Equipment; The Lanly Co.; Heat and Control, Inc.; AM Manufacturing Company; Superior Food Machinery, Inc; Lawrence Equipment, Inc; Frain Industries; Dutchess Bakers' Machinery Co., Inc.; Rotolok Ltd; J.c. Ford; Casa Herrera, Inc.; Bail-O-Matic
Report Coverage Market Forecast, Company Share Analysis, Competitive Landscape, Drivers, Restraints, Opportunities and Threats Analysis, Market Dynamics and Challenges, and Strategic Growth Initiatives

Tortilla Machine Market by Category

By Equipment:

  • Tortilla Baking Oven
  • Tortilla Cooling Machine
  • Tortilla Grouping Machine

By Automation:

  • Manual
  • Semi-Automatic
  • Fully-Automatic

By End User:

  • Food processing Industries
  • Restaurants
  • Household
  • Caterers

By Region:

  • North America
  • Latin America
  • Europe
  • Asia Pacific
  • Middle East and Africa (MEA)

Frequently Asked Questions

How big is the tortilla machine market?

The global tortilla machine market is expected to reach US$ 8500.0 Million in 2023.

At what rate is tortilla machine market expected to rise?

The tortilla machine market is expected to rise at a CAGR of 8.8% during the assessment period (2023 to 2033).

What is the projected valuation for tortilla machine market in 2033?

As per FMI, the global tortilla machines market is forecast to surpass a valuation of US$ 19756.4 Million by the end of 2033.

What is the North America tortilla machine market share?

North America currently holds around 38% share of the global tortilla machine market.

Which are the major countries driving demand for tortilla machines?

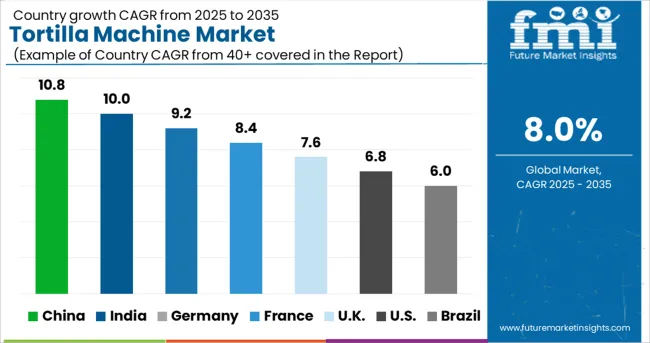
The USA, China, India, Mexico, and Germany are the major countries driving demand for tortilla machines.

At what rate will the demand for tortilla machines grow in Europe?

Demand for tortilla machines in Europe is expected to grow at 6.5% CAGR between 2023 and 2033.

Who are the top 5 players operating in the tortilla machine market?

Mexican Tortilla Machine, UTF Group, BE&SCO Manufacturing, Coperion & Coperion K-Tron, and Heisler Industries, Inc. are some of the top players operating in the tortilla machine market.

Table of Content

1. Executive Summary | Tortilla Machine Market

    1.1. Global Market Outlook

    1.2. Demand-side Trends

    1.3. Supply-side Trends

    1.4. Technology Roadmap Analysis

    1.5. Analysis and Recommendations

2. Market Overview

    2.1. Market Coverage / Taxonomy

    2.2. Market Definition / Scope / Limitations

3. Market Background

    3.1. Market Dynamics

        3.1.1. Drivers

        3.1.2. Restraints

        3.1.3. Opportunity

        3.1.4. Trends

    3.2. Scenario Forecast

        3.2.1. Demand in Optimistic Scenario

        3.2.2. Demand in Likely Scenario

        3.2.3. Demand in Conservative Scenario

    3.3. Product launches & Recent Developments

    3.4. Product Life Cycle Analysis

    3.5. Value Chain Analysis

        3.5.1. Supply Side Participants and their Roles

            3.5.1.1. Producers

            3.5.1.2. Mid-Level Participants (Traders/ Agents/ Brokers)

            3.5.1.3. Wholesalers and Distributors

        3.5.2. % of Operating Margin Analysis

        3.5.3. List of Raw Material Suppliers

        3.5.4. List of Existing and Potential Buyers

    3.6. Market - Pricing Analysis

        3.6.1. Price Point Assessment by Region

        3.6.2. Price Point Assessment by Product Type

        3.6.3. Price Forecast till 2033

        3.6.4. Factors affecting Pricing

    3.7. Forecast Factors - Relevance & Impact

    3.8. Regulatory Landscape

        3.8.1. Packaging & Labelling Regulations

        3.8.2. Certifications and Certifying Agency Overview

        3.8.3. Import/Export Policies

    3.9. Regional Parent Market Outlook

    3.10. Consumers Survey Analysis

    3.11. Macro-Economic Factors

    3.12. Product Claims & Nutritional Information scanned by Buyers

4. Global Market Analysis 2017 to 2022 and Forecast, 2023 to 2033

    4.1. Historical Market Size Value (US$ Million) & Volume (MT) Analysis, 2017 to 2022

    4.2. Current and Future Market Size Value (US$ Million) & Volume (MT) Projections, 2023 to 2033

        4.2.1. Y-o-Y Growth Trend Analysis

        4.2.2. Absolute $ Opportunity Analysis

5. Global Market Analysis 2017 to 2022 and Forecast 2023 to 2033, By Equipment

    5.1. Introduction / Key Findings

    5.2. Historical Market Size Value (US$ Million) & Volume (MT) Analysis By Equipment, 2017 to 2022

    5.3. Current and Future Market Size Value (US$ Million) & Volume (MT) Analysis and Forecast By Equipment, 2023 to 2033

        5.3.1. Tortilla Baking Oven

        5.3.2. Tortilla Cooling Machine

        5.3.3. Tortilla Grouping Machine

    5.4. Y-o-Y Growth Trend Analysis By Equipment, 2017 to 2022

    5.5. Absolute $ Opportunity Analysis By Equipment, 2023 to 2033

6. Global Market Analysis 2017 to 2022 and Forecast 2023 to 2033, By Automation

    6.1. Introduction / Key Findings

    6.2. Historical Market Size Value (US$ Million) & Volume (MT) Analysis By Automation, 2017 to 2022

    6.3. Current and Future Market Size Value (US$ Million) & Volume (MT) Analysis and Forecast By Automation, 2023 to 2033

        6.3.1. Manual

        6.3.2. Seimi-Automatic

        6.3.3. Fully-Automatic

    6.4. Y-o-Y Growth Trend Analysis By Automation, 2017 to 2022

    6.5. Absolute $ Opportunity Analysis By Automation, 2023 to 2033

7. Global Market Analysis 2017 to 2022 and Forecast 2023 to 2033, By End User

    7.1. Introduction / Key Findings

    7.2. Historical Market Size Value (US$ Million) & Volume (MT) Analysis By End User, 2017 to 2022

    7.3. Current and Future Market Size Value (US$ Million) & Volume (MT) Analysis and Forecast By End User, 2023 to 2033

        7.3.1. Food Processing Industries

        7.3.2. Restaurants

        7.3.3. Household

        7.3.4. Caterers

        7.3.5. Caterers

    7.4. Y-o-Y Growth Trend Analysis By End User, 2017 to 2022

    7.5. Absolute $ Opportunity Analysis By End User, 2023 to 2033

8. Global Market Analysis 2017 to 2022 and Forecast 2023 to 2033, By Region

    8.1. Introduction

    8.2. Historical Market Size Value (US$ Million) & Volume (MT) Analysis By Region, 2017 to 2022

    8.3. Current Market Size Value (US$ Million) & Volume (MT) Analysis and Forecast By Region, 2023 to 2033

        8.3.1. North America

        8.3.2. Latin America

        8.3.3. Europe

        8.3.4. East Asia

        8.3.5. South Asia

        8.3.6. Oceania

        8.3.7. Middle East and Africa (MEA)

    8.4. Market Attractiveness Analysis By Region

9. North America Market Analysis 2017 to 2022 and Forecast 2023 to 2033, By Country

    9.1. Historical Market Size Value (US$ Million) & Volume (MT) Trend Analysis By Market Taxonomy, 2017 to 2022

    9.2. Market Size Value (US$ Million) & Volume (MT) Forecast By Market Taxonomy, 2023 to 2033

        9.2.1. By Country

            9.2.1.1.United States of America

            9.2.1.2. Canada

        9.2.2. By Equipment

        9.2.3. By Automation

        9.2.4. By End User

    9.3. Market Attractiveness Analysis

        9.3.1. By Country

        9.3.2. By Equipment

        9.3.3. By Automation

        9.3.4. By End User

    9.4. Key Takeaways

10. Latin America Market Analysis 2017 to 2022 and Forecast 2023 to 2033, By Country

    10.1. Historical Market Size Value (US$ Million) & Volume (MT) Trend Analysis By Market Taxonomy, 2017 to 2022

    10.2. Market Size Value (US$ Million) & Volume (MT) Forecast By Market Taxonomy, 2023 to 2033

        10.2.1. By Country

            10.2.1.1. Brazil

            10.2.1.2. Mexico

            10.2.1.3. Argentina

            10.2.1.4. Chile

            10.2.1.5. Peru

            10.2.1.6. Rest of Latin America

        10.2.2. By Equipment

        10.2.3. By Automation

        10.2.4. By End User

    10.3. Market Attractiveness Analysis

        10.3.1. By Country

        10.3.2. By Equipment

        10.3.3. By Automation

        10.3.4. By End User

    10.4. Key Takeaways

11. Europe Market Analysis 2017 to 2022 and Forecast 2023 to 2033, By Country

    11.1. Historical Market Size Value (US$ Million) & Volume (MT) Trend Analysis By Market Taxonomy, 2017 to 2022

    11.2. Market Size Value (US$ Million) & Volume (MT) Forecast By Market Taxonomy, 2023 to 2033

        11.2.1. By Country

            11.2.1.1. Germany

            11.2.1.2. Italy

            11.2.1.3. France

            11.2.1.4. United Kingdom

            11.2.1.5. Spain

            11.2.1.6. Russia

            11.2.1.7. BENELUX

            11.2.1.8. Poland

            11.2.1.9. Nordic Countries

            11.2.1.10. Rest of Europe

        11.2.2. By Equipment

        11.2.3. By Automation

        11.2.4. By End User

    11.3. Market Attractiveness Analysis

        11.3.1. By Country

        11.3.2. By Equipment

        11.3.3. By Automation

        11.3.4. By End User

    11.4. Key Takeaways

12. East Asia Market Analysis 2017 to 2022 and Forecast 2023 to 2033, By Country

    12.1. Historical Market Size Value (US$ Million) & Volume (MT) Trend Analysis By Market Taxonomy, 2017 to 2022

    12.2. Market Size Value (US$ Million) & Volume (MT) Forecast By Market Taxonomy, 2023 to 2033

        12.2.1. By Country

            12.2.1.1. China

            12.2.1.2. Japan

            12.2.1.3. South Korea

        12.2.2. By Equipment

        12.2.3. By Automation

        12.2.4. By End User

    12.3. Market Attractiveness Analysis

        12.3.1. By Country

        12.3.2. By Equipment

        12.3.3. By Automation

        12.3.4. By End User

    12.4. Key Takeaways

13. South Asia Market Analysis 2017 to 2022 and Forecast 2023 to 2033, By Country

    13.1. Historical Market Size Value (US$ Million) & Volume (MT) Trend Analysis By Market Taxonomy, 2017 to 2022

    13.2. Market Size Value (US$ Million) & Volume (MT) Forecast By Market Taxonomy, 2023 to 2033

        13.2.1. By Country

            13.2.1.1. India

            13.2.1.2. Thailand

            13.2.1.3. Malaysia

            13.2.1.4. Indonesia

            13.2.1.5. Rest of South Asia

        13.2.2. By Equipment

        13.2.3. By Automation

        13.2.4. By End User

    13.3. Market Attractiveness Analysis

        13.3.1. By Country

        13.3.2. By Equipment

        13.3.3. By Automation

        13.3.4. By End User

    13.4. Key Takeaways

14. Oceania Market Analysis 2017 to 2022 and Forecast 2023 to 2033, By Country

    14.1. Historical Market Size Value (US$ Million) & Volume (MT) Trend Analysis By Market Taxonomy, 2017 to 2022

    14.2. Market Size Value (US$ Million) & Volume (MT) Forecast By Market Taxonomy, 2023 to 2033

        14.2.1. By Country

            14.2.1.1. Australia

            14.2.1.2. New Zealand

        14.2.2. By Equipment

        14.2.3. By Automation

        14.2.4. By End User

    14.3. Market Attractiveness Analysis

        14.3.1. By Country

        14.3.2. By Equipment

        14.3.3. By Automation

        14.3.4. By End User

    14.4. Key Takeaways

15. MEA Market Analysis 2017 to 2022 and Forecast 2023 to 2033, By Country

    15.1. Historical Market Size Value (US$ Million) & Volume (MT) Trend Analysis By Market Taxonomy, 2017 to 2022

    15.2. Market Size Value (US$ Million) & Volume (MT) Forecast By Market Taxonomy, 2023 to 2033

        15.2.1. By Country

            15.2.1.1. GCC Countries

            15.2.1.2. South Africa

            15.2.1.3. Central Africa

            15.2.1.4. North Africa

        15.2.2. By Equipment

        15.2.3. By Automation

        15.2.4. By End User

    15.3. Market Attractiveness Analysis

        15.3.1. By Country

        15.3.2. By Equipment

        15.3.3. By Automation

        15.3.4. By End User

    15.4. Key Takeaways

16. Key Countries Market Analysis

    16.1. United States of America

        16.1.1. Pricing Analysis

        16.1.2. Market Share Analysis, 2022

            16.1.2.1. By Equipment

            16.1.2.2. By Automation

            16.1.2.3. By End User

    16.2. Canada

        16.2.1. Pricing Analysis

        16.2.2. Market Share Analysis, 2022

            16.2.2.1. By Equipment

            16.2.2.2. By Automation

            16.2.2.3. By End User

    16.3. Brazil

        16.3.1. Pricing Analysis

        16.3.2. Market Share Analysis, 2022

            16.3.2.1. By Equipment

            16.3.2.2. By Automation

            16.3.2.3. By End User

    16.4. Mexico

        16.4.1. Pricing Analysis

        16.4.2. Market Share Analysis, 2022

            16.4.2.1. By Equipment

            16.4.2.2. By Automation

            16.4.2.3. By End User

    16.5. Argentina

        16.5.1. Pricing Analysis

        16.5.2. Market Share Analysis, 2022

            16.5.2.1. By Equipment

            16.5.2.2. By Automation

            16.5.2.3. By End User

    16.6. Chile

        16.6.1. Pricing Analysis

        16.6.2. Market Share Analysis, 2022

            16.6.2.1. By Equipment

            16.6.2.2. By Automation

            16.6.2.3. By End User

    16.7. Peru

        16.7.1. Pricing Analysis

        16.7.2. Market Share Analysis, 2022

            16.7.2.1. By Equipment

            16.7.2.2. By Automation

            16.7.2.3. By End User

    16.8. Germany

        16.8.1. Pricing Analysis

        16.8.2. Market Share Analysis, 2022

            16.8.2.1. By Equipment

            16.8.2.2. By Automation

            16.8.2.3. By End User

    16.9. Italy

        16.9.1. Pricing Analysis

        16.9.2. Market Share Analysis, 2022

            16.9.2.1. By Equipment

            16.9.2.2. By Automation

            16.9.2.3. By End User

    16.10. France

        16.10.1. Pricing Analysis

        16.10.2. Market Share Analysis, 2022

            16.10.2.1. By Equipment

            16.10.2.2. By Automation

            16.10.2.3. By End User

    16.11. Spain

        16.11.1. Pricing Analysis

        16.11.2. Market Share Analysis, 2022

            16.11.2.1. By Equipment

            16.11.2.2. By Automation

            16.11.2.3. By End User

    16.12. United Kingdom

        16.12.1. Pricing Analysis

        16.12.2. Market Share Analysis, 2022

            16.12.2.1. By Equipment

            16.12.2.2. By Automation

            16.12.2.3. By End User

    16.13. Russia

        16.13.1. Pricing Analysis

        16.13.2. Market Share Analysis, 2022

            16.13.2.1. By Equipment

            16.13.2.2. By Automation

            16.13.2.3. By End User

    16.14. Poland

        16.14.1. Pricing Analysis

        16.14.2. Market Share Analysis, 2022

            16.14.2.1. By Equipment

            16.14.2.2. By Automation

            16.14.2.3. By End User

    16.15. BENELUX

        16.15.1. Pricing Analysis

        16.15.2. Market Share Analysis, 2022

            16.15.2.1. By Equipment

            16.15.2.2. By Automation

            16.15.2.3. By End User

    16.16. Nordic Countries

        16.16.1. Pricing Analysis

        16.16.2. Market Share Analysis, 2022

            16.16.2.1. By Equipment

            16.16.2.2. By Automation

            16.16.2.3. By End User

    16.17. China

        16.17.1. Pricing Analysis

        16.17.2. Market Share Analysis, 2022

            16.17.2.1. By Equipment

            16.17.2.2. By Automation

            16.17.2.3. By End User

    16.18. Japan

        16.18.1. Pricing Analysis

        16.18.2. Market Share Analysis, 2022

            16.18.2.1. By Equipment

            16.18.2.2. By Automation

            16.18.2.3. By End User

    16.19. South Korea

        16.19.1. Pricing Analysis

        16.19.2. Market Share Analysis, 2022

            16.19.2.1. By Equipment

            16.19.2.2. By Automation

            16.19.2.3. By End User

    16.20. India

        16.20.1. Pricing Analysis

        16.20.2. Market Share Analysis, 2022

            16.20.2.1. By Equipment

            16.20.2.2. By Automation

            16.20.2.3. By End User

    16.21. Thailand

        16.21.1. Pricing Analysis

        16.21.2. Market Share Analysis, 2022

            16.21.2.1. By Equipment

            16.21.2.2. By Automation

            16.21.2.3. By End User

    16.22. Indonesia

        16.22.1. Pricing Analysis

        16.22.2. Market Share Analysis, 2022

            16.22.2.1. By Equipment

            16.22.2.2. By Automation

            16.22.2.3. By End User

    16.23. Malaysia

        16.23.1. Pricing Analysis

        16.23.2. Market Share Analysis, 2022

            16.23.2.1. By Equipment

            16.23.2.2. By Automation

            16.23.2.3. By End User

    16.24. Singapore

        16.24.1. Pricing Analysis

        16.24.2. Market Share Analysis, 2022

            16.24.2.1. By Equipment

            16.24.2.2. By Automation

            16.24.2.3. By End User

    16.25. GCC Countries

        16.25.1. Pricing Analysis

        16.25.2. Market Share Analysis, 2022

            16.25.2.1. By Equipment

            16.25.2.2. By Automation

            16.25.2.3. By End User

    16.26. South Africa

        16.26.1. Pricing Analysis

        16.26.2. Market Share Analysis, 2022

            16.26.2.1. By Equipment

            16.26.2.2. By Automation

            16.26.2.3. By End User

    16.27. Central Africa

        16.27.1. Pricing Analysis

        16.27.2. Market Share Analysis, 2022

            16.27.2.1. By Equipment

            16.27.2.2. By Automation

            16.27.2.3. By End User

    16.28. North Africa

        16.28.1. Pricing Analysis

        16.28.2. Market Share Analysis, 2022

            16.28.2.1. By Equipment

            16.28.2.2. By Automation

            16.28.2.3. By End User

17. Market Structure Analysis

    17.1. Competition Dashboard

    17.2. Competition Benchmarking

    17.3. Market Share Analysis of Top Players

        17.3.1. By Regional

        17.3.2. By Equipment

        17.3.3. By Automation

        17.3.4. By End User

18. Competition Analysis

    18.1. Competition Deep Dive

        18.1.1. J.c. Ford

            18.1.1.1. Overview

            18.1.1.2. Product Portfolio

            18.1.1.3. Profitability by Market Segments

            18.1.1.4. Sales Footprint

            18.1.1.5. Strategy Overview

                18.1.1.5.1. Marketing Strategy

                18.1.1.5.2. Product Strategy

                18.1.1.5.3. Channel Strategy

        18.1.2. UTF Group

            18.1.2.1. Overview

            18.1.2.2. Product Portfolio

            18.1.2.3. Profitability by Market Segments

            18.1.2.4. Sales Footprint

            18.1.2.5. Strategy Overview

                18.1.2.5.1. Marketing Strategy

                18.1.2.5.2. Product Strategy

                18.1.2.5.3. Channel Strategy

        18.1.3. BE&SCO Manufacturing

            18.1.3.1. Overview

            18.1.3.2. Product Portfolio

            18.1.3.3. Profitability by Market Segments

            18.1.3.4. Sales Footprint

            18.1.3.5. Strategy Overview

                18.1.3.5.1. Marketing Strategy

                18.1.3.5.2. Product Strategy

                18.1.3.5.3. Channel Strategy

        18.1.4. Coperion & Coperion K-Tron

            18.1.4.1. Overview

            18.1.4.2. Product Portfolio

            18.1.4.3. Profitability by Market Segments

            18.1.4.4. Sales Footprint

            18.1.4.5. Strategy Overview

                18.1.4.5.1. Marketing Strategy

                18.1.4.5.2. Product Strategy

                18.1.4.5.3. Channel Strategy

        18.1.5. Heisler Industries, Inc.

            18.1.5.1. Overview

            18.1.5.2. Product Portfolio

            18.1.5.3. Profitability by Market Segments

            18.1.5.4. Sales Footprint

            18.1.5.5. Strategy Overview

                18.1.5.5.1. Marketing Strategy

                18.1.5.5.2. Product Strategy

                18.1.5.5.3. Channel Strategy

        18.1.6. Culinary Depot Inc.

            18.1.6.1. Overview

            18.1.6.2. Product Portfolio

            18.1.6.3. Profitability by Market Segments

            18.1.6.4. Sales Footprint

            18.1.6.5. Strategy Overview

                18.1.6.5.1. Marketing Strategy

                18.1.6.5.2. Product Strategy

                18.1.6.5.3. Channel Strategy

        18.1.7. HIX Corp.

            18.1.7.1. Overview

            18.1.7.2. Product Portfolio

            18.1.7.3. Profitability by Market Segments

            18.1.7.4. Sales Footprint

            18.1.7.5. Strategy Overview

                18.1.7.5.1. Marketing Strategy

                18.1.7.5.2. Product Strategy

                18.1.7.5.3. Channel Strategy

        18.1.8. Special Projects International, Inc

            18.1.8.1. Overview

            18.1.8.2. Product Portfolio

            18.1.8.3. Profitability by Market Segments

            18.1.8.4. Sales Footprint

            18.1.8.5. Strategy Overview

                18.1.8.5.1. Marketing Strategy

                18.1.8.5.2. Product Strategy

                18.1.8.5.3. Channel Strategy

        18.1.9. Empire Bakery Equipment

            18.1.9.1. Overview

            18.1.9.2. Product Portfolio

            18.1.9.3. Profitability by Market Segments

            18.1.9.4. Sales Footprint

            18.1.9.5. Strategy Overview

                18.1.9.5.1. Marketing Strategy

                18.1.9.5.2. Product Strategy

                18.1.9.5.3. Channel Strategy

        18.1.10. The Lanly Co.

            18.1.10.1. Overview

            18.1.10.2. Product Portfolio

            18.1.10.3. Profitability by Market Segments

            18.1.10.4. Sales Footprint

            18.1.10.5. Strategy Overview

                18.1.10.5.1. Marketing Strategy

                18.1.10.5.2. Product Strategy

                18.1.10.5.3. Channel Strategy

        18.1.11. Heat and Control, Inc.

            18.1.11.1. Overview

            18.1.11.2. Product Portfolio

            18.1.11.3. Profitability by Market Segments

            18.1.11.4. Sales Footprint

            18.1.11.5. Strategy Overview

                18.1.11.5.1. Marketing Strategy

                18.1.11.5.2. Product Strategy

                18.1.11.5.3. Channel Strategy

19. Assumptions & Acronyms Used

20. Research Methodology

Explore Process Automation Insights

View Reports
Future Market Insights

Tortilla Machine Market

Schedule a Call