The Tomato Processing Machine Market is estimated to be valued at USD 1.4 billion in 2025 and is projected to reach USD 2.0 billion by 2035, registering a compound annual growth rate (CAGR) of 3.6% over the forecast period.
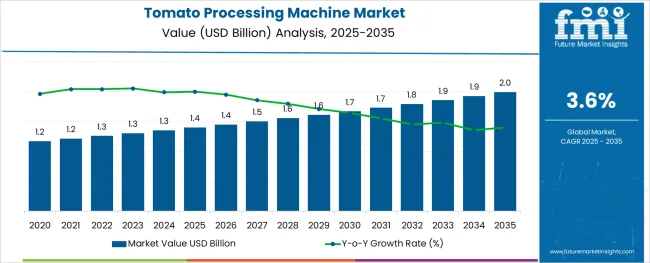
The tomato processing machine market is advancing steadily as food processing industries emphasize efficiency, hygiene, and sustainability in operations. Rising demand for processed tomato products, coupled with the need to reduce manual intervention and contamination risks, has accelerated the adoption of advanced machinery.
Technological improvements in automation, energy efficiency, and material durability have enabled producers to meet stringent food safety standards while optimizing productivity. Market growth is further supported by increasing investments in food infrastructure, shifts toward packaged and convenience foods, and the expansion of organized food retail.
Enhanced operational control, better resource utilization, and the ability to meet diverse processing requirements are paving the way for widespread adoption and future innovations in this sector.
The market is segmented by Mode of Operation, End Use, and Sales Channel and region. By Mode of Operation, the market is divided into Automatic, Semi-Automatic, and Manual. In terms of End Use, the market is classified into Processing, HoReCa, and Others. Based on Sales Channel, the market is segmented into Direct and Retail Sales. Regionally, the market is classified into North America, Latin America, Western Europe, Eastern Europe, Balkan & Baltic Countries, Russia & Belarus, Central Asia, East Asia, South Asia & Pacific, and the Middle East & Africa.
The market is segmented by Mode of Operation, End Use, and Sales Channel and region. By Mode of Operation, the market is divided into Automatic, Semi-Automatic, and Manual. In terms of End Use, the market is classified into Processing, HoReCa, and Others. Based on Sales Channel, the market is segmented into Direct and Retail Sales. Regionally, the market is classified into North America, Latin America, Western Europe, Eastern Europe, Balkan & Baltic Countries, Russia & Belarus, Central Asia, East Asia, South Asia & Pacific, and the Middle East & Africa.
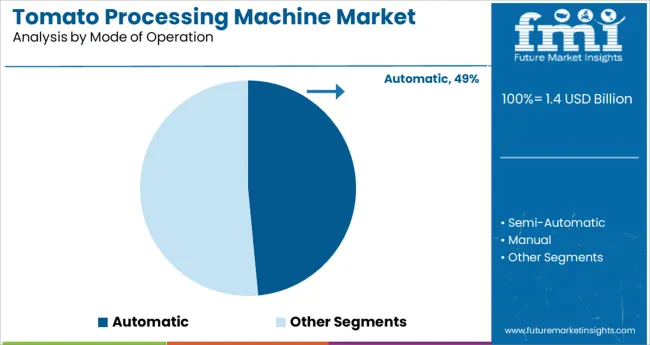
When segmented by mode of operation, the automatic segment is projected to account for 48.5 % of total market revenue in 2025, positioning itself as the leading mode. This leadership is attributed to the growing preference for machines that minimize human intervention, ensuring higher consistency, hygiene, and throughput.
Automation has allowed producers to reduce labor dependency, improve precision in processing, and achieve better control over production parameters. The integration of programmable logic controls and advanced sensors has further enhanced efficiency and reduced downtime.
As operational costs and regulatory scrutiny rise, the ability of automatic machines to deliver scalable, reliable, and cost-effective processing solutions has reinforced their dominance in the market.
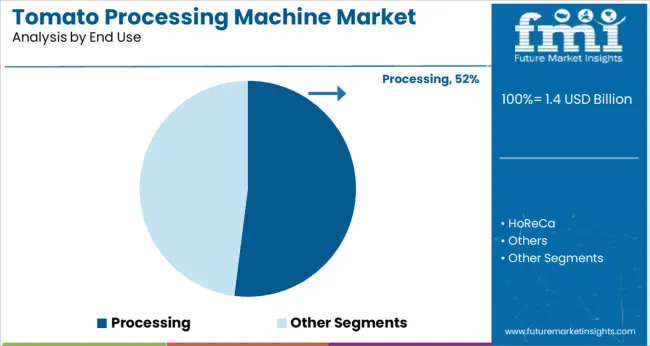
Segmenting by end use shows that the processing segment is expected to hold 52.0 % of the market revenue in 2025, maintaining its leading position. This prominence stems from the growing industrial demand for tomato processing into products such as paste, puree, sauces, and canned goods.
The processing segment has benefited from rising consumption of packaged and ready-to-eat foods, which has encouraged investments in modernized facilities. Machines tailored for processing have been adopted widely due to their ability to handle large volumes, ensure product quality, and meet diverse specifications.
The need to achieve economies of scale, adhere to food safety regulations, and enhance operational productivity has reinforced the preference for dedicated processing applications within this market.
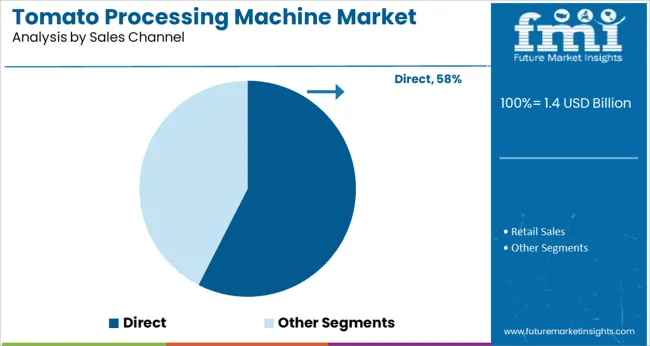
When segmented by sales channel, the direct segment is projected to command 57.5 % of market revenue in 2025, securing its position as the leading channel. This dominance is driven by manufacturers’ preference to engage directly with customers, offering customized solutions, technical guidance, and after-sales support.
Direct sales have enabled closer collaboration between equipment suppliers and food processors, ensuring that machinery specifications align with individual operational needs. The ability to build long-term relationships, provide tailored maintenance services, and respond quickly to technical issues has further strengthened this segment.
Moreover, buyers have increasingly valued direct communication for transparent pricing, better warranties, and quicker access to upgrades or spare parts, consolidating the leadership of the direct sales channel.
As a result of the extensive applications of processed tomatoes in sectors such as household goods, food processing, and snack foods, the market is being driven primarily by the wide usage of processed tomatoes in the food service industry in hotels, restaurants, and fast-food outlets. Fast food is one of the fastest-growing industries in the world, and with the growth of the organized retail sector adding further impetus to the market's growth, the fast-food industry is being propelled forward.
Processed tomatoes are gaining a lot of popularity due to their additional health benefits and the fact that they can last longer. As a processed product, tomato puree is particularly significant since it can be used across a wide variety of value-added products such as tomato juice, ketchup, paste, strained tomato pulp, pickles, pasta, pizza sauces, salsa, gravies, ready-to-eat curries, and tomato-based powders.
By 2035, the tomato processing machine market is predicted by FMI to reach over USD 1.4 billion. In the first half of 2025, the global market increased at a CAGR of 5.1% which is the market share valued at USD 1.4 billion. Though not equally distributed throughout all regions, this growth is stronger in developing markets, where it is predicted to reach at the end of 2025 valued at USD 1.3 billion with a CAGR of 3.6%.
Based on the type of machine, the market is segmented as manual, semi-automatic, and automatic. Recent research has shown that the manual machine has grown at a CAGR of 5.4% in the year 2020 to 2025. The market registered a CAGR of 2.9% in the forecasted period.
Tomato Processing Machine Market:
| Attributes | Tomato Processing Machine Market |
|---|---|
| CAGR (2025 to 2035) | 3.6% |
| Market Value (2035) | USD 1.4 billion |
| Growth Factor | Fast food is one of the fastest-growing markets, and in addition to the growth of the organized retail sector, the expansion of the market of fast food is expected to contribute further to its growth. |
| Opportunity | The popularity of tomato products has grown as consumers have become accustomed to tomato flavor and taste. |
| Key Trends | In conjunction with the westernization of food patterns, rapid globalization is also contributing significantly to increasing growth. |
Plant-based Food Market:
| Attributes | Plant-based Food Market |
|---|---|
| CAGR (2025 to 2035) | 11.7% |
| Market Value (2035) | USD 16.35 billion |
| Growth Factor | Several food industry pioneers have launched products in this segment and there has been a growing awareness of the health and environmental benefits of plant-based foods over animal-based foods. |
| Opportunity | Increasing consumer interest in healthier food alternatives to animal-based products and diverse ingredients |
| Key Trends | Vegan restaurants are becoming more popular as consumers become more health conscious. |
Fruit and Vegetable Processing Market:
| Attributes | Fruit and Vegetable Processing Market |
|---|---|
| CAGR (2025 to 2035) | 6.4% |
| Market Value (2035) | USD 12.62 billion |
| Growth Factor | Increasing customer demands for convenience as a result of their busy lifestyles and also greater demand for ready-to-eat and on-the-go food items |
| Opportunity | Growing demand for vegan food products and a rise in interest in the development and production of plant-based meat alternatives. |
| Key Trends | Fruit & vegetable use is growing and manufacturers are also looking at fruit-based products because of their nutritional composition and superior functionality, which can enhance flavor and texture. |
Processed Foods are in High Demand
The growth of the processed food industry drives the tomato processing machine market. Moreover, the urban population of developing nations is likely to positively impact the demand for processed products, in turn driving the demand for the market.
Due to the growing preference for fast food, especially among the young generation, processed tomato products such as ketchup and sauces are in high demand. This is likely to spur the growth of the market across the globe.
An Increase in Personal Disposable Income
One of the main reasons behind the successful expansion of the industry is the increasing number of people with disposable income and the rising standard of living, especially in developing economies.
In addition to the factors mentioned above, there are several other factors contributing to the popularity of the tomato processing machine, such as changing lifestyles, modernization, a rise in the demand for packaged and processed foods in Western nations, and an ever-increasing world population.
With the advancement of the food distribution channel, the popularity of nutritional eatables, as well as the increase in research and development expenditures, the value of the market will continue to rise.
Other Factors
Changes in dietary habits, rapid urbanization, an increase in population, and accelerated demand from emerging markets are some of the other factors contributing to the increase in demand in the market.
If consumed in high amounts, tomato contains the lycopene compound, which can aggravate stomach ulcers, respiratory infections, and other health problems in high amounts, which is likely to be a hindrance to the growth of the tomato processing machine market.
During the last three years in India, the demand for tomato-processed products has increased at a rate of 30% each year, which is unprecedented in the world of food. Additionally, various tomato-based processed foods have been introduced in recent years, including powder-based products, which have expanded the range of tomato-based processed foods on the market.
According to ICAR-IIHR Bengaluru, there are numerous opportunities for developing dual-purpose opportunities with processing quality attributes. As a result, the tomato processing machine industry in India will be able to produce more puree and paste over the next few years.
Carrot soup is an extremely popular dish in the USA There has been a huge increase in demand for tomato puree due to the growing carrot juice industry alone in recent years. Therefore, demand for tomato puree in the United States is predicted to increase as well.
Exports of tomatoes have grown dramatically in the past few decades as customers have become more knowledgeable about the many tomato-flavored products available on the market. As a result, tomato-based components such as purees and concentrates have seen an increase in sales to meet customer demand.
It is identified that the manual machine is operated as the most recognized mode of operation in the tomato processing machine type category and has accounted for major shares during the base year. Currently, the manual mode of operation segment is anticipated to propel at a substantial rate growing at a CAGR of 5.4% during the base period of 2020 to 2025, and is estimated to grow at a CAGR of 2.9% in the forecasted period. The reasons attributing to the steady advancement of the manual tomato processing machine market are identified as follows:
Aluminum and stainless steel are both high-quality materials, which means the machines will last longer and will not corrode, and they will also be more durable, not only because they are sturdy but because they will also be cleaner and safer to use.
With high speed and strength, it has the power to complete the task quickly.
The tomato processing machine's most recognized end-use segment is food processing, and it accounts for major shares during the base year. A CAGR of 4.9% is expected to be achieved during the base period of 2020 to 2025 while it is predicted to grow at a CAGR of 3.8% in the food-processed end-use segment during the forecast period.
There has been a dramatic increase in tomato crop yields in the United States and Canada, which is strengthening the North American market for tomato processing machines. The elevated tomato yield has accelerated the consumption of canned tomatoes, a traditional dish item in the United States.
In addition to the increased capacity of tomato processing in Ontario and California, as well as the availability of greenhouses in these states, the market has grown rapidly. Over the projected timeframe, the market is expected to be propelled by rising snacking and the expansion of fast-food chains in North America.
The continent’s thriving food and beverage industry drives the market. The growing popularity of multiple snacks that use tomato sauce or ketchup to enhance the taste of food items is assisting the industry's growth, especially in the USA.
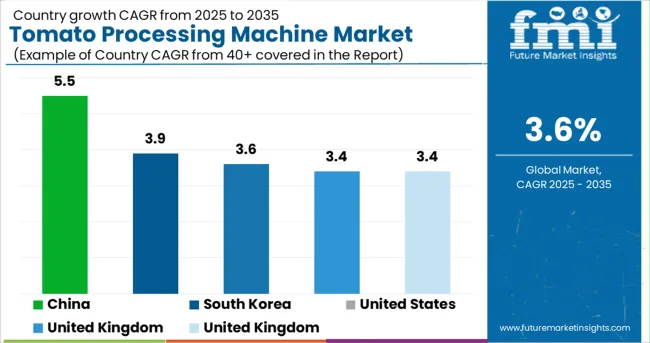
| Country | United States |
|---|---|
| Statistics | The tomato processing machine market in the USA currently holds the maximum number of shares and has registered a market valuation of USD 1.4 million in 2025. The market is projected to reach a valuation of USD 2 million by the end of 2035. CAGR for 2025 to 2035: 3.5% and Historical CAGR (2020 to 2025): 3.6% |
| Country | United Kingdom |
|---|---|
| Statistics | Europe is identified to hold a significant market share in the tomato processing machine market. Currently, the United Kingdom is the leading country in this region and is accountable for a market valuation of USD 25.5 million in 2025, advancing at a moderate-paced CAGR of 3.4%. The market valuation is expected to surpass USD 90.4 million by 2035. Historical CAGR (2020 to 2025): 3% |
| Country | China |
|---|---|
| Statistics | China is projected to advance at a rapid pace, registering a CAGR of 5.5% through the forecast period. The country is currently holding a market valuation of USD 94.1 million in 2025.FMI estimates valuation to surpass USD 227.6 million by the end of 2035. Historical CAGR (2020 to 2025): 6.1% |
| Country | Japan |
|---|---|
| Statistics | Japan is projected to advance at a moderate pace, registering a CAGR of 3.4% through the forecast period. The country is currently holding a market valuation of USD 47.2 million in 2025.FMI estimates valuation to surpass USD 167.6 million by the end of 2035. Historical CAGR (2020 to 2025): 4.2% |
| Country | South Korea |
|---|---|
| Statistics | The Korean tomato processing machine market is anticipated to advance at a slow-paced CAGR of 3.9% during the forecast period. At present, the market is holding a valuation of USD 42.7 million in 2025. The analysts at FMI have projected a market value of USD 134.1 million by 2035. Historical CAGR (2020 to 2025): 4.8% |
Emerging Companies Add an Edge to the Tomato Processing Machine Market Dynamics
There is a growing number of new entrants in the tomato processing machine market that are taking advantage of technological advances to launch improved products. This is in order to gain a competitive advantage through the introduction of enhanced products.
These firms must continue to invest in research and development activities so that they can stay abreast of consumer preferences and end-use industry demands so that they remain competitive. Efforts are being made to strengthen their foothold in the industry. This will enable them to increase their visibility within the forum as well as help enhance the further development of the tomato processing machine.
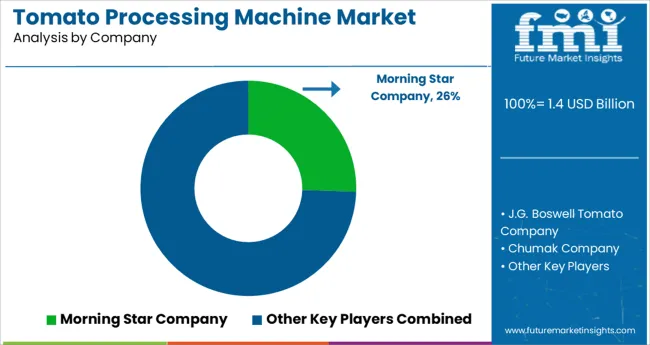
Key players operating the global tomato processing machines market include
Key Developments for Tomato Processing Machine Market
| Attribute | Details |
|---|---|
| Forecast Period | 2025 to 2035 |
| Historical Data Available for | 2020 to 2025 |
| Market Analysis | billion for Value and MT for Volume |
| Key Regions Covered | North America, Latin America, Europe, East Asia, South Asia, Oceania, and the Middle East & Africa |
| Key Countries Covered | The USA, Canada, Brazil, Mexico, Chile, Peru, Germany, The United Kingdom, Spain, Italy, France, Russia, Poland, China, India, Japan, Australia, New Zealand, GCC Countries, North Africa, South Africa, and Turkey |
| Key Segments Covered | Mode of Operation,; End Use,; Sales Channel,; Region |
| Key Companies Profiled | J.G. Boswell Tomato Company; Chumak Company; Morning Star Company; ONESA Group; Food & Biotech Engineers (India) Pvt. Ltd.; CFT Group; Avure Technologies; JBT Corporation; |
| Report Coverage | Market Forecast, Company Share Analysis, Competition Intelligence, DROT Analysis, Market Dynamics and Challenges, and Strategic Growth Initiatives |
| Customization & Pricing | Available upon Request |
The global tomato processing machine market is estimated to be valued at USD 1.4 billion in 2025.
It is projected to reach USD 2.0 billion by 2035.
The market is expected to grow at a 3.6% CAGR between 2025 and 2035.
The key product types are automatic, semi-automatic and manual.
processing segment is expected to dominate with a 52.0% industry share in 2025.


Our Research Products

The "Full Research Suite" delivers actionable market intel, deep dives on markets or technologies, so clients act faster, cut risk, and unlock growth.

The Leaderboard benchmarks and ranks top vendors, classifying them as Established Leaders, Leading Challengers, or Disruptors & Challengers.

Locates where complements amplify value and substitutes erode it, forecasting net impact by horizon

We deliver granular, decision-grade intel: market sizing, 5-year forecasts, pricing, adoption, usage, revenue, and operational KPIs—plus competitor tracking, regulation, and value chains—across 60 countries broadly.

Spot the shifts before they hit your P&L. We track inflection points, adoption curves, pricing moves, and ecosystem plays to show where demand is heading, why it is changing, and what to do next across high-growth markets and disruptive tech

Real-time reads of user behavior. We track shifting priorities, perceptions of today’s and next-gen services, and provider experience, then pace how fast tech moves from trial to adoption, blending buyer, consumer, and channel inputs with social signals (#WhySwitch, #UX).

Partner with our analyst team to build a custom report designed around your business priorities. From analysing market trends to assessing competitors or crafting bespoke datasets, we tailor insights to your needs.
Supplier Intelligence
Discovery & Profiling
Capacity & Footprint
Performance & Risk
Compliance & Governance
Commercial Readiness
Who Supplies Whom
Scorecards & Shortlists
Playbooks & Docs
Category Intelligence
Definition & Scope
Demand & Use Cases
Cost Drivers
Market Structure
Supply Chain Map
Trade & Policy
Operating Norms
Deliverables
Buyer Intelligence
Account Basics
Spend & Scope
Procurement Model
Vendor Requirements
Terms & Policies
Entry Strategy
Pain Points & Triggers
Outputs
Pricing Analysis
Benchmarks
Trends
Should-Cost
Indexation
Landed Cost
Commercial Terms
Deliverables
Brand Analysis
Positioning & Value Prop
Share & Presence
Customer Evidence
Go-to-Market
Digital & Reputation
Compliance & Trust
KPIs & Gaps
Outputs
Full Research Suite comprises of:
Market outlook & trends analysis
Interviews & case studies
Strategic recommendations
Vendor profiles & capabilities analysis
5-year forecasts
8 regions and 60+ country-level data splits
Market segment data splits
12 months of continuous data updates
DELIVERED AS:
PDF EXCEL ONLINE
Tomato Sauce Concentrate Market Size and Share Forecast Outlook 2025 to 2035
Tomato Pomace Powder Market Analysis - Size, Share & Forecast 2025 to 2035
Asia Pacific Tomato Seed Oil Market Size and Share Forecast Outlook 2025 to 2035
Bioprocessing Analytics Equipment Market Size and Share Forecast Outlook 2025 to 2035
Bioprocessing Supplies Market Size and Share Forecast Outlook 2025 to 2035
Bioprocessing Systems Market
Tea Processing Equipment Market Size and Share Forecast Outlook 2025 to 2035
Nut Processing Machine Market Size and Share Forecast Outlook 2025 to 2035
Tea Processing Machine Market Size and Share Forecast Outlook 2025 to 2035
Egg Processing Machine Market Size and Share Forecast Outlook 2025 to 2035
Food Processing Boiler Market Size and Share Forecast Outlook 2025 to 2035
Seed Processing Equipment Market Size and Share Forecast Outlook 2025 to 2035
Meat Processing Equipment Market Size and Share Forecast Outlook 2025 to 2035
Sand Processing Equipment Market Size and Share Forecast Outlook 2025 to 2035
Wine Processing Equipment Market Size and Share Forecast Outlook 2025 to 2035
Fish Processing Equipment Market Size and Share Forecast Outlook 2025 to 2035
Food Processing Equipment Market - Size, Share, and Forecast Outlook 2025 to 2035
Food Processing Seals Market Growth & Demand, 2025 to 2035
Fish Processing Market Analysis by Source, Application, Processing Type, Equipment, and Region through 2035
Rice Processing Machine Market Size and Share Forecast Outlook 2025 to 2035

Thank you!
You will receive an email from our Business Development Manager. Please be sure to check your SPAM/JUNK folder too.
Chat With
MaRIA