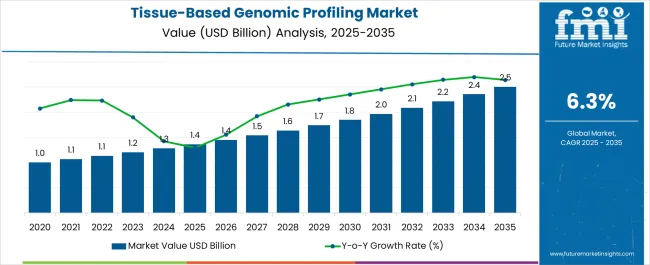
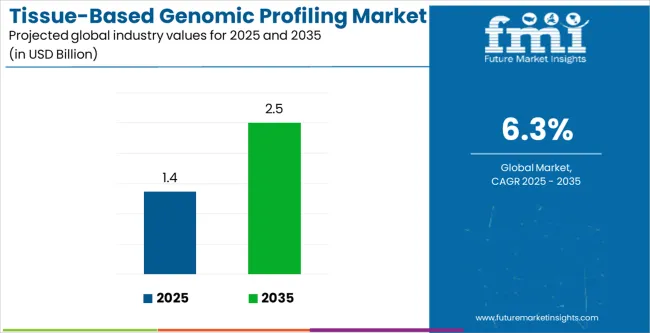
The Tissue-Based Genomic Profiling Market is estimated to be valued at USD 1.4 billion in 2025 and is projected to reach USD 2.5 billion by 2035, registering a compound annual growth rate (CAGR) of 6.3% over the forecast period.
| Metric | Value |
|---|---|
| Tissue-Based Genomic Profiling Market Estimated Value in (2025 E) | USD 1.4 billion |
| Tissue-Based Genomic Profiling Market Forecast Value in (2035 F) | USD 2.5 billion |
| Forecast CAGR (2025 to 2035) | 6.3% |
The tissue based genomic profiling market is expanding steadily as precision medicine and targeted therapies gain prominence in oncology and complex disease management. Growing demand for actionable insights from genomic data, combined with rising cancer incidence rates, has accelerated the adoption of tissue and liquid DNA based assays.
Advances in next generation sequencing platforms and bioinformatics have enabled deeper analysis of tumor heterogeneity, allowing clinicians to design more effective treatment pathways. Regulatory support for companion diagnostics and growing collaborations between pharmaceutical companies and diagnostic laboratories are further strengthening the market landscape.
The outlook remains promising as healthcare systems prioritize personalized medicine approaches, positioning genomic profiling as an indispensable tool for improving patient outcomes and advancing therapeutic innovation.
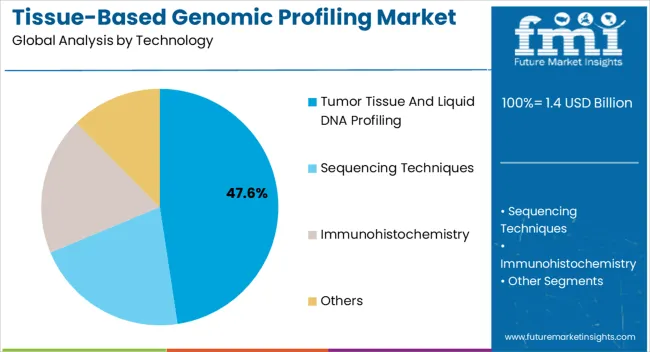
The tumor tissue and liquid DNA profiling segment is projected to hold 47.60% of the market by 2025, making it the leading technology category. Its growth is driven by the ability to deliver comprehensive genomic insights from both solid tumors and circulating DNA, enhancing the accuracy of cancer diagnostics.
This dual capability has been pivotal in enabling early detection, therapy monitoring, and resistance profiling. Adoption has been accelerated by its integration into clinical workflows and compatibility with targeted therapies.
As the demand for minimally invasive yet highly informative genomic tools continues to rise, this technology segment remains at the forefront of driving clinical adoption.
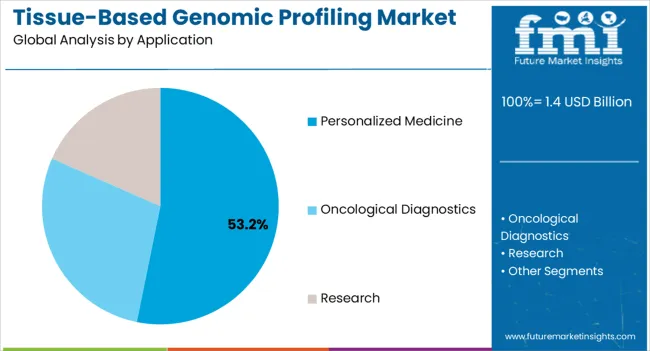
The personalized medicine segment is expected to capture 53.20% of total revenue by 2025, emerging as the dominant application area. This growth is being propelled by the increasing need for customized treatment pathways that account for individual genetic variations.
Healthcare providers are leveraging tissue based profiling to optimize drug selection, minimize adverse effects, and improve therapeutic outcomes. Pharmaceutical pipelines are increasingly aligned with biomarker driven drug development, reinforcing the role of genomic profiling in clinical trials and patient management.
The focus on precision and patient centric treatment has made personalized medicine the leading growth driver in the application category.
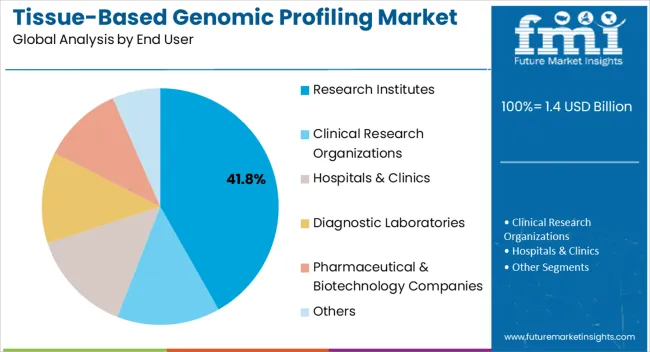
The research institutes segment is anticipated to represent 41.80% of total market share by 2025 within the end user category. This prominence is supported by rising investments in cancer genomics research, expanding collaborations with biotechnology firms, and government funded initiatives in molecular diagnostics.
Research institutes are actively utilizing genomic profiling technologies to uncover new biomarkers, validate companion diagnostics, and explore pathways for novel therapeutic interventions.
Their role in driving innovation, validating clinical utility, and expanding the scientific knowledge base has reinforced their position as the leading end user segment in the tissue based genomic profiling market.
From 2012 to 2025, the global tissue-based genomic profiling market experienced a CAGR of 5.0%, reaching a market size of USD 1.4 billion in 2025.
From 2012 to 2025, the global tissue-based genomic profiling industry witnessed steady growth due to the rising technological advancements in the tissue-based genomic profiling. Advances in genomic technology, such as next-generation sequencing (NGS), have fueled the expansion of tissue-based genomic profiling. These technologies have grown more accessible, cost-effective, and capable of analyzing massive volumes of genetic data, allowing for thorough tissue profiling.
Precision medicine, which includes personalizing therapies based on specific patient characteristics, has increased demand for tissue-based genetic profiling. Tissue genomic profiling reveals genetic changes, biomarkers, and therapeutic targets, enabling personalized treatment methods.
Future Forecast for Tissue-based Genomic Profiling Industry:
Looking ahead, the global tissue-based genomic profiling industry is expected to rise at a CAGR of 6.6% from 2025 to 2035. During the forecast period, the market size is expected to reach USD 2.2 billion.
The tissue-based genomic profiling industry is expected to continue its growth trajectory from 2025 to 2035, driven by increasing importance of liquid biopsy. The examination of circulating biomarkers in bodily fluids, known as liquid biopsy, is likely to develop significantly. Liquid biopsy is a non-invasive, real-time monitoring method for illness identification, treatment response evaluation, and minimal residual disease monitoring. Tissue-based genetic profiling will be critical in liquid biopsy diagnosis and personalized therapy decisions.
By allowing the examination of individual cells within a tissue sample, single-cell genomics has the potential to revolutionize tissue-based genetic profiling. This method will provide light on cellular heterogeneity, uncommon cell populations, and clonal development, allowing for a better understanding of disease progression, treatment response, and therapeutic resistance.
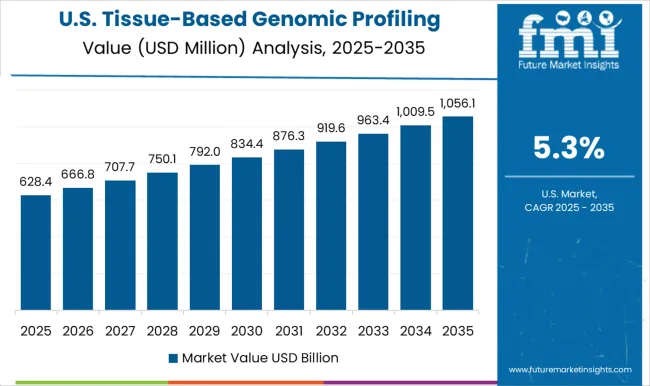
| Country | The United States |
|---|---|
| Market Size (USD million) by End of Forecast Period (2035) | USD 2.5 million |
| CAGR % 2025 to End of Forecast (2035) | 5.7% |
The tissue-based genomic profiling industry in the United States is expected to reach a market value of USD 2.5 million by 2035, expanding at a CAGR of 5.7%. The growing technological advancements in genomics in the United States can be ascribed to the country's increased market share. Government assistance in the form of financing and regulatory measures is important in driving the industry. Initiatives such as the National Institutes of Health's (NIH) Precision Medicine Initiative and the FDA's regulatory framework for genetic testing have a beneficial influence on the industry.
The United States is a world leader in genomics research, with a well-established infrastructure for genetic profiling. Next-generation sequencing (NGS), molecular diagnostics, and bioinformatics improvements all contribute to the growth of the tissue-based genomic profiling industry.
| Country | The United Kingdom |
|---|---|
| Market Size (USD million) by End of Forecast Period (2035) | USD 68.9 million |
| CAGR % 2025 to End of Forecast (2035) | 5.8% |
The tissue-based genomic profiling industry in the United Kingdom is expected to reach a market value of USD 68.9 million, expanding at a CAGR of 5.8% during the forecast period. The National Health Service in the United Kingdom is critical in advancing the use of tissue-based genetic profiling. Initiatives such as Genomics England's 100,000 Genomes Project aim to incorporate genomics into everyday healthcare and personalized treatment, ultimately driving the market.
| Country | China |
|---|---|
| Market Size (USD million) by End of Forecast Period (2035) | USD 2.5 million |
| CAGR % 2025 to End of Forecast (2035) | 6.4% |
The tissue-based genomic profiling industry in China is anticipated to reach a market value of USD 2.5 million, moving at a CAGR of 6.4 during the forecast period. The tissue-based genomic profiling industry in China is expected to grow prominently due to the increasing genomics research centers and government support. The Chinese government has made genomes research and precision medicine a priority. Initiatives like the Precision Medicine Initiative and the Healthy China 2035 plan encourage the use of genetic profiling in healthcare, propelling the market.
The Beijing Genomics Institute (BGI) and the Shanghai Genomic Institute are two of China's genomics research institutes. These centers contribute to genomic profiling technology research, development, and innovation, hence supporting market growth.
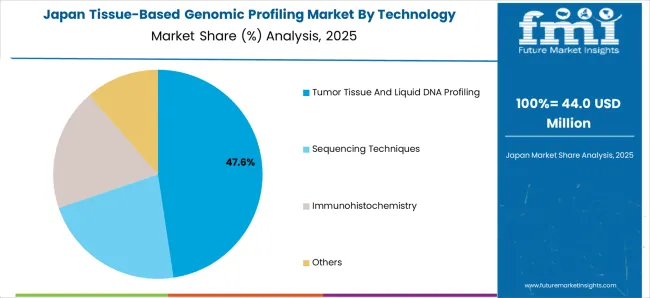
| Country | Japan |
|---|---|
| Market Size (USD million) by End of Forecast Period (2035) | USD 144.3 million |
| CAGR % 2025 to End of Forecast (2035) | 6.2% |
The tissue-based genomic profiling industry in Japan is estimated to reach a market value of USD 144.3 million by 2035, thriving at a CAGR of 6.2%. Japan has made tremendous advances in genomic research, developing low-cost genetic profiling methods. Because of the availability of low-cost sequencing technology and testing services, tissue-based genomic profiling is becoming more accessible to research institutions, fueling market expansion.
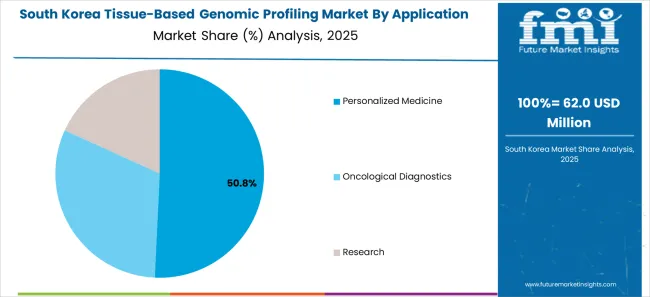
| Country | South Korea |
|---|---|
| Market Size (USD million) by End of Forecast Period (2035) | USD 73.2 Million |
| CAGR % 2025 to End of Forecast (2035) | 6.0% |
The tissue-based genomic profiling industry in South Korea is expected to reach a market value of USD 73.2 million, expanding at a CAGR of 6.0% during the forecast period. South Korea is a genomics research leader with a well-established genetic profiling infrastructure. Next-generation sequencing (NGS), molecular diagnostics, and bioinformatics improvements all contribute to the growth of the tissue-based genomic profiling industry.
Collaborations between the government, academia, and industry assist genomic profiling technology research, development, and commercialization. Partnerships between the public and private sectors boost innovation and market expansion.
The Tumor tissue and liquid DNA profiling is expected to dominate the tissue-based genomic profiling industry with a CAGR of 7.7% from 2025 to 2035. This segment captures a significant market share in 2025 and it is influenced by their unique advantages and applications. Tumor tissue profiling identifies particular genetic abnormalities in cancer cells, assisting in the precise diagnosis and categorization of distinct forms of cancer. Tissue-based genomic profiling can assist cancer patients find the best therapy choices by discovering actionable mutations or biomarkers that can be addressed with particular medicines. Liquid DNA profiling, on the other hand, can reveal genetic anomalies in the early stages of cancer, allowing for early intervention and therapy commencement. These reasons are increasing the market for Tumor tissue and Liquid DNA profiling.
The oncological diagnostics is expected to dominate the tissue-based genomic profiling industry with a CAGR of 6.5% from 2035 to 2035. This segment captures a significant market share in 2025 due to the non-invasive and early detection of cancer.
Genomic profiling has distinct benefits and complements in cancer therapy. Tissue profiling, for example, gives extensive information about the tumor's genetic landscape, whereas liquid DNA profiling provides non-invasive and dynamic monitoring capabilities. The desire for personalized care, improved patient outcomes, and advances in genetic technology are driving demand for both methods. Hence, this applications of genomic profiling in cancer detection, the demand is on the rise for oncological diagnostics over the forecast period.
The diagnostic laboratories are expected to dominate the tissue-based genomic profiling industry with a CAGR of 7.1%% from 2025 to 2035. This segment captures a significant market share in 2025 due to the enhanced accuracy of diagnosis.
Tissue-based genetic profiling enables diagnostic laboratories to provide more precise and personalized diagnostic and treatment recommendations, therefore enhancing patient care and results in a variety of illness areas, including cancer.
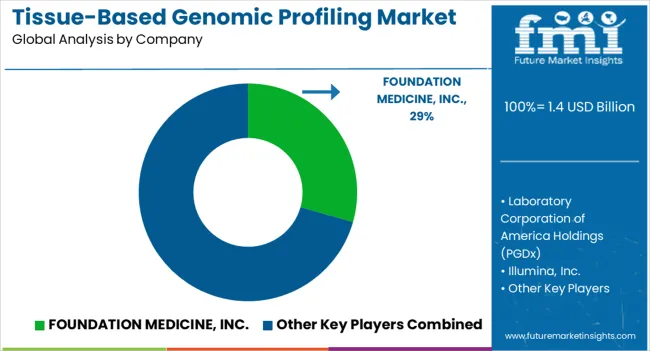
The tissue-based genomic profiling industry is highly competitive, with numerous players vying for market share. In such a scenario, key players in the tissue-based genomic profiling industry employ various strategies to stay competitive.
Key Strategies Adopted by the Players
Leading organisations spend in research and development to continuously enhance their genomic profiling technology. They aspire to create more sophisticated platforms, improve sequencing efficiency, data analysis capabilities, and the accuracy and sensitivity of genetic profiling tests. Staying on the cutting edge of technology innovations allows businesses to differentiate themselves and attract clients looking for the most up-to-date and dependable solutions.
Strategic alliances and cooperation with academic institutions, research organisations, and pharmaceutical businesses can increase a company's competitiveness. Collaborations allow major companies to gain access to innovative biomarkers, research findings, and knowledge, allowing them to provide cutting-edge solutions and remain at the forefront of innovation.
Key competitors are concentrating on broadening their market reach by expanding into new geographic regions and developing a strong worldwide presence. They may invest in the establishment of subsidiaries, distribution networks, or strategic partnerships in various countries in order to capitalize on developing market possibilities and obtain a competitive advantage over local competitors.
Key players in the tissue-based genomic profiling industry often engage in mergers and acquisitions to consolidate their market position, expand their product portfolio, and gain access to new markets.
Key Developments in the Tissue-based Genomic Profiling Market:
The global tissue-based genomic profiling market is estimated to be valued at USD 1.4 billion in 2025.
The market size for the tissue-based genomic profiling market is projected to reach USD 2.5 billion by 2035.
The tissue-based genomic profiling market is expected to grow at a 6.3% CAGR between 2025 and 2035.
The key product types in tissue-based genomic profiling market are tumor tissue and liquid dna profiling, sequencing techniques, _ngs, _sanger sequencing, _rna sequencing, immunohistochemistry and others.
In terms of application, personalized medicine segment to command 53.2% share in the tissue-based genomic profiling market in 2025.


Full Research Suite comprises of:
Market outlook & trends analysis
Interviews & case studies
Strategic recommendations
Vendor profiles & capabilities analysis
5-year forecasts
8 regions and 60+ country-level data splits
Market segment data splits
12 months of continuous data updates
DELIVERED AS:
PDF EXCEL ONLINE
Genomics Market Size and Share Forecast Outlook 2025 to 2035
Genomic Urine Testing Market Trends - Size, Share & Growth 2025 to 2035
Metagenomics Market Trends - Industry Analysis & Forecast 2025 to 2035
Nutragenomics Market Size and Share Forecast Outlook 2025 to 2035
Nutrigenomic Market Outlook - Growth, Demand & Forecast 2024 to 2034
CRISPR Genomic Cure Market
Synthetic Genomics Market
Molecular Diagnostics In Pharmacogenomics Market Size and Share Forecast Outlook 2025 to 2035
Industry Share & Competitive Positioning in Tumor Profiling
Thermal Profiling System Market Analysis - Size, Share, and Forecast Outlook 2025 to 2035
Antibody Profiling Market Analysis - Size, Share, & Forecast Outlook 2025 to 2035

Thank you!
You will receive an email from our Business Development Manager. Please be sure to check your SPAM/JUNK folder too.
Chat With
MaRIA