The Tipping Foils Market is estimated to be valued at USD 1.2 billion in 2025 and is projected to reach USD 1.7 billion by 2035, registering a compound annual growth rate (CAGR) of 3.0% over the forecast period.
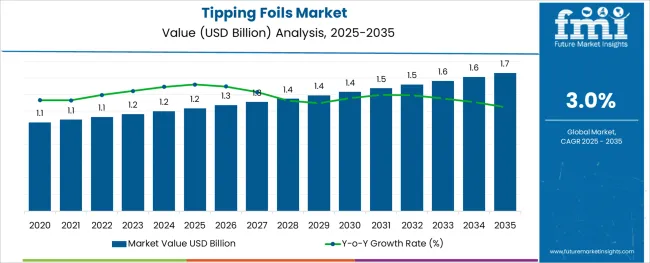
The tipping foils market is experiencing steady growth fueled by increasing demand for premium packaging and labeling in tobacco and other consumer goods industries. Emphasis on product differentiation through attractive, durable, and sustainable finishing materials is influencing the adoption of advanced foils. Manufacturers are focusing on enhancing printability, adhesion, and environmental compliance to meet evolving regulatory standards and consumer preferences.
Growth is supported by expanding label printing applications, where foils add aesthetic appeal and brand value, especially in premium product lines. The integration of digital printing technologies and automation in label production has further accelerated the adoption of tipping foils.
Additionally, rising awareness about counterfeit prevention and brand protection has led to increased use of specialty foils with security features. As industries prioritize sustainable sourcing and recyclability, innovations in eco-friendly paper-based foils are expected to pave the way for long-term growth in the market.
The market is segmented by Product Type and Application and region. By Product Type, the market is divided into Paper and Plastic. In terms of Application, the market is classified into Label Printer and Card Printer.
Regionally, the market is classified into North America, Latin America, Western Europe, Eastern Europe, Balkan & Baltic Countries, Russia & Belarus, Central Asia, East Asia, South Asia & Pacific, and the Middle East & Africa.
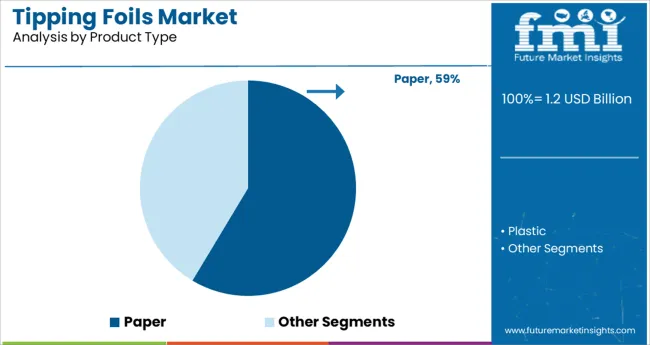
The paper product type segment is expected to hold 58.6% of the tipping foils market revenue in 2025, making it the leading product type. This dominance is attributed to paper foils’ superior eco-friendly profile, compatibility with various printing techniques, and cost effectiveness compared to metallic or synthetic alternatives.
Their ease of customization and recyclability align with growing sustainability demands from brands and consumers alike. Paper tipping foils also provide high print clarity and flexibility, enabling enhanced design options in packaging and labeling.
These factors have contributed to the widespread adoption of paper foils, particularly in tobacco and specialty product markets where environmental compliance and premium appearance are key drivers.
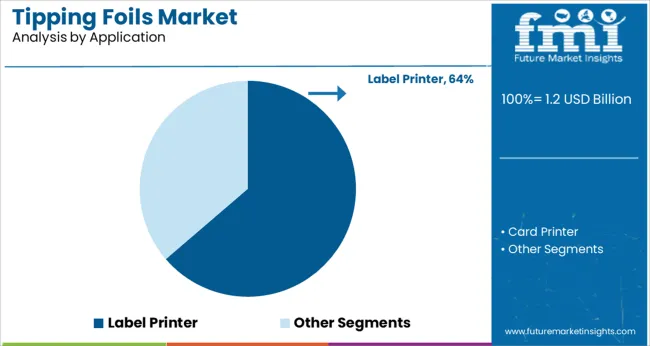
Within applications, the label printer segment is projected to capture 63.7% of the tipping foils market revenue in 2025, positioning it as the dominant application. The segment’s leadership is driven by the rising adoption of foil-based labels in packaging for brand differentiation and anti-counterfeiting measures.
Label printers benefit from the increasing demand for high-quality finishes, metallic effects, and tactile enhancements that tipping foils provide. Integration of advanced printing technologies such as digital and flexographic printing has improved efficiency and precision in foil application, further supporting growth.
The expanding use of decorative and security labels across sectors such as tobacco, beverages, and luxury goods has reinforced the critical role of label printers in driving tipping foil consumption.
In recent years, a significant rise in the trend of cashless payments is being experienced across the globe, on the back of increasing incidence of cash theft, shifting preference towards bank transactions, and inconvenience in carrying hard cash. The trend registered massive growth amidst the coronavirus pandemic, as people across the infected countries were increasingly avoiding the use of cash for monetary transactions due to the fear of getting infected.
Citing this trend, numerous financial and banking firms are emphasis on introducing new contactless monetary transaction-enabled cards to capitalize on the aforementioned trend. For instance, in September 2024, IDFC First Bank, an Indian private banking company, announced unveiling its novel contactless debit card, SafePay, for enhancing customer convenience for their daily transactions simply by waving the card against the near field communication (NFC) enabled point of sales (PoS) terminals.
Tipping foils improve adhesion, increase surface hardness, lower card rejection, and enhance durability, thereby, increasing the life of the raised numbers present on cards. As they also assist in increasing card aesthetics, sharpening details of embossed characters, fine lining card definition, and providing uniformity, these foils are extensively being used on financial cards. Thus, a slew of such launches is expected to propel the demand for tipping foils in the market.
The increasing shift in customer preference toward the adoption of online payments using smartphones and the rinsing introduction of novel online payment platforms such as UPI, internet banking, BHIM mobile applications, and others is negatively affecting the demand for financial cards. This is, in turn, hindering the sales of tipping foils in the global market.
In addition to this, the growing implementation of stringent regulations by governments across the USA, Germany, India, the UK, China, and others concerning the use of plastic, owing to the growing environmental concerns is restraining the growth in the plastic segment.
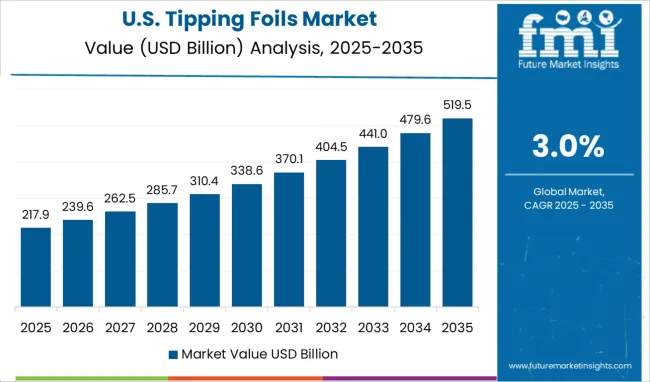
As per FMI, North America is estimated to exhibit growth at a rapid CAGR in the tipping foils market during the forecast period 2025 to 2035.
With the surging trend of cashless payments and the rising need for secured authentication for data access across corporate enterprises, a swift rise in the demand for cards such as ID cards, excess cards, debit cards, and credit cards is being witnessed across North America.
Hence, several industry players are aiming at launching new cards with innovative personalized features such as names, numbers, and others to cater to the growing demand. This is in turn, creating strong demand for associated products such as tipping foils in the North American market.
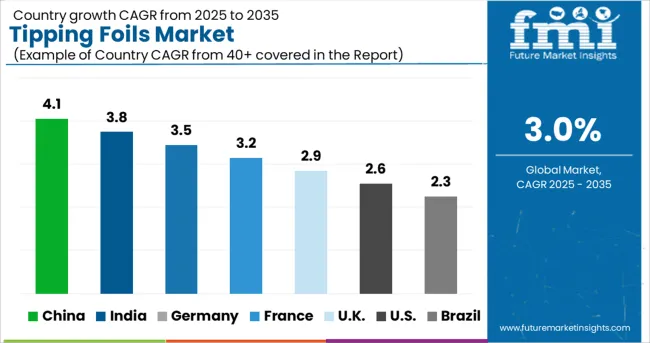
Future Market Insights states that Western Europe is anticipated to account for a significant share of the global tipping foils market over the forecast period 2025 to 2035.
As the trend of digitalization continues to create deeper inroads across Western Europe, a rapid shift in consumer preference towards online shopping is being experienced across the countries such as the UK, Germany, Spain, and others. Citing this trend, several clothing brands are launching novel membership and loyalty cards with tempting offers and discounts to increase the customer base.
For instance, Zara, a Spanish flagship clothing chain store recently announced the launching of exclusive membership cards with attractive benefits, birthday discounts, and offers for members. As these cards are embossed with tipping foils to make them look more personalized and appealing, a slew of such product launches is estimated to bolster the demand in the Western Europe market.
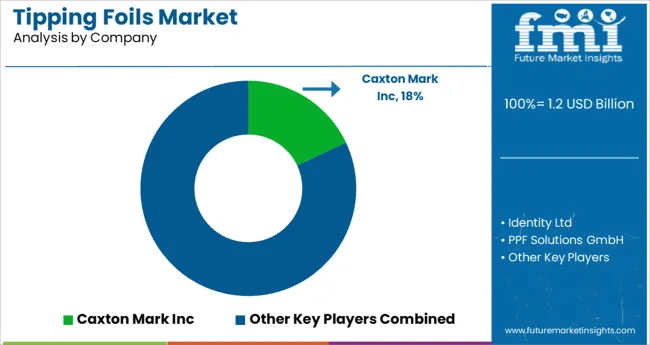
Some of the leading players in the global tipping foils market are Caxton Mark, Tavani Oy, Kurz.De, Capture Technologies, Kede, ITW Card Technologies, Peak-Ryzex, Zetatrade, QuickLabel, KROY LLC, Barcodes, Quipu, BRADY, IIMAK, Zebra and others.
Attributed to the presence of such a high number of participants and increasing product launches with superior durability and abrasion resistance, the market is highly competitive.
| Report Attribute | Details |
|---|---|
| Growth Rate in Automotive Sector | CAGR of 3.0% from 2025 to 2035 |
| Base Year for Estimation | 2024 |
| Historical Data | 2020 to 2024 |
| Forecast Period | 2025 to 2035 |
| Quantitative Units | Revenue in million and CAGR from 2025 to 2035 |
| Report Coverage | Revenue Forecast, Volume Forecast, Company Ranking, Competitive Landscape, Growth Factors, Trends, and Pricing Analysis |
| Segments Covered | Product Type, Application, Region |
| Countries Covered | North America; Latin America; Western Europe; Eastern Europe; Asia-Pacific Excluding Japan (APEJ); Japan; Middle East and Africa |
| Key Companies Profiled | Caxton Mark; Tavani Oy; Kurz.De; Capture Technologies; Kede; ITW Card Technologies; Peak-Ryzex; Zetatrade; QuickLabel; KROY LLC; Barcodes; Quipu; BRADY; IIMAK; Zebra |
| Customization | Available Upon Request |
The global tipping foils market is estimated to be valued at USD 1.2 billion in 2025.
It is projected to reach USD 1.7 billion by 2035.
The market is expected to grow at a 3.0% CAGR between 2025 and 2035.
The key product types are paper and plastic.
label printer segment is expected to dominate with a 63.7% industry share in 2025.


Our Research Products

The "Full Research Suite" delivers actionable market intel, deep dives on markets or technologies, so clients act faster, cut risk, and unlock growth.

The Leaderboard benchmarks and ranks top vendors, classifying them as Established Leaders, Leading Challengers, or Disruptors & Challengers.

Locates where complements amplify value and substitutes erode it, forecasting net impact by horizon

We deliver granular, decision-grade intel: market sizing, 5-year forecasts, pricing, adoption, usage, revenue, and operational KPIs—plus competitor tracking, regulation, and value chains—across 60 countries broadly.

Spot the shifts before they hit your P&L. We track inflection points, adoption curves, pricing moves, and ecosystem plays to show where demand is heading, why it is changing, and what to do next across high-growth markets and disruptive tech

Real-time reads of user behavior. We track shifting priorities, perceptions of today’s and next-gen services, and provider experience, then pace how fast tech moves from trial to adoption, blending buyer, consumer, and channel inputs with social signals (#WhySwitch, #UX).

Partner with our analyst team to build a custom report designed around your business priorities. From analysing market trends to assessing competitors or crafting bespoke datasets, we tailor insights to your needs.
Supplier Intelligence
Discovery & Profiling
Capacity & Footprint
Performance & Risk
Compliance & Governance
Commercial Readiness
Who Supplies Whom
Scorecards & Shortlists
Playbooks & Docs
Category Intelligence
Definition & Scope
Demand & Use Cases
Cost Drivers
Market Structure
Supply Chain Map
Trade & Policy
Operating Norms
Deliverables
Buyer Intelligence
Account Basics
Spend & Scope
Procurement Model
Vendor Requirements
Terms & Policies
Entry Strategy
Pain Points & Triggers
Outputs
Pricing Analysis
Benchmarks
Trends
Should-Cost
Indexation
Landed Cost
Commercial Terms
Deliverables
Brand Analysis
Positioning & Value Prop
Share & Presence
Customer Evidence
Go-to-Market
Digital & Reputation
Compliance & Trust
KPIs & Gaps
Outputs
Full Research Suite comprises of:
Market outlook & trends analysis
Interviews & case studies
Strategic recommendations
Vendor profiles & capabilities analysis
5-year forecasts
8 regions and 60+ country-level data splits
Market segment data splits
12 months of continuous data updates
DELIVERED AS:
PDF EXCEL ONLINE
Understanding Market Share Trends in the Tipping Foils Industry
Coding Foils & Tapes Market Size and Share Forecast Outlook 2025 to 2035
Market Share Insights of Coding Foils & Tapes Providers
Flexible Lighting Foils Market
Metallic Hot Stamping Foils Market

Thank you!
You will receive an email from our Business Development Manager. Please be sure to check your SPAM/JUNK folder too.
Chat With
MaRIA