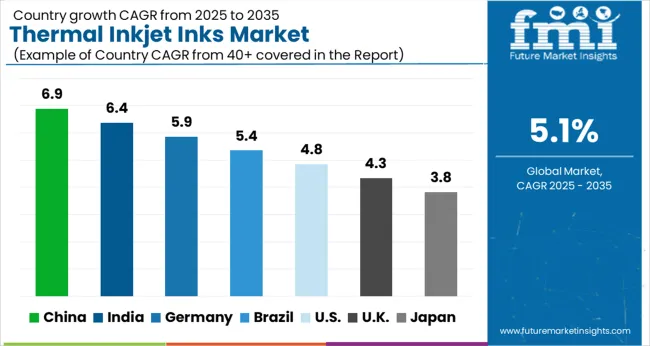
The Thermal Inkjet Inks Market is estimated to be valued at USD 1.3 billion in 2025 and is projected to reach USD 2.2 billion by 2035, registering a compound annual growth rate (CAGR) of 5.1% over the forecast period.
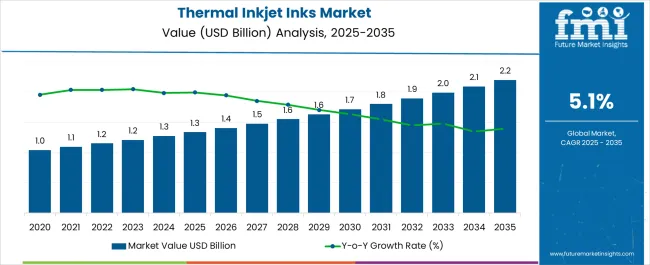
| Metric | Value |
|---|---|
| Thermal Inkjet Inks Market Estimated Value in (2025 E) | USD 1.3 billion |
| Thermal Inkjet Inks Market Forecast Value in (2035 F) | USD 2.2 billion |
| Forecast CAGR (2025 to 2035) | 5.1% |
The thermal inkjet inks market is progressing at a steady pace, driven by rising adoption of digital printing technologies and the demand for high-resolution, cost-efficient marking solutions across industries. Industry publications and company updates have highlighted the growing importance of thermal inkjet inks for variable data printing, traceability, and product authentication. The shift toward environmentally compliant, solvent-free, and water-based formulations has further enhanced adoption.
Continuous R&D efforts have resulted in inks capable of delivering superior adhesion and durability on diverse substrates, addressing the evolving needs of both industrial and commercial printing. Regulatory standards focusing on labeling and traceability in food, beverage, and pharmaceutical packaging have amplified the importance of thermal inkjet solutions. In addition, manufacturers are increasingly emphasizing sustainability, pushing innovations in biodegradable and low-VOC ink formulations.
Looking forward, market growth is expected to be supported by automation in industrial printing, rising packaging requirements, and the scalability of thermal inkjet printing in high-speed production lines. Segmental momentum is anticipated to be led by porous substrates, automotive packaging, and the food & beverage industry due to their reliance on durable, precise, and regulatory-compliant printing solutions.
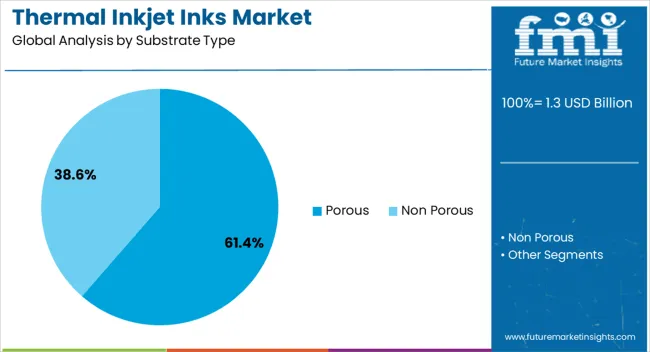
The porous substrate segment is projected to account for 61.4% of the thermal inkjet inks market revenue in 2025, retaining its leadership due to widespread use in paper-based and absorbent materials. Growth in this segment has been driven by strong demand for printing on packaging cartons, labels, and paperboard, where ink penetration and adhesion are critical. Porous substrates allow inks to dry quickly, enabling high-speed printing processes while maintaining image clarity and permanence.
Industry reports have underscored that porous substrates dominate in sectors requiring large-scale, cost-effective packaging and labeling solutions. Additionally, the compatibility of water-based inks with porous materials has provided an environmentally compliant and economical option for end users.
With expanding e-commerce, retail packaging, and product labeling regulations, the porous substrate segment is expected to sustain its dominant position in the market.
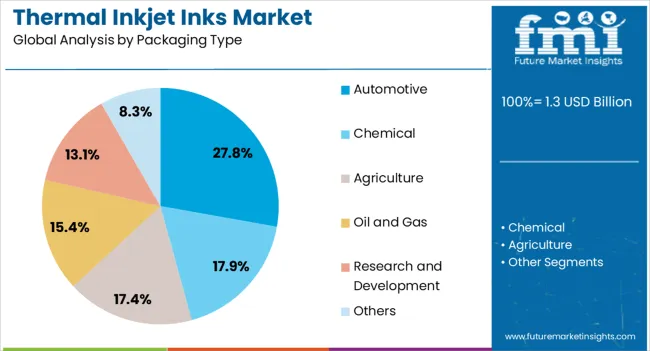
The automotive packaging segment is projected to contribute 27.8% of the thermal inkjet inks market revenue in 2025, positioning itself as a key area of demand. Growth in this segment has been influenced by the rising need for durable and high-precision printing solutions for automotive components and packaging. Manufacturers have emphasized coding and labeling for compliance, safety, and traceability, driving reliance on thermal inkjet inks.
Reports from industry associations have highlighted that the automotive sector requires inks with strong resistance to heat, solvents, and abrasion, ensuring legibility throughout the supply chain. Additionally, advancements in ink formulations have enabled superior adhesion on non-porous surfaces commonly used in automotive packaging.
As global automotive supply chains expand and regulatory compliance strengthens, the automotive packaging segment is expected to maintain consistent growth, supported by the need for permanent and reliable printing solutions.
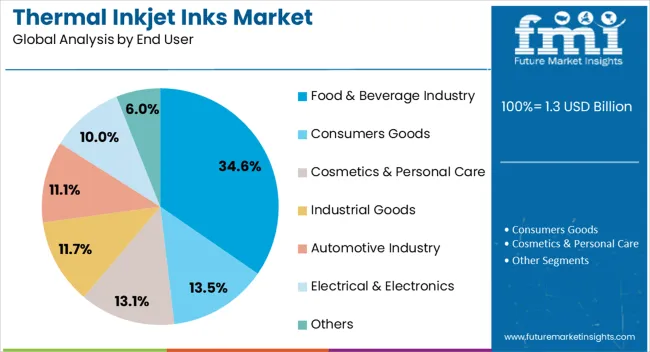
The food & beverage industry segment is projected to account for 34.6% of the thermal inkjet inks market revenue in 2025, making it the leading end-user category. Growth has been supported by strict regulatory standards for product labeling, traceability, and expiration date coding in food packaging. Thermal inkjet inks have been preferred for their ability to deliver precise, high-contrast prints on various packaging materials, ensuring compliance with food safety standards.
Industry updates have indicated that the growing consumption of packaged food and beverages has intensified demand for efficient and hygienic printing solutions. Moreover, the shift toward sustainable packaging has driven innovations in inks that are food-contact safe and environmentally responsible.
With increasing globalization of food supply chains and stricter labeling laws, the food & beverage industry segment is expected to remain at the forefront of demand for thermal inkjet inks, reinforcing its market leadership.
What are the Key Trends Driving Sales of Thermal Inkjet Inks?
North America recorded a 31% market share in the global thermal inkjet inks market in 2025. Several factors contribute to the market's growth in this region, such as the frantic lifestyles of consumers. There is a growing demand for ready-to-eat foods, which results in increasing on-the-go food consumption habits. This results in the packaging industry's expansion of thermal inkjet inks.
The surging need for printing inks from several industries, such as publishing, packaging, and textiles, continues to be in demand. Also, the invention of novel printing ink applications like screen printing, digital orienting, and specialty printing is anticipated to promote the growth of the North American thermal inkjet market.
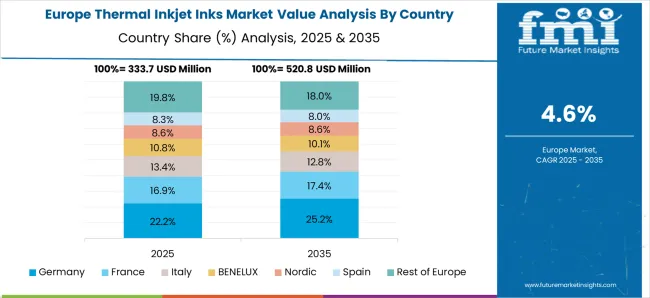
Europe's thermal inkjet inks market held a steady 22% market share in the global market in 2025. Swift growth in the advertisement industry, along with the growing need for enhanced printing with higher resolution and in a cost-effective manner, is predicted to promote the growth of the European market during the forecast years. The growing global packaging industry, coupled with swift operating speeds rendered by thermal inkjet printers, is likely to fuel the growth of thermal inkjet inks for the packaging industry. Also, the European market is quite fragmented, with significant local and regional players rendering several solutions for companies investing in the market arena.
Thermal inkjet printers are globally considered cost-efficient; therefore, several new market entrants are vouching to invest in this industry and compete with the existing players. Manufacturers stay invested in advanced technology to outperform their competitors. Thermal inkjet printing continues to generate a potential area of development for inkjet technology. Moreover, despite technological advancements, these printers are comparatively priced lower than other marking and coding technology. With further developments on improving overall ink systems for economic and environmental efficacy, market players strive to make a better and simpler coding and marking experience.
Key Players
The global thermal inkjet inks market is estimated to be valued at USD 1.3 billion in 2025.
The market size for the thermal inkjet inks market is projected to reach USD 2.2 billion by 2035.
The thermal inkjet inks market is expected to grow at a 5.1% CAGR between 2025 and 2035.
The key product types in thermal inkjet inks market are porous and non porous.
In terms of packaging type, automotive segment to command 27.8% share in the thermal inkjet inks market in 2025.


Full Research Suite comprises of:
Market outlook & trends analysis
Interviews & case studies
Strategic recommendations
Vendor profiles & capabilities analysis
5-year forecasts
8 regions and 60+ country-level data splits
Market segment data splits
12 months of continuous data updates
DELIVERED AS:
PDF EXCEL ONLINE
Thermal Interface Material Market Size and Share Forecast Outlook 2025 to 2035
Thermal Management Market Forecast and Outlook 2025 to 2035
Thermal Impulse Sealers Market Size and Share Forecast Outlook 2025 to 2035
Thermal Insulation Materials for Optical Fibers Market Size and Share Forecast Outlook 2025 to 2035
Thermal Insulation Material Market Size and Share Forecast Outlook 2025 to 2035
Thermal-Wet Gas Abatement System Market Size and Share Forecast Outlook 2025 to 2035
Thermal Spray Service Market Size and Share Forecast Outlook 2025 to 2035
Thermal Management Materials for EV Batteries Market Size and Share Forecast Outlook 2025 to 2035
Thermal Barrier Coatings Market Size and Share Forecast Outlook 2025 to 2035
Thermal Energy Harvesting Market Size and Share Forecast Outlook 2025 to 2035
Thermally Stable Antiscalant Market Size and Share Forecast Outlook 2025 to 2035
Thermal Spa and Wellness Market Size and Share Forecast Outlook 2025 to 2035
Thermal Mixing Valves Market Size and Share Forecast Outlook 2025 to 2035
Thermal Liner Market Analysis Size and Share Forecast Outlook 2025 to 2035
Thermal Insulation Coating Market Size and Share Forecast Outlook 2025 to 2035
Thermal Spray Equipment Market Size and Share Forecast Outlook 2025 to 2035
Thermal Spring Market Size and Share Forecast Outlook 2025 to 2035
Thermal Printing Market Analysis - Size, Share & Forecast 2025 to 2035
Thermal Transfer Roll Market Size and Share Forecast Outlook 2025 to 2035
Thermal Transfer Ribbon Market Growth - Demand & Forecast 2025 to 2035

Thank you!
You will receive an email from our Business Development Manager. Please be sure to check your SPAM/JUNK folder too.
Chat With
MaRIA