The Theme Park Market is estimated to be valued at USD 75.1 billion in 2025 and is projected to reach USD 124.7 billion by 2035, registering a compound annual growth rate (CAGR) of 5.2% over the forecast period.
The Theme Park market is experiencing strong growth, driven by increasing consumer demand for recreational and experiential entertainment across both developed and emerging markets. Rising disposable incomes, expanding urban populations, and growing interest in family-friendly leisure activities are supporting market expansion. The adoption of innovative attractions, advanced ride technologies, and immersive themed experiences is enhancing visitor engagement and satisfaction.
Investments in infrastructure development, safety measures, and digital integration, including ticketing and crowd management systems, are further shaping the market landscape. Seasonal events, live performances, and entertainment offerings are increasingly being used to attract diverse visitor segments and encourage repeat visits. The rising influence of social media and online marketing is amplifying brand visibility and consumer awareness, contributing to increased attendance.
As urbanization and tourism continue to grow, the market is expected to witness sustained expansion, with opportunities emerging from diversification of park offerings, international expansion, and adoption of advanced ride technologies The market is also benefiting from collaborative partnerships and licensing agreements with entertainment franchises, further reinforcing growth prospects.
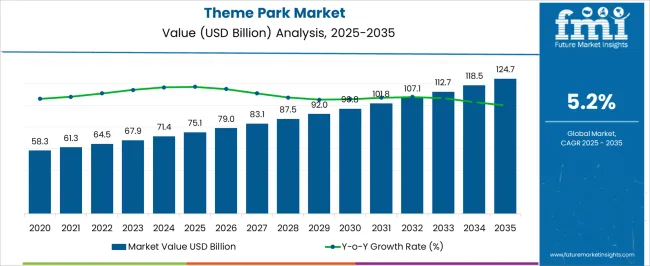
| Metric | Value |
|---|---|
| Theme Park Market Estimated Value in (2025 E) | USD 75.1 billion |
| Theme Park Market Forecast Value in (2035 F) | USD 124.7 billion |
| Forecast CAGR (2025 to 2035) | 5.2% |
The market is segmented by Type, Ride, Age-Group, and Revenue Source and region. By Type, the market is divided into Theme Parks, Water Parks, Adventure Parks, and Zoo Parks. In terms of Ride, the market is classified into Mechanical Rides, Water Rides, and Others. Based on Age-Group, the market is segmented into Up To 18 Years, 19 To 35 Years, 36 To 50 Years, 51 To 65 Years, and Above 65 Years. By Revenue Source, the market is divided into Tickets, Food & Beverage, Merchandise, Hotel & Resorts, and Others. Regionally, the market is classified into North America, Latin America, Western Europe, Eastern Europe, Balkan & Baltic Countries, Russia & Belarus, Central Asia, East Asia, South Asia & Pacific, and the Middle East & Africa.
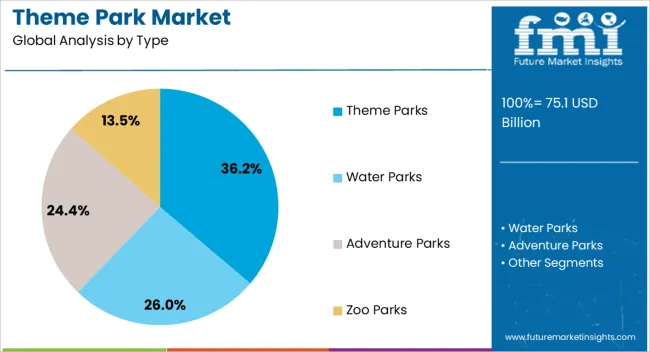
The theme parks segment is projected to hold 36.2% of the market revenue in 2025, positioning it as the leading type. Growth in this segment is being driven by the ability of theme parks to provide immersive, narrative-driven experiences that combine rides, shows, and themed environments. Visitors are attracted to interactive attractions and entertainment offerings that appeal to a wide audience, including families, teenagers, and tourists.
Investment in high-quality design, advanced ride systems, and safety protocols has increased consumer confidence and attendance. The modular and flexible design of theme parks allows for continuous addition of attractions, seasonal events, and technological innovations, enhancing visitor engagement.
Partnerships with intellectual property holders, including movie and game franchises, further support popularity and brand differentiation As consumer expectations for experiential entertainment continue to rise, theme parks are expected to maintain their leadership, supported by innovation, scalability, and a focus on multi-sensory immersive experiences.
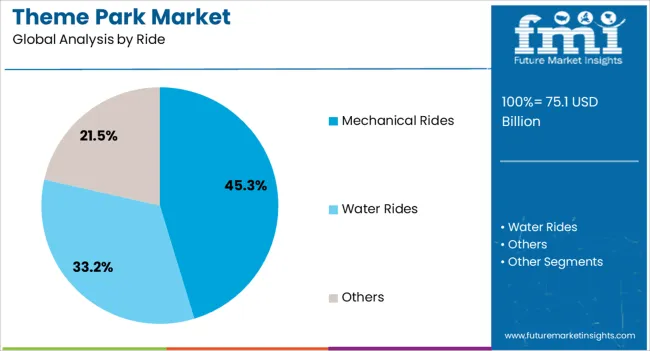
The mechanical rides segment is anticipated to account for 45.3% of the market revenue in 2025, making it the leading ride category. Growth is driven by the popularity of high-thrill, mechanically engineered rides that offer dynamic and interactive experiences for visitors. Roller coasters, spinning rides, and simulation-based attractions provide repeatable excitement and measurable entertainment value.
Safety and reliability improvements, coupled with innovative designs and immersive technologies, have increased consumer confidence and broadened adoption. Mechanical rides are particularly effective at attracting teenagers, young adults, and thrill-seekers, generating significant ticket revenue and driving park attendance. Operators are increasingly incorporating themed narratives, interactive elements, and sensory effects to enhance visitor engagement.
The scalability and adaptability of mechanical rides allow theme parks to update or expand their offerings efficiently, which supports long-term revenue growth As visitors increasingly seek adventurous and memorable experiences, mechanical rides are expected to remain a key driver of revenue in the theme park market.
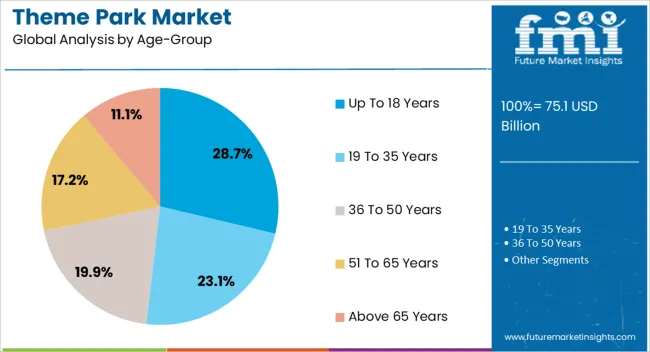
The up to 18 years age-group segment is expected to account for 28.7% of the market revenue in 2025, establishing it as the leading demographic. Growth is being driven by the high frequency of visits by children and teenagers, who are primary consumers of family-oriented entertainment experiences. Attractions, rides, and interactive zones are increasingly being designed to appeal to this age-group, combining safety with engagement and entertainment value.
Educational programs, edutainment attractions, and child-friendly rides have further enhanced adoption. Schools, family groups, and youth organizations are contributing to steady footfall, while seasonal promotions and birthday packages encourage repeat visits.
The integration of technology-driven experiences, such as augmented reality and gamified rides, has amplified interest among this demographic As parental spending on recreational activities rises and family-focused tourism grows, the up to 18 years age-group segment is expected to remain a significant contributor to market revenue, reinforcing the importance of targeted attractions and experiential offerings for younger visitors.
Emotional Experience
People nowadays are turning toward emotional experiences such as fun, happening, adventure, or excitement to develop a healthy mental state. People encapsulated in modern and unhealthy lifestyles are on the verge of degrading their mental and visible health.
Theme parks or amusement parks have the aura of positivity, calmness, and pure oxygen, and attraction spots indulge happy hormones and attract an emotional attachment to the place and the human mind. This gives memorial experiences, laughter, and what not to ride you through new emotional experiences. This shift is positively impacting market growth.
Environmental Relationship
Environmental relationships are of utmost importance with growing urbanization and fast-paced deforestation. People living in urban areas prefer taking holidays to immerse themselves in forests, flowing waters, and the sounds of animals. They also want their younger ones to know the importance of forests, zoological parks, and rides that make big giggles. So the theme park market, as a result, is hiking up with want for unique moments with family.
Branding Opportunities and Corporate incentives
Difference between absorption and immersion in tourism experiences is important. Customers seek experiences that engage their senses and deliver memorable moments. Short trips to theme parks and zoos from cooperate lives promise higher experience quality and reduce the risk of disappointments.
Cooperate companies have tie-ups and opportunities to visualize their brands in places like theme parks, zoos, and amusement parks to make a demographic appearance. Even employees get some discounts and incentives for moving out to such places, increasing the trend to explore such places.
Social Media Influence and Tech Advancement
Technology advancements and virtual reality trends have finely shaped the experience of theme parks and amusement parks. New and giant rides, multi-movie franchises, cinematic universes, globally popular shows, and animation series have added spice to human tendencies to explore such places.
With the vast expansion of social media platforms and influencers, people are diverted to discover more and more unresolved places worldwide. This has surged the tourism market growth along with related food and beverage, hotels, resorts, forest penthouse, and camping markets.
Causes Depreciating the Theme Park Rides Overtime
Theme parks require high initial investment costs. With increasing land and labor costs, it is difficult to maintain profitability; with new developments, the fares are high. Even the region and popularity define the total tour cost, which is not economical for the local public. Due to economic and political instabilities in certain regions, tourism declines, leading downtrend in the theme park market.
High competition from other leisure activities and entertainment options persist as they are more cost-effective. Changing consumer preferences and tastes make it challenging to keep up with current trends. Limited targeted audience, seasonal fluctuations, and safety concerns are other factors thwarting the theme park or waterpark market growth.
Mechanical rides are the top rides in the theme park market because they offer unparalleled excitement and pleasure that other rides can't match. With this pleasure rush, the mechanical rides are marking a CAGR of 5.0% through 2035.
| Attributes | Details |
|---|---|
| Rides | Mechanical Rides |
| CAGR (2025 to 2035) | 9.0% |
Thrill seekers and adrenaline junkies love this heart-pounding experience of mechanical rides. These rides are designed to provide riders with unforgettable experiences to remember lifetime. This pleasure adds to repeat it, increasing the market growth. From the high-speed roller coasters to the spinning teacups, mechanical rides offer a wide variety of attractions that cater to every age group and interest.
By investing in a top-quality and diverse range of mechanical rides to stand out and attract customers, theme parks can differentiate themselves from competitors, ultimately boosting their revenue.
Theme parks typically charge admission prices, which generates significant revenue. Tickets, the majority revenue source in the theme park market, to register for a CAGR of 4.8% from 2025 to 2035.
| Attributes | Details |
|---|---|
| Revenue Source | Tickets |
| CAGR (2025 to 2035) | 4.8% |
Tickets are a reliable source of income as they are already purchased and cannot be refunded. Ticket sales can help theme parks forecast attendance levels and plan staffing, inventory, and other operational needs to cater best service.
In some markets, like the United States, theme parks propose season passes that allow visitors to visit multiple times for a discounted rate, encouraging repeat visits and boosting revenue over time.
Multiple range of options and attractions, diverse consumer base with innovative technologies, and country-specific attractions make countries varied in aspects to the theme park market. Different geographical patterns and differences in the ecosystem make countries opt for their uniqueness.
| Countries | CAGR from 2025 to 2035 |
|---|---|
| Japan | 7.0% |
| South Korea | 6.8% |
| United Kingdom | 6.3% |
| China | 6.0% |
| United States | 5.5% |
Japan has remarkable space management, internationally recognized franchises, and charming locally themed attractions. Japan is emerging as a prominent player in the theme park market recording a CAGR of 7.0% through 2035.
Disney Resorts and Universal Studios maintain their craze among tourists. Places like Edo Wonderland Nikko Edomura keep the variety ever so diverse. With all these, Japan has larger world-famous theme park attractions showcasing a few world record-breaking roller coasters.
Tokyo Disneyland, Tokyo DisneySea, Fuji-Q Highland, Toei Kyoto Studio Park, Hokkaido, and Sanrio Puroland are among world-famous theme parks and decades-trapped tourist attractions. Tourism has a big scale on the Japanese theme park development market.
South Korea has always been known for its fascinating pop culture, impressive historical sites, varied cuisines, and tourist spots framed with uniquely adorable concepts. With so much to cover, South Korea to exhibit a CAGR of 6.8% through 2035.
Places like Everland, Lotte World, Seoul Land, Gyeongju World Amusement Park, E-World Daegu, Aiins World, and Eco Land Theme Park offer the best experience with base consumer experiences.
This all has an expanded area with luxurious stays and a plethora of customers winning the best in the tourism market. This, in turn, attracts tourists to pay for their memorable experiences. South Korea, known for its vibrant culture and technological development, also offers a myriad of fun experiences at its theme parks.
The United Kingdom has superb and innovative theme parks, from Lego to zoos. With a 6.3% CAGR from 2025 to 2035, the United Kingdom is on a roller coaster ride for expansion.
Among the country’s best amusement parks are Alton Towers, Legoland, Dreamland, Lightwater Valley Theme Park, Chessington World of Adventures, Blackpool Pleasure Beach, Flamingo Land Resort, and Oakwood Theme Park.
With variations like child-oriented theme parks, long-awaited Ghost Train rides, British seaside funfair, Zoos holding over 1,000 animals, and much more, the United Kingdom has covered. Thus it competes with other countries as they have lotto offer and people prefer moving to trip with many sightseeings at once.
China is acquiring a big consumer base, increasingly seeking interactive and immersive storytelling experiences. Displaying a CAGR of 6.0%, China is expanding in the theme park market with social media promoting tourist engagements.
Chinese operators are now introducing wearable and augmented reality (AR) or virtual reality (VR) technology to elevate tourist experiences. Chinese Hanfu attire to celebrate the spring festival in Shanghai captures visitors’ attention and has become a trending topic on social media, attracting the tourism sector.
An introduction of Greenfield Theme Parks is what China is looking forward to for the overall expansion of the tourism market. The famous Guangdong theme park, which offers a wild animal park, amusement park, water park, ocean park, and circuses, is one of the king attractions in China.
The United States theme park market is expected to ride a CAGR of 5.5% during the forecasted period. According to research, over 17 million visitors have visited the amusement park in the United States Magic Kingdom Theme Park at Walt Disney World Resort, located in Lake Buena Vista, Florida. This shows the ongoing growth of the overall tourism sector in the United States. The other hospitality and Food and beverages sectors are also a boon.
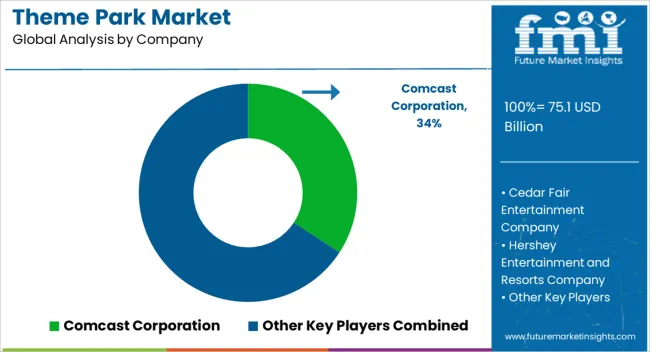
Disney has announced plans to build new theme parks in Asia and expand its existing parks in the United States. Universal Studios is also expanding its operations, with a new theme park set to open in Beijing in 2024.
Competition with big players, Six Flags is looking to expand its presence in Europe and the Middle East, while also investing in new rides and attractions at its existing parks. These efforts are aimed at capturing more market share and keeping up with the growing direction of theme park experiences around the world.
Recent Advancements
The global theme park market is estimated to be valued at USD 75.1 billion in 2025.
The market size for the theme park market is projected to reach USD 124.7 billion by 2035.
The theme park market is expected to grow at a 5.2% CAGR between 2025 and 2035.
The key product types in theme park market are theme parks, water parks, adventure parks and zoo parks.
In terms of ride, mechanical rides segment to command 45.3% share in the theme park market in 2025.


Full Research Suite comprises of:
Market outlook & trends analysis
Interviews & case studies
Strategic recommendations
Vendor profiles & capabilities analysis
5-year forecasts
8 regions and 60+ country-level data splits
Market segment data splits
12 months of continuous data updates
DELIVERED AS:
PDF EXCEL ONLINE
Theme Park Tourism Industry Analysis by Park Type, By Visitor Category, by Tourist Type, by Booking Channel, and by Region - Forecast for 2025 to 2035
Market Share Distribution Among Theme Park Tourism Providers
Theme Park Tourism Market
Competitive Overview of Animal Theme Parks Market Share
Animal Theme Parks Market Insights - Growth & Forecast 2025 to 2035
Parking Management Market Forecast and Outlook 2025 to 2035
Parking Meter Apps Market Size and Share Forecast Outlook 2025 to 2035
Parking Management Solutions Market Size and Share Forecast Outlook 2025 to 2035
Parking Finder Apps Market Size and Share Forecast Outlook 2025 to 2035
Parking Ticket Dispenser Market Growth, Trends & Forecast 2025 to 2035
Park Assist System Market Growth - Trends & Forecast 2025 to 2035
Parkinson’s Disease Therapeutic Market – Growth & Demand Forecast 2024-2034
Sparkling Bottled Water Market Growth - Demand & Trends 2025 to 2035
Spark Plug Market Growth – Trends & Forecast 2024 to 2034
Spark Plug Accessories Market
Water Parks Market Size and Share Forecast Outlook 2025 to 2035
Smart Parking Market Growth – Trends & Forecast through 2034
Iridium Spark Plug Market Size and Share Forecast Outlook 2025 to 2035
Vascular Parkinsonism Market Analysis - Size, Share, and Forecast Outlook 2025 to 2035
Real Time Parking System Market Growth - Trends & Forecast 2025 to 2035

Thank you!
You will receive an email from our Business Development Manager. Please be sure to check your SPAM/JUNK folder too.
Chat With
MaRIA