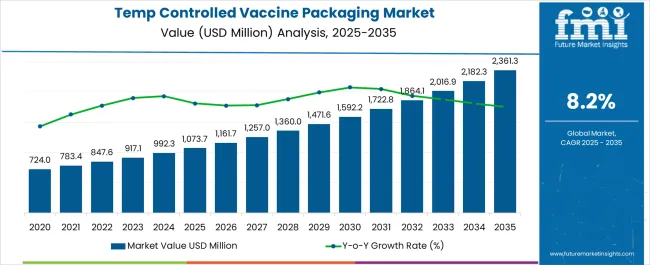
The Temperature Controlled Vaccine Packaging Market is estimated to be valued at USD 1073.7 million in 2025 and is projected to reach USD 2361.3 million by 2035, registering a compound annual growth rate (CAGR) of 8.2% over the forecast period.
| Metric | Value |
|---|---|
| Temperature Controlled Vaccine Packaging Market Estimated Value in (2025 E) | USD 1073.7 million |
| Temperature Controlled Vaccine Packaging Market Forecast Value in (2035 F) | USD 2361.3 million |
| Forecast CAGR (2025 to 2035) | 8.2% |
The temperature controlled vaccine packaging market is advancing steadily as global immunization initiatives expand and cold chain logistics become increasingly critical. Rising vaccination campaigns, coupled with the need to safeguard product integrity during long distance transportation, have reinforced the importance of reliable insulated solutions.
Stringent regulatory guidelines governing vaccine storage and distribution are further shaping packaging innovations. Advances in materials science, automation, and sensor based monitoring are strengthening real time quality assurance across the vaccine supply chain.
Growing adoption of digital traceability and eco friendly materials is also guiding industry development. The outlook remains strong as governments and healthcare organizations prioritize resilience in vaccine distribution networks and continued investment in cold chain infrastructure.
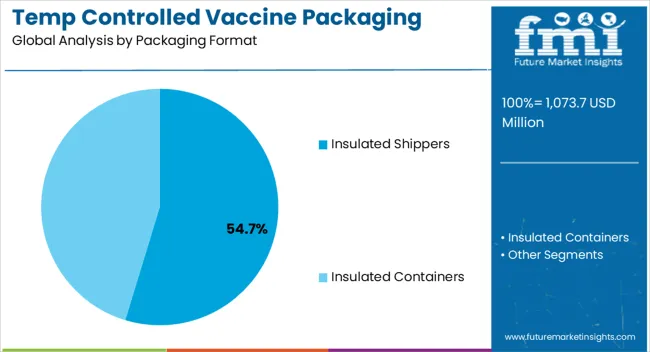
The insulated shippers segment is projected to hold 54.70% of the overall revenue by 2025 within the packaging format category, positioning it as the leading choice. This growth is being driven by their proven effectiveness in maintaining temperature stability, cost efficiency, and widespread availability across distribution channels.
Insulated shippers are designed for flexibility in handling both bulk and small shipment sizes, making them well suited for diverse vaccine distribution models. Their lightweight structure, combined with compatibility for passive cooling systems, has further improved their adoption across developed and developing markets.
As healthcare providers emphasize reliable and scalable cold chain packaging, insulated shippers have established themselves as the preferred solution.
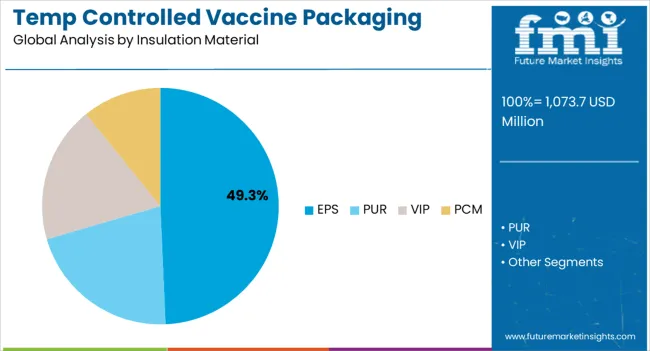
The EPS segment is expected to account for 49.30% of total market revenue within the insulation material category, making it the most prominent segment. Its dominance is supported by properties such as lightweight design, thermal resistance, and cost effectiveness.
EPS has been widely adopted in vaccine packaging as it enables consistent performance over extended durations while remaining economically viable for large scale distribution. Its recyclability and ability to be molded into varied designs have also contributed to its relevance in the industry.
As stakeholders aim to balance affordability with sustainability, EPS continues to represent the material of choice in vaccine cold chain solutions.
The active systems segment is projected to represent 44.80% of total revenue within the packaging system category by 2025, leading this area of the market. The growth is attributed to the increasing requirement for high performance solutions that can provide controlled temperature environments for extended periods.
Active systems are being adopted where long haul transportation and stringent temperature compliance are required, ensuring minimal risk of vaccine spoilage. Integration of advanced monitoring technologies, automated controls, and reusable system designs has further supported their widespread acceptance.
Their role in addressing global vaccine distribution challenges has reinforced the segment’s position as a cornerstone of innovation in cold chain packaging.
From 2020 to 2025, the global temperature controlled vaccine packaging market experienced a CAGR of 10.6%, reaching a market size of USD 1073.7 million in 2025.
Prior to COVID-19, the global temperature-controlled vaccine packaging industry grew steadily, owing to rising immunisation rates, improvements in healthcare infrastructure, and an emphasis on reducing vaccine spoiling.
The primary drivers of demand for temperature-controlled packaging solutions were routine immunisation programmes and targeted vaccination campaigns. However, the previous requirement for temperature-controlled vaccine packaging changed dramatically with the start of the COVID-19 pandemic.
The global temperature controlled vaccine packaging market outlook is distinguished by extraordinary growth potential. The COVID-19 pandemic has pushed the market to unprecedented heights, needing large-scale vaccine manufacture, distribution, and administration on a global scale.
The advent of COVID-19 vaccines with specific temperature needs, such as mRNA vaccines, has highlighted the critical importance of temperature-controlled packaging.
Forecast market growth is expected to be sustained as global immunisation efforts continue and governments prioritise the creation of robust cold chain infrastructure. Furthermore, the advent of new infectious illnesses, as well as a greater emphasis on preventative healthcare, are projected to fuel the market demand
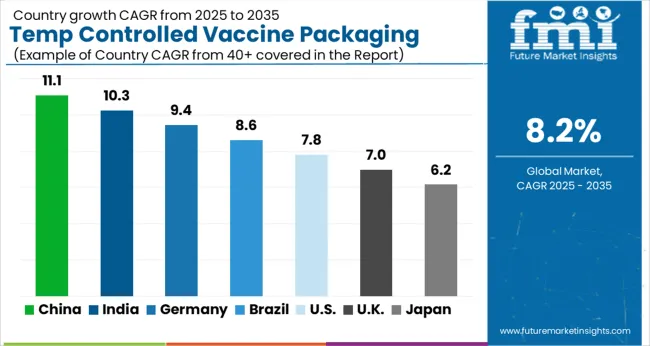
| Country | USA |
|---|---|
| Market Size (USD billion) by End of Forecast Period (2035) | USD 361.0 billion |
| CAGR % 2025 to End of Forecast (2035) | 6.8% |
The United States has significant growth potential in the global temperature controlled vaccine packaging market, as the country has a strong and advanced healthcare system that includes extensive vaccine research, development, and production capabilities.
The country's large cold chain infrastructure, well-established logistics networks, and high regulatory standards all contribute to the country's potential for growth.
With the continued emphasis on immunisation programmes and the requirement for temperature controlled vaccine delivery, demand for specialised packaging solutions in the United States is projected to rise.
| Country | China |
|---|---|
| Market Size (USD billion) by End of Forecast Period (2035) | USD 201.7 billion |
| CAGR % 2025 to End of Forecast (2035) | 8.5% |
As the world's most populous country, China has a significant demand for vaccines to suit its population's healthcare demands. China has made significant expenditures in temperature-controlled packaging solutions to ensure the efficacy and quality of its vaccines, as part of its strong focus on healthcare and research.
Chinese companies specialising in temperature controlled packaging have risen to prominence, offering a vast range of creative packaging solutions to meet the needs of various vaccines.
Furthermore, China's strategic actions to expand its cold chain logistics infrastructure and distribution networks have strengthened its position in the global temperature controlled vaccine packaging market.
| Country | India |
|---|---|
| Market Size (USD billion) by End of Forecast Period (2035) | USD 104.9 billion |
| CAGR % 2025 to End of Forecast (2035) | 9.8% |
Several significant factors contribute to India's strong market position in the worldwide temperature-controlled vaccine packaging industry. India has a comprehensive healthcare infrastructure as well as a network for vaccine manufacture and delivery.
As India's competence in medicines and healthcare, a vibrant ecosystem of temperature-controlled packaging companies has grown. The government's strong emphasis on immunisation programmes, as well as its commitment to improving healthcare access, drive demand for temperature controlled vaccine packaging solutions.
The insulated container segment is expected to dominate the temperature controlled vaccine packaging industry with a CAGR of 6.9% from 2025 to 2035. Insulated containers are an efficient alternative for guaranteeing vaccine integrity and efficacy by maintaining the proper temperature range during storage and transit.
These containers are built with innovative insulating materials that provide great thermal performance while shielding vaccinations from severe temperatures and temperature changes. Insulated containers provide improved temperature control over other packaging choices, making them appropriate for vaccines with special temperature requirements, such as ultra-low temperature vaccines.
Furthermore, many insulated containers have advanced monitoring and tracking technology, such as built-in data loggers or IoT sensors, which enable real-time temperature monitoring and ensure adherence to required temperature settings.
Insulated containers' versatility, dependability, and durability make them a favoured choice for pharmaceutical firms, healthcare organisations, and logistics providers, resulting in the segment's significant market share in the global temperature-controlled vaccine packaging market.
The diagnostic center is expected to dominate the temperature controlled vaccine packaging industry with a CAGR of 7.2% from 2025 to 2035. Diagnostic centres are playing an important role in driving the worldwide temperature controlled vaccine packaging market. Diagnostic centres are in charge of a variety of medical tests, including those connected to vaccine administration, such as antibody tests and pre-vaccination screenings.
As the demand for diagnostic services grows, diagnostic centres will need temperature-controlled packaging solutions to properly transport specimens, samples, and vaccines while maintaining their integrity. As a result, there is an increasing demand for packaging options that can successfully preserve vaccines' temperature-sensitive nature throughout transit.
As the demand for effective and dependable packaging solutions in diagnostic settings grows, collaboration between packaging providers and diagnostic centres is driving the expansion of the temperature controlled vaccine packaging market.
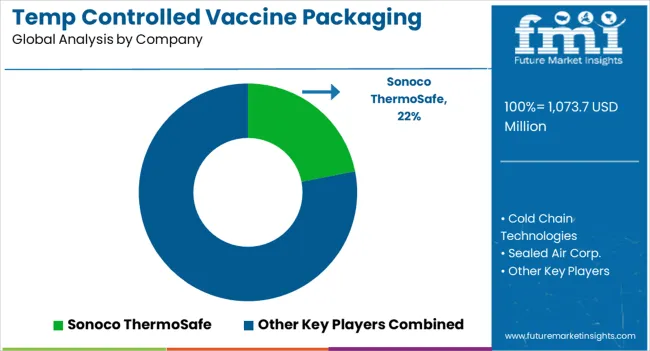
To maintain a competitive edge in the highly competitive worldwide temperature-controlled vaccine packaging market, market players adopt a variety of techniques. One important method is to keep up with technology changes. Companies spend in R&D to include cutting-edge technologies into their packaging solutions.
This might include the incorporation of Internet of Things (IoT) sensors for real-time temperature monitoring, smart packaging features, and the use of new insulating materials with increased thermal performance. Market players in the global temperature-controlled vaccine packaging market maintain their competitiveness through technological developments, customisation, adaptability, regulatory compliance, sustainability initiatives, cooperation and partnerships, as well as continuous improvement and customer support.
Companies can differentiate themselves in the market, attract clients, and drive their success in this constantly increasing business by implementing these methods.
Key strategies in Temperature Controlled Vaccine Packaging Market:
Product Innovation
Product innovation is critical in propelling the worldwide temperature-controlled vaccine packaging market ahead, with firms always finding new and innovative solutions to match the industry's increasing needs. Companies are creating packaging that is user-friendly, efficient, and simple to use.
This includes features like as ergonomic handles, secure closures, and user-friendly packing systems that improve vaccine handling and storage. Such advancements help to improve the overall efficiency and dependability of the temperature-controlled vaccine packaging process.
Customization:
Size and configuration options, temperature control capabilities, branding and labelling customization, integration of additional features, and alignment with clients' supply chain processes are all examples of customization in the global temperature controlled vaccine packaging market.
Companies that provide tailored packaging solutions ensure that vaccines are kept, transported, and distributed in a way that suits the individual needs of each client, eventually contributing to the safe and successful distribution of vaccines worldwide.
Sustainability:
Sustainability is becoming a significant concern in the global temperature-controlled vaccine packaging market, as companies attempt to reduce environmental impact and meet rising demand for environmentally friendly practises.
The use of recyclable and biodegradable materials, optimisation of packaging design, adoption of reusable packaging solutions, integration of energy-efficient technologies, and collaboration for sustainable supply chain practises all contribute to sustainability in the global temperature-controlled vaccine packaging market.
Companies that prioritise sustainability help to preserve the environment, limit waste output, and promote the long-term survival of the global healthcare industry.
Strategic Expansion:
Strategic expansion, the construction of manufacturing and distribution facilities, mergers and acquisitions, strategic alliances and collaborations, and product diversification are all examples of strategic expansion in the worldwide temperature-controlled vaccine packaging market.
Companies may embrace new possibilities, increase their competitiveness, and capitalise on the growing need for temperature-sensitive packaging solutions in the global healthcare business by implementing these methods.
The global temperature controlled vaccine packaging market is estimated to be valued at USD 1,073.7 million in 2025.
The market size for the temperature controlled vaccine packaging market is projected to reach USD 2,361.3 million by 2035.
The temperature controlled vaccine packaging market is expected to grow at a 8.2% CAGR between 2025 and 2035.
The key product types in temperature controlled vaccine packaging market are insulated shippers and insulated containers.
In terms of insulation material, eps segment to command 49.3% share in the temperature controlled vaccine packaging market in 2025.


Full Research Suite comprises of:
Market outlook & trends analysis
Interviews & case studies
Strategic recommendations
Vendor profiles & capabilities analysis
5-year forecasts
8 regions and 60+ country-level data splits
Market segment data splits
12 months of continuous data updates
DELIVERED AS:
PDF EXCEL ONLINE
Temperature Monitoring Device Market Size and Share Forecast Outlook 2025 to 2035
Temperature and Freshness Sensors Market Size and Share Forecast Outlook 2025 to 2035
Temperature Detection Screen Market Size and Share Forecast Outlook 2025 to 2035
Temperature Loggers Market Size, Share & Forecast 2025 to 2035
Temperature Transmitter Market Growth - Trends & Forecast 2025 to 2035
Temperature Sensors Market Growth - Trends & Forecast 2025 to 2035
Temperature Sensing Foley Catheter Market
Temperature Calibrator Market
Temperature Controlled Pharmaceutical Container Market Analysis, Size, Share & Forecast 2024 to 2034
Temperature Controlled Packaging Solution Market - Size, Share, and Forecast Outlook 2025 to 2035
Market Share Breakdown of Temperature Controlled Packaging Solutions
Temperature Controlled Packaging Boxes Market
Temperature Controlled Pharma Packaging Market Size, Share & Forecast 2025 to 2035
Temperature Controlled Pharmaceutical Packaging Market Trends, Growth, Forecast 2024-2034
5G Temperature-Compensated Crystal Oscillator (TCXO) Market Size and Share Forecast Outlook 2025 to 2035
Low Temperature Radiators Market Size and Share Forecast Outlook 2025 to 2035
Low Temperature Commercial Boiler Market Size and Share Forecast Outlook 2025 to 2035
Low Temperature Insulation Materials Market Size and Share Forecast Outlook 2025 to 2035
RTD Temperature Sensors Market Growth - Trends & Forecast 2025 to 2035
High Temperature Grease Market Size and Share Forecast Outlook 2025 to 2035

Thank you!
You will receive an email from our Business Development Manager. Please be sure to check your SPAM/JUNK folder too.
Chat With
MaRIA