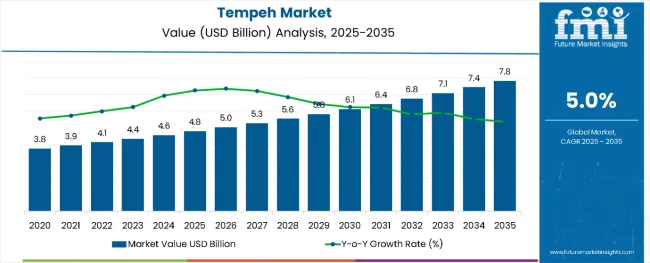
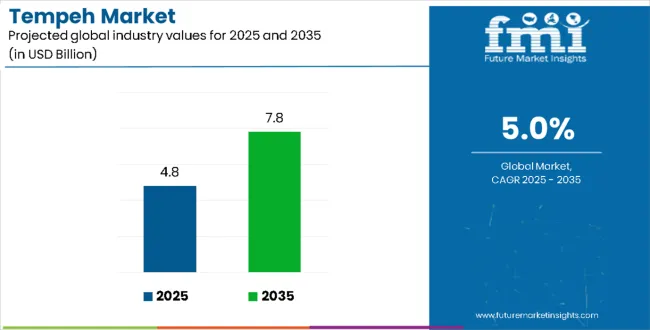
The global tempeh market is projected to grow from USD 4.8 billion in 2025 to approximately USD 7.8 billion by 2035, recording an absolute increase of USD 3.0 billion over the forecast period. This translates into a total growth of 62.5%, with the market forecast to expand at a compound annual growth rate (CAGR) of 5.0% between 2025 and 2035. The overall market size is expected to grow by nearly 1.63X during the same period, supported by the rising demand for plant-based protein alternatives and increasing consumer awareness about the health benefits of fermented foods.
Tempeh Market Key Takeaways
| Metric | Value |
|---|---|
| Tempeh Market Value (2025) | USD 4.8 billion |
| Tempeh Market Forecast Value (2035) | USD 7.8 billion |
| Tempeh Market Forecast CAGR | 5.0 |
Between 2020 and 2025, the Tempeh market experienced accelerated growth, driven by the global shift toward plant-based eating and increased interest in traditional fermented foods. The market developed significantly as consumers sought protein alternatives that offer both nutritional benefits and environmental sustainability advantages. Rising health consciousness and expanding distribution through natural food stores and mainstream supermarkets contributed substantially to market development during this foundational period.
Between 2025 and 2030, the Tempeh market is projected to expand from USD 4.8 billion to USD 6.1 billion, resulting in a value increase of USD 1.3 billion, which represents 43.3% of the total forecast growth for the decade. This phase of growth will be shaped by rising adoption of plant-based diets, increasing consumer awareness about fermented foods' health benefits, and expanding availability through mainstream retail channels. Food manufacturers are developing innovative tempeh formulations to appeal to diverse consumer preferences and dietary requirements across multiple market segments.
From 2030 to 2035, the market is forecast to grow from USD 6.1 billion to USD 7.8 billion, adding another USD 1.7 billion, which constitutes 56.7% of the overall ten-year expansion. This period is expected to be characterized by product innovation in flavoring and processing techniques, expansion into new geographic markets, and increasing integration into foodservice operations. The growing emphasis on sustainable protein sources and clean-label products will drive demand for premium tempeh formulations and specialized manufacturing expertise.
Market expansion is being supported by the increasing consumer shift toward plant-based protein sources and growing awareness of tempeh's exceptional nutritional profile, including high protein content, probiotics, and essential amino acids. Tempeh offers unique fermentation benefits that enhance digestibility and bioavailability of nutrients while providing sustainable protein alternatives to meat products. The traditional Indonesian food's versatility in cooking applications and ability to absorb flavors makes it appealing to diverse culinary preferences and dietary requirements.
The expanding health-conscious consumer base and increasing recognition of tempeh's role in supporting digestive health through beneficial bacteria are driving market growth across multiple demographics. Food manufacturers are developing innovative tempeh products that cater to mainstream tastes while preserving traditional fermentation benefits. The growing foodservice adoption and restaurant menu integration are creating additional demand as chefs discover tempeh's culinary versatility and nutritional advantages in plant-based menu development.
The market segments include source, nature, flavor, product type, distribution channel, and region. The source segment covers soybean, multi-grain, and others such as (lentils, chickpeas, and mixed grains). The nature segment includes organic and conventional. The flavor segment comprises plain and herbs & spices. The product type segment includes frozen, fresh, ready-to-eat, and others such as (fermented or flavored variants). The distribution channel segment covers direct, retail (hypermarkets/supermarkets, convenience stores, food & drink specialty stores, traditional groceries, online retailers), and others such as (subscription meal kits and e-commerce specialty platforms). The regional segment includes North America, Latin America, Western Europe, Eastern Europe, South Asia and Pacific, East Asia, and the Middle East & Africa.
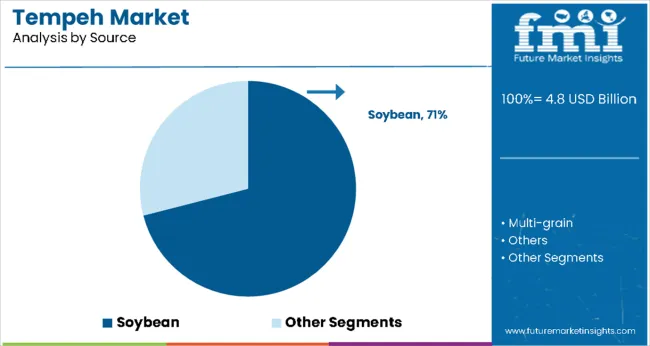
Soybean-based tempeh is projected to account for 71% of the tempeh market in 2025. This leading share is supported by soybeans' optimal fermentation characteristics and traditional use in authentic tempeh production methods. Soybean tempeh provides complete protein profiles with all essential amino acids, making it highly valued among health-conscious consumers and plant-based diet followers. The segment benefits from established supply chains, proven fermentation processes, and widespread consumer familiarity with soybean-based products in the plant protein market.
The dominance of soybean tempeh reflects its superior nutritional density and fermentation properties that create the characteristic nutty flavor and firm texture associated with traditional tempeh products. Soybeans offer ideal substrate conditions for Rhizopus oligosporus fermentation, producing consistent quality and flavor profiles that meet consumer expectations. Modern soybean tempeh production utilizes both organic and conventional soybeans to serve diverse market segments, with organic variants commanding premium prices among health-focused consumers. The segment's continued growth is supported by sustainable soybean sourcing initiatives and development of non-GMO formulations that appeal to environmentally conscious consumers. Additionally, soybean tempeh's versatility in culinary applications from grilling and stir-frying to crumbling for meat substitutes makes it the preferred choice for both home cooking and foodservice operations seeking reliable plant-based protein ingredients.
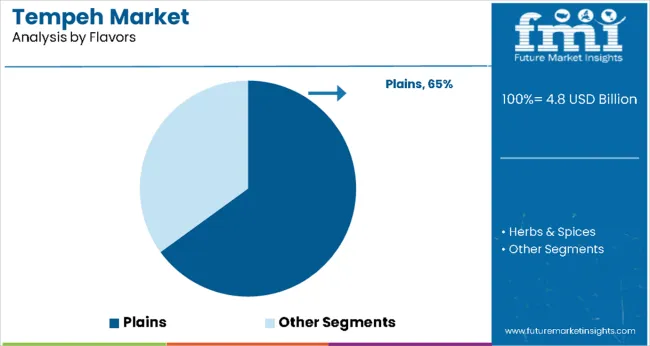
Plain tempeh is expected to represent 65% of tempeh flavor demand in 2025. This dominant share reflects consumer preference for versatile, unflavored tempeh that can be seasoned and prepared according to individual taste preferences and recipe requirements. Plain tempeh maintains the authentic fermented flavor profile while allowing maximum culinary flexibility for home cooks and professional chefs who prefer to control seasoning and flavor development. The segment benefits from widespread acceptance among traditional tempeh consumers and newcomers who appreciate the product's natural taste characteristics.
Plain tempeh's market leadership demonstrates its fundamental role as a culinary ingredient rather than a processed food product, appealing to consumers who value minimal processing and ingredient transparency. The unflavored format allows for maximum versatility in cooking applications, from marinades and sauces to integration into complex recipes where tempeh absorbs surrounding flavors. Premium plain tempeh products emphasize traditional fermentation methods and high-quality ingredient sourcing that preserve authentic taste and texture characteristics. The segment's growth is supported by increasing consumer interest in whole food ingredients and clean-label products that avoid artificial flavoring or excessive processing. Additionally, plain tempeh serves as the foundation for custom flavor development in foodservice applications where chefs create signature dishes and unique flavor profiles that differentiate their plant-based menu offerings.
The Tempeh market is advancing steadily due to rising plant-based diet adoption and increasing awareness of fermented foods' health benefits. However, the market faces challenges including limited consumer familiarity outside traditional markets, competition from other plant proteins, and maintaining product quality during distribution. Product innovation in flavoring and packaging continues to influence consumer acceptance and market development patterns.
Expansion of Mainstream Retail Distribution and Product Accessibility
The growing integration of tempeh products into mainstream grocery chains and supermarket refrigerated sections is enabling wider consumer access beyond natural food stores and specialty retailers. Improved packaging technologies and extended shelf-life formulations allow tempeh to reach broader geographic markets while maintaining product quality and freshness. These distribution improvements are particularly valuable for introducing tempeh to consumers unfamiliar with fermented plant proteins while providing convenient access for existing users in diverse retail environments.
Innovation in Flavored Varieties and Ready-to-Eat Formulations
Modern tempeh manufacturers are developing flavored varieties and pre-seasoned products that appeal to convenience-oriented consumers while maintaining traditional fermentation benefits. Innovation includes herb-infused tempeh, spiced varieties, and ready-to-cook formulations that reduce preparation time and cooking complexity. Advanced flavoring techniques also support development of region-specific taste profiles that cater to local culinary preferences while introducing tempeh to new consumer demographics seeking convenient plant protein options.
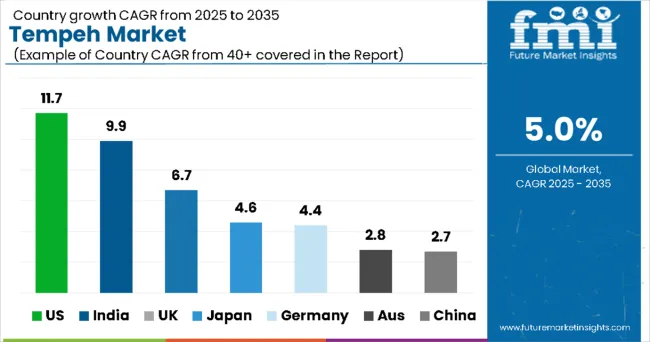
| Country | CAGR |
|---|---|
| USA | 11.7% |
| India | 9.9% |
| UK | 6.7% |
| Japan | 4.6% |
| Germany | 4.4% |
| Australia | 2.8% |
| China | 2.7% |
The tempeh market is growing steadily, with the United States leading at an 11.7% CAGR through 2035, supported by the strong plant-based food movement, advanced retail infrastructure, and increasing foodservice adoption. India follows at 9.9%, benefiting from cultural familiarity with fermented foods, a large vegetarian population, and rising health awareness in urban centers. The United Kingdom grows at 6.7%, reflecting its leadership in Europe with strong veganism trends and sustainable protein demand.
Japan records a 4.6% CAGR, aligned with traditional soy consumption and innovation in premium plant-based products. Germany demonstrates steady growth at 4.4%, supported by high health consciousness, strong organic retail channels, and sustainability-driven consumer preferences. Australia expands at 2.8%, driven by increasing health awareness, multicultural food culture, and rising plant-based adoption. China shows moderate growth at 2.7%, supported by traditional soy product familiarity, urbanization trends, and increasing exposure to international plant-based diets.
The report covers an in-depth analysis of 40+ countries; seven top-performing markets are highlighted below.
Demand for tempeh in the United States is projected to exhibit strong growth at 11.7% CAGR through 2035, driven by the country's robust plant-based food movement and increasing mainstream acceptance of alternative protein sources. American consumers demonstrate growing interest in fermented foods and their digestive health benefits, creating significant demand for tempeh products across retail and foodservice channels. The expanding flexitarian population and health-conscious millennials are driving adoption of tempeh as a versatile protein source that supports both environmental and personal wellness goals.
The United States' advanced retail infrastructure and sophisticated food distribution networks enable wide tempeh availability across diverse geographic markets and consumer demographics. The country's innovation culture supports development of new tempeh varieties and convenient product formulations that appeal to busy lifestyles while maintaining nutritional benefits.
Revenue from tempeh in India is expanding at 9.9% CAGR, supported by the country's traditional appreciation for fermented foods and growing awareness of tempeh's nutritional benefits. India's large vegetarian population and cultural familiarity with plant-based proteins create natural market acceptance for tempeh products. The country's rising health consciousness and increasing disposable income among urban consumers support market development across multiple demographic segments and geographic regions.
India's established fermentation food culture and growing interest in international plant-based foods enable tempeh market growth through both traditional and modern retail channels. The country's expanding organized retail sector and increasing exposure to global food trends create opportunities for tempeh manufacturers to serve diverse consumer preferences.
Revenue from tempeh in the United Kingdom is projected to grow at 6.7% CAGR, driven by the country's strong veganism movement and increasing consumer interest in sustainable protein alternatives. UK consumers demonstrate sophisticated understanding of plant-based nutrition and growing appreciation for fermented foods' health benefits. The country's advanced plant-based retail market and mainstream supermarket commitment to alternative proteins create consistent demand for diverse tempeh product varieties.
The United Kingdom's emphasis on environmental sustainability and animal welfare aligns with tempeh's positioning as an eco-friendly protein source. The country's culinary innovation culture and chef-driven plant-based menu development support tempeh adoption in both retail and foodservice applications.
Revenue from tempeh in Japan is expanding at 4.6% CAGR, supported by the country's traditional appreciation for fermented foods and growing interest in plant-based protein alternatives. Japanese consumers demonstrate natural affinity for tempeh due to cultural familiarity with fermented soy products and traditional dietary emphasis on plant proteins. The country's aging population and increasing health consciousness create demand for nutritious, easily digestible protein sources that support overall wellness goals.
Japan's technological leadership in food processing and quality control enables development of premium tempeh products that meet stringent Japanese quality standards. The country's sophisticated food culture and consumer willingness to pay premium prices for quality support development of artisanal and specialty tempeh varieties.
Demand for tempeh in Germany is projected to grow at 4.4% CAGR, supported by the country's strong health consciousness and commitment to sustainable food choices. German consumers demonstrate increasing interest in plant-based proteins and fermented foods that support digestive health and environmental sustainability. The country's advanced organic food market and quality-focused retail environment create demand for premium tempeh products that meet stringent quality and sustainability standards.
Germany's leadership in sustainable agriculture and environmental consciousness influences consumer preferences toward eco-friendly protein sources. The country's sophisticated food manufacturing capabilities and quality control systems support development of consistent, high-quality tempeh products that appeal to health-conscious consumers.
Demand for tempeh in Australia is expanding at 2.8% CAGR, driven by increasing health awareness and growing acceptance of Asian-inspired foods among Australian consumers. The country's multicultural food culture and growing plant-based movement create opportunities for tempeh adoption across diverse consumer segments. Australia's established natural food retail channels and increasing mainstream supermarket presence support market development through improved product accessibility.
Australia's emphasis on healthy lifestyle choices and outdoor living culture aligns with tempeh's positioning as a nutritious, sustainable protein source. The country's growing foodservice sector and chef-driven culinary innovation create additional demand for tempeh in restaurant and café applications.
Revenue from tempeh in China is projected to grow at 2.7% CAGR, supported by increasing health consciousness and growing exposure to international plant-based foods. China's traditional soy product culture and established fermentation food knowledge provide foundation for tempeh market development. The country's expanding middle class and increasing disposable income create opportunities for premium protein alternatives that offer health and convenience benefits.
China's massive population and growing urbanization trends create significant market potential for tempeh as both traditional fermented food and modern plant protein alternative. The country's advancing retail infrastructure and increasing international food exposure support market development across major metropolitan areas.
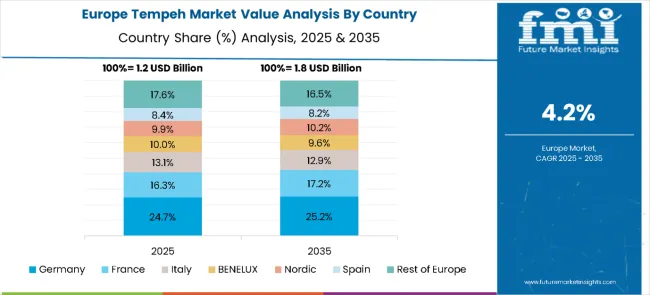
The tempeh market in Europe is projected to grow from USD 1.2 billion in 2025 to USD 1.8 billion by 2035, registering a CAGR of 4.2% over the forecast period. Germany is expected to lead with a 24.7% share in 2025, followed by France at 16.3%, supported by the growing popularity of plant-based proteins and meat alternatives. Italy accounts for 13.1% of the market, while BENELUX represents 10.0% and the Nordic countries hold 9.9%. Spain contributes 8.4%, and the Rest of Europe collectively makes up 17.6%. By 2035, Germany will further strengthen its lead to 25.2%, France will increase to 17.2%, and Italy will slightly decline to 12.9%. BENELUX and the Nordic region are projected at 10.2% and 9.6%, respectively, while Spain will hold 8.2%, and the Rest of Europe will adjust to 16.5%, signaling continued consolidation of demand in Western Europe’s key plant-based protein markets.
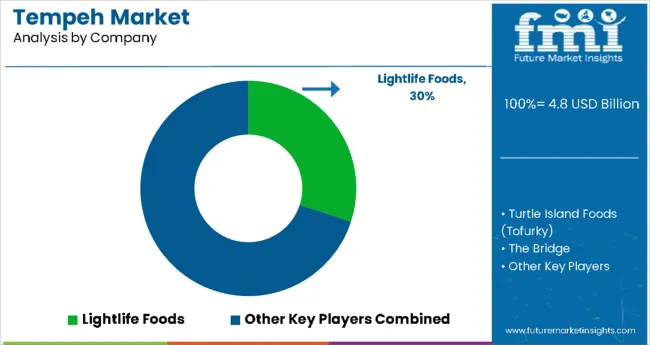
The tempeh market is moderately fragmented, comprising a combination of established plant-based food manufacturers, specialty fermented food producers, and innovative health-oriented brands competing to capture share in the rapidly expanding plant-based protein sector. Key players are focusing on product innovation, clean-label formulations, and geographic expansion to strengthen their market positions and cater to a growing consumer base seeking sustainable, high-protein meat alternatives.
Market participants are investing in advanced fermentation techniques, non-GMO and organic ingredient sourcing, and flavor diversification to align with evolving consumer expectations around health, sustainability, and convenience. Distribution strategies emphasize integration into mainstream retail channels, foodservice partnerships, and e-commerce platforms to maximize accessibility and brand visibility across both mature and emerging markets.
Lightlife Foods leads the market with its extensive portfolio of organic and non-GMO tempeh products, strong retail presence across North America, and continued investment in flavor innovation and clean-label offerings. Turtle Island Foods (Tofurky) emphasizes ethical sourcing, sustainability, and versatile tempeh formulations designed for retail and foodservice. The Bridge and Hain Celestial differentiate through their European focus and premium health positioning, targeting wellness-conscious consumers through natural food channels and international distribution networks.
Nutrisoy Pty Ltd plays a key role in the Asia-Pacific region, combining traditional fermentation expertise with modern packaging and product development for growing markets such as Australia and Southeast Asia. Smaller and emerging players are capitalizing on regional demand trends, ethnic food familiarity, and local sourcing strategies to enter niche markets and innovate with region-specific flavors and formats.
| Items | Values |
|---|---|
| Quantitative Units (2025) | USD 7.8 Billion |
| Source | Soybean, Multi-grain, Others |
| Nature | Organic and Conventional |
| Flavors | Plain, Herbs & Spices |
| Product Type | Frozen, Fresh, and Ready-to-eat |
| Distribution Channel | Direct, Retail (Hypermarkets/Supermarkets, Convenience Stores, Food & Drink Specialty Stores, Traditional Groceries, Online Retailers) |
| Regions Covered | United States, India, United Kingdom, Japan, Germany, Australia, China |
| Countries Covered | United States, India, United Kingdom, Japan, Germany, Australia, China |
| Key Companies Profiled | Lightlife Foods, Turtle Island Foods (Tofurky), The Bridge, Hain Celestial, Nutrisoy Pty Ltd |
| Additional Attributes | Dollar sales by source/flavor, regional demand (key markets), competition among plant-based leaders, consumer preference (traditional vs flavored), retail/foodservice integration, fermentation/packaging innovations, and organic non-GMO adoption for sustainable protein |
The tempeh market is estimated to secure a valuation of USD 4.8 billion in 2025.
The global market is analyzed to expand at a CAGR of 5.0% through 2035.
The United States is expected to acquire 11.7% from the overall market share.
Heightened demand for healthier packaged options is a running trend in the market.
Increasing proliferation of tempeh in multiple distribution channels is enhancing the market scope.


Full Research Suite comprises of:
Market outlook & trends analysis
Interviews & case studies
Strategic recommendations
Vendor profiles & capabilities analysis
5-year forecasts
8 regions and 60+ country-level data splits
Market segment data splits
12 months of continuous data updates
DELIVERED AS:
PDF EXCEL ONLINE

Thank you!
You will receive an email from our Business Development Manager. Please be sure to check your SPAM/JUNK folder too.
Chat With
MaRIA