The Telemedicine Equipment Market is estimated to be valued at USD 6.6 billion in 2025 and is projected to reach USD 32.7 billion by 2035, registering a compound annual growth rate (CAGR) of 17.3% over the forecast period.
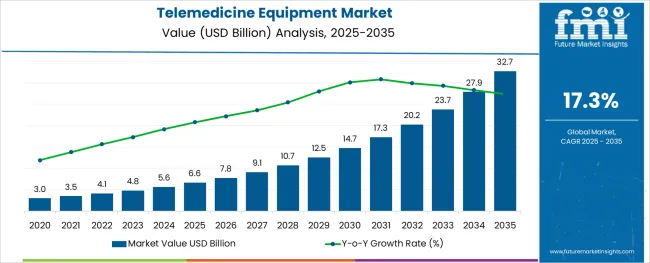
The telemedicine equipment market is witnessing accelerated growth driven by increased demand for remote healthcare delivery, rising adoption of digital health technologies, and continued investment in virtual care infrastructure. The expansion of broadband connectivity, government-led telehealth reimbursement programs, and growing physician acceptance have created a strong foundation for equipment deployment across urban and rural settings.
Healthcare systems are increasingly investing in scalable solutions that support secure video consultation, remote diagnostics, and data integration with electronic health records. Technological advancements in high-definition imaging, mobile monitoring tools, and IoT-enabled diagnostic devices are enhancing the quality of virtual patient interactions.
Looking ahead, the market is expected to benefit from the convergence of AI-driven analytics, real-time vitals tracking, and hospital-at-home care models. These innovations are improving care outcomes, reducing operational costs, and meeting the growing preference for contactless, on-demand healthcare.
The market is segmented by Product Type and End-Use and region. By Product Type, the market is divided into Telemedicine Cart, Telemedicine Kit, Telemedicine Kiosk, and Peripherals. In terms of End-Use, the market is classified into Hospitals, Clinics, Specialty centers, Home care settings, and Others.
Regionally, the market is classified into North America, Latin America, Western Europe, Eastern Europe, Balkan & Baltic Countries, Russia & Belarus, Central Asia, East Asia, South Asia & Pacific, and the Middle East & Africa.
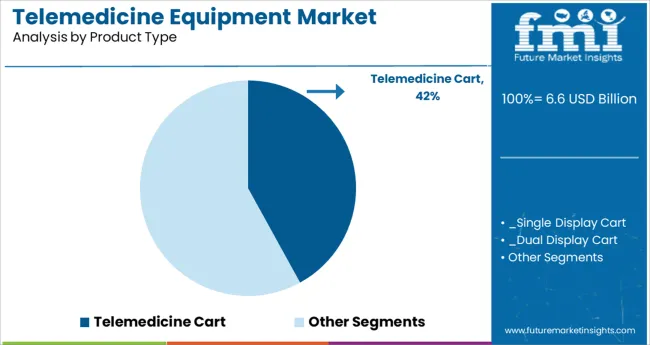
The telemedicine cart segment is projected to hold 42.0% of the total revenue in the telemedicine equipment market by 2025, making it the leading product type. This leadership is being driven by its multifunctional design, which integrates video conferencing, medical imaging, and diagnostic tools into a single mobile platform.
These carts are being adopted widely due to their ability to support clinical mobility, especially in hospital wards, intensive care units, and emergency departments. Enhanced with antimicrobial surfaces, secure data ports, and adjustable configurations, telemedicine carts have become central to hybrid care models.
Their role in facilitating specialist consultations, improving triage response, and streamlining inpatient workflows has reinforced their prominence. As healthcare institutions standardize virtual care infrastructure, demand for versatile, interoperable equipment such as telemedicine carts continues to rise.
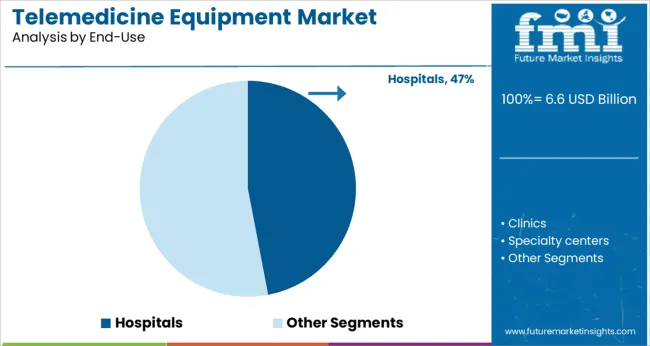
Hospitals are expected to contribute 47.0% of the overall market revenue in 2025, making them the dominant end-use segment for telemedicine equipment. This position is being reinforced by the need for integrated care delivery across departments, including emergency, inpatient, and outpatient settings.
Hospitals are leveraging telemedicine to extend the reach of specialty care, reduce patient backlog, and maintain continuity during infectious disease outbreaks or staffing shortages. The adoption of centralized monitoring systems and virtual rounding has improved operational efficiency, patient outcomes, and provider collaboration.
Investment in enterprise-grade platforms and compliance-ready hardware has further enabled hospitals to meet data protection standards while scaling digital health capacity. As care coordination and clinical decision-making increasingly rely on real-time communication and remote access, hospitals remain the primary driver of demand for advanced telemedicine solutions.
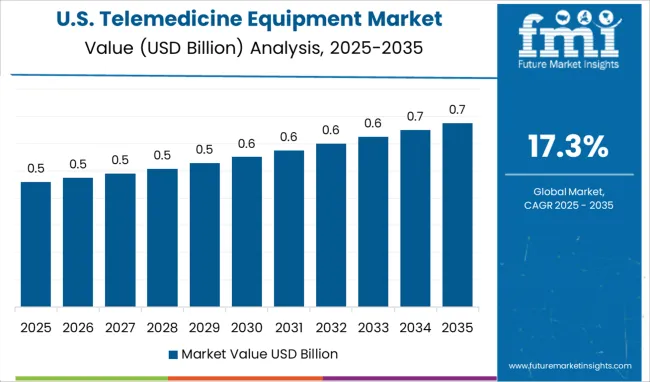
Telemedicine is a rapidly growing component of healthcare in the USA due to the growing burden of chronic diseases and the high adoption of advanced healthcare technologies. The adoption of telemedicine has improved care management, patients’ quality of life, and reduced healthcare spending.
The rising demand for mobile technologies, rising adoption of home care by patients, and reduction in hospital visits are expected to propel the market’s growth over the forecast period. Smartphones and the presence of mobile technology make it possible to use both clinical and lifestyle applications to help, educate, and adopt healthy behaviors.
Also, the initiatives by the government are expected to drive the market. For instance, the Centers for Medicare & Medicaid Services (CMS) has widened access to Medicare telehealth services due to which beneficiaries can get a broader range of services from healthcare professionals without having to travel to healthcare settings.
Additionally, Medicare will also pay for hospital, office, and other visits furnished via telehealth across the country, which are included in patients’ places of residence, starting from March 6, 2024. This is likely to have a positive impact on the market studied.
The rise of chronic diseases is a global concern that strains healthcare resources. Tele-homecare is an innovative way to provide care, monitor a patient, and provide information using the latest technology in telecommunication. Monitoring allows early identification of diseases, preventing chronic conditions.
Tele-homecare programs have also been initiated in countries, including the whole system demonstrator (WSD) project in the United Kingdom, the veterans’ health segmentation (VHA) project in the USA, and the TELEKART program in Denmark. These tele-homecare programs manage, reduce, and avoid chronic diseases through remote monitoring of patients.
The advantages of telehealth and telemedicine, together with advancements in telecommunications and greater technology use, are moving the telehealth and telemedicine equipment market share forward.
In recent years, telemedicine has experienced enormous expansion. It not only allows patients to communicate with doctors over the internet, but it can also help to save healthcare costs. Owing to these advantages, physicians, and hospitals are looking forward to incorporating digital health technologies into their practice. This has prompted the government to adopt telehealth-related rules, telemedicine guidelines, and reimbursement standards.
The rapid growth in the adoption of telemedicine equipment owing to the capacity to cure a wide variety of medical ailments and decreased traveling time fueling the telemedicine equipment market expansion.
Factors such as a physician shortage, the rise in geriatric and medically underserved populations, the cost-benefits of telemedicine kits, and enhanced telecommunications breakthroughs are all driving the sales of telemedicine equipment forward.
The in-person consultation between doctors and patients was limited due to rigorous local, national, and international regulations.
As a result, telemedicine gear is becoming more widely used to bridge the gap and obtain quick medical advice from highly certified and skilled medical specialists in faraway regions.
The elderly population, as well as patients in long-term care facilities, are said to profit greatly from the use of telemedicine diagnostic tools. As a result of the aforementioned factors, the overall market demand is predicted to increase.
What are the Factors Limiting the Growth of the Telemedicine Equipment Market?
The high telemedicine equipment costs and its upkeep could stifle market expansion.
By utilizing existing information and telecommunication infrastructure, telemedicine technology is frequently used to deliver healthcare services. Setting up telemedicine equipment kits is profitable in terms of income generation, but the significant capital cost associated with it may limit market penetration on a wide scale.
The price of maintaining telemedicine services with hardware components, particularly in developing and undeveloped areas, can be a significant challenge for healthcare institutions.
Telemedicine-related programs, software, and periodic upgrades might raise the cost of telemedicine equipment maintenance. As a result, the aforementioned concerns may negatively impact the overall telemedicine equipment market outlook.
What are the Key Trends in Telemedicine Equipment Market?
An increase in demand for radiological services owing to the rising prevalence of chronic conditions such as congestive heart failure, orthopedic injuries, and others are the primary factors that push the growth of the telemedicine market.
During the forecast years, continual improvements in medical diagnostic technologies are expected to give attractive chances for telemedicine equipment manufacturers to grow.
Growth is hampered by a lack of infrastructure and technological barriers. Deployment of the service may be hampered by technological and infrastructure hurdles in medium and low-income countries.
For the integration and transmission of medical data, digital health technologies require the latest telecommunication gear, high-speed internet with high bandwidth, and storage space, which is still a challenge in many developing nations.
The high cost of installation, high telehealth equipment requirements, and a scarcity of qualified healthcare professionals are two main challenges limiting the market's growth.
The telemedicine equipment market is divided into four categories: product, end-use, specialty, and geography.
The sales of telemedicine equipment are divided into four categories based on product: telemedicine kiosk, peripherals, telemedicine cart, and telemedicine kit. Peripherals are expected to rise at a rate of 16.4 percent over the predicted period.
Various market participants are concentrating on developing unique technology solutions to fulfill the growing need for better care and treatment in the healthcare sector, enhancing market statistics.
The telemedicine equipment market is divided into clinics, home care settings, hospitals, specialized centers, and others based on end-use. The specialty care centers segment is expected to register over 18% CAGR between 2025 and 2035.
On a regional level, the Latin American telemedicine equipment market share was valued at more than USD 3 million in 2020 and is expected to increase at a CAGR of more than 19 percent over the forecast period. The telemedicine equipment market in the Middle East and Africa was valued at more than USD 35 million in 2020 and is expected to grow at a CAGR of more than 17.5 percent in the future years.
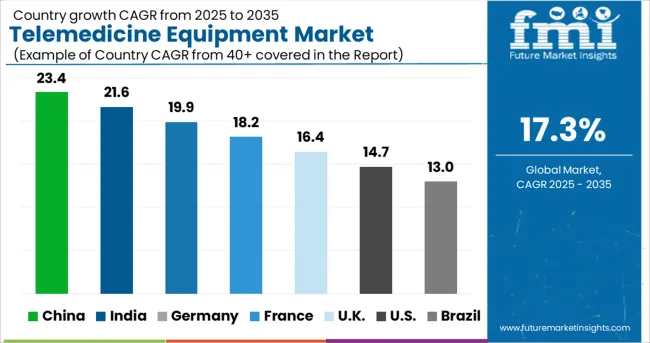
In 2024, the North American telemedicine equipment market was worth USD 2,263.0 million, and it is expected to grow at a 16.7% CAGR over the forecast period. To prevent the spread of the coronavirus, local governments instituted a severe shutdown.
As a result of the aforementioned considerations, the usage of telemedicine equipment for telehealth services has increased, promoting regional market expansion through growing telemedicine equipment manufacturers.
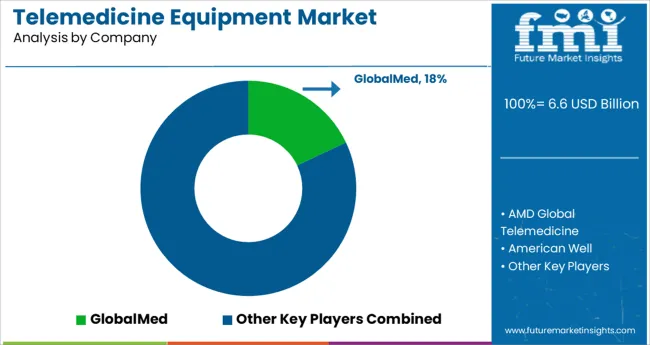
AMD Global Telemedicine, AFC Industries, American Well, VSee, Poly, Parsys, Cura Carts, and Ergotron are among the industry's major companies. To enhance their revenue growth and capture a significant portion of the telemedicine equipment market, telemedicine equipment suppliers are relying on a combination of inorganic and organic growth tactics.
Recent advancements in the industry:
Mesmerize established cooperation with VSee in December 2024. This agreement aims to give Mesmerize's advertisers another platform to engage healthcare practitioners and patients through Mesmerize's network telehealth solutions, allowing them to deliver remote patient monitoring services. This collaboration will provide best-in-class telehealth and telemedicine services.
AFC Industries purchased AALL AMERICAN FASTENERS (AAF), situated in Cinnaminson, New Jersey, in December 2024. Electronic hardware, electrical components, a complete variety of fasteners, abrasives, tools, safety, and industrial supplies are all available from AALL AMERICAN Fasteners, a vendor-managed inventory service provider. This acquisition aided the company's development of cutting-edge healthcare telemedicine diagnostic tools and technology.
The global telemedicine equipment market is estimated to be valued at USD 6.6 billion in 2025.
It is projected to reach USD 32.7 billion by 2035.
The market is expected to grow at a 17.3% CAGR between 2025 and 2035.
The key product types are telemedicine cart, _single display cart, _dual display cart, _others, telemedicine kit, telemedicine kiosk, peripherals, _digital camera, _stethoscopes, _digital scopes, _pulse oximeters and _others.
hospitals segment is expected to dominate with a 47.0% industry share in 2025.


Full Research Suite comprises of:
Market outlook & trends analysis
Interviews & case studies
Strategic recommendations
Vendor profiles & capabilities analysis
5-year forecasts
8 regions and 60+ country-level data splits
Market segment data splits
12 months of continuous data updates
DELIVERED AS:
PDF EXCEL ONLINE
Telemedicine Carts Market Size and Share Forecast Outlook 2025 to 2035
5G Telemedicine Platform Market Size and Share Forecast Outlook 2025 to 2035
Veterinary Telemedicine Market Size and Share Forecast Outlook 2025 to 2035
Telehealth and Telemedicine Market Growth - Trends & Forecast 2025 to 2035
Equipment Management Software Market Size and Share Forecast Outlook 2025 to 2035
Equipment cases market Size and Share Forecast Outlook 2025 to 2035
Farm Equipment Market Forecast and Outlook 2025 to 2035
Golf Equipment Market Size and Share Forecast Outlook 2025 to 2035
Port Equipment Market Size and Share Forecast Outlook 2025 to 2035
Pouch Equipment Market Growth – Demand, Trends & Outlook 2025 to 2035
Garage Equipment Market Forecast and Outlook 2025 to 2035
Mining Equipment Industry Analysis in Latin America Size and Share Forecast Outlook 2025 to 2035
Subsea Equipment Market Size and Share Forecast Outlook 2025 to 2035
Pavers Equipment Market Size and Share Forecast Outlook 2025 to 2035
Tennis Equipment Market Analysis - Size, Share, and Forecast Outlook 2025 to 2035
Galley Equipment Market Analysis and Forecast by Fit, Application, and Region through 2035
Sorting Equipment Market Size and Share Forecast Outlook 2025 to 2035
General Equipment Rental Services Market Size and Share Forecast Outlook 2025 to 2035
Bagging Equipment Market Size and Share Forecast Outlook 2025 to 2035
RF Test Equipment Market Size and Share Forecast Outlook 2025 to 2035

Thank you!
You will receive an email from our Business Development Manager. Please be sure to check your SPAM/JUNK folder too.
Chat With
MaRIA