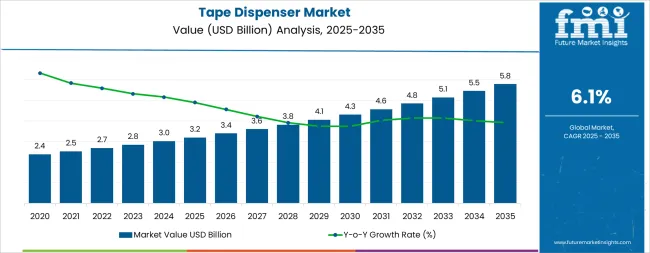
The tape dispenser industry is valued at USD 3.2 billion in 2025 and projected to reach USD 5.8 billion by 2035, expanding at a 6.1% CAGR. Growth is supported by rising packaging demand across e-commerce, logistics, and retail sectors, where efficiency in sealing and dispensing materials has become a priority. The increasing automation in industrial packaging lines and the adoption of ergonomic manual dispensers for office and household use are contributing to the expansion of demand. Manufacturers are diversifying product ranges with lightweight, durable, and refill-friendly dispensers, enhancing usability and cost-effectiveness.
The transition toward environment-friendly tapes and biodegradable packaging materials is also influencing product adoption trends. Asia Pacific, led by China and India, is driving demand due to strong industrial activity, while North America and Europe maintain steady growth through technology-focused packaging innovations.
The global tape dispenser market is primarily segmented into manual and automatic dispensers. Manual dispensers dominate the market, accounting for approximately 68% of the share, driven by their cost-effectiveness and simplicity. Automatic dispensers hold the remaining 32%, gaining traction in industrial applications due to their efficiency and reduced labor costs.
In terms of end-use, the industrial sector leads with about 40% of total revenue, attributed to the growing need for efficient and lightweight tape dispensing solutions. The logistics segment captures 30%, emphasizing precision and speed in operational processes, while the consumer goods sector accounts for 20%, driven by the demand for versatile and reusable dispenser solutions.
Recent developments in the tape dispenser market indicate a shift towards automation and smart technologies. Automatic dispensers are increasingly integrated with programmable settings and Internet of Things (IoT) capabilities, enhancing efficiency and user control.
There is also a growing emphasis on ergonomic designs to reduce user fatigue and improve usability. Sustainability is becoming a key focus, with manufacturers developing eco-friendly dispensers using recyclable materials to meet environmental concerns. The rise of e-commerce and industrial automation is driving demand for advanced tape dispensers that can handle high-volume packaging and sealing tasks efficiently.
| Metric | Value |
|---|---|
| Estimated Value in (2025E) | USD 3.2 billion |
| Forecast Value in (2035F) | USD 5.8 billion |
| Forecast CAGR (2025 to 2035) | 6.1% |
Market expansion is being supported by the increasing global growth of e-commerce logistics and the corresponding need for efficient packaging tools that can maintain productivity while reducing worker fatigue and material waste across various packaging applications. Modern distribution centers and fulfillment operations are increasingly focused on implementing equipment solutions that can reduce packaging cycle times, minimize adhesive tape consumption, and provide consistent sealing quality in high-volume packaging operations. Tape dispensers' proven ability to deliver ergonomic benefits, operational efficiency improvements, and material cost reduction make them essential tools for contemporary packaging and shipping operations.
The growing focus on warehouse automation and worker safety is driving demand for tape dispensers that can support repetitive packaging tasks, reduce ergonomic stress injuries, and enable consistent package sealing quality. Logistics operators' preference for equipment that combines ease of use with operational efficiency and worker comfort is creating opportunities for innovative tape dispenser implementations. The rising influence of e-commerce fulfillment requirements and lean manufacturing principles is also contributing to increased adoption of tape dispensers that can provide efficient adhesive application without excessive material waste or processing delays.
The tape dispenser market is poised for growth as global e-commerce, logistics, manufacturing, and office environments increasingly prioritize efficiency, ergonomics, and automation in their packaging and sealing operations. Both manual and automatic tape dispensers are evolving beyond simple cutting tools into precision equipment that reduces material waste, improves worker productivity, and integrates with automated packaging lines.
Rising package volumes driven by online retail, combined with labor cost pressures and workplace safety regulations, are accelerating adoption across distribution centers, manufacturing facilities, and corporate mailrooms. Innovations in automatic dispensing, ergonomic design, and integration with packaging automation systems present multiple revenue expansion pathways.
The market is segmented by product type, tape width compatibility, end use, distribution channel, and region. By product type, the market is divided into manual desktop dispensers, handheld dispensers, automatic/electronic dispensers, heavy-duty industrial dispensers, and specialty dispensers. By tape width compatibility, it covers standard (up to 2 inches), wide (2-3 inches), and extra-wide (above 3 inches).
By mechanism, it is segmented into blade cutting, serrated edge, and electronic cutting. Based on end use, the market is categorized into industrial & commercial, retail & e-commerce, office & stationery, and logistics & warehousing.
By distribution channel, the market includes wholesalers & distributors, specialty packaging suppliers, office supply retailers, and online retail. Regionally, the market is divided into North America, Europe, East Asia, South Asia & Pacific, Latin America, and the Middle East & Africa.
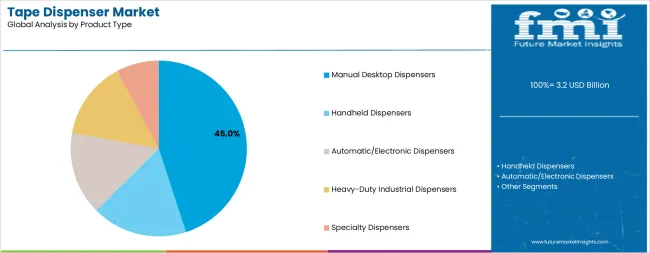
The manual desktop dispensers segment is projected to account for 45.0% of the tape dispenser market in 2025, reaffirming its position as the leading product category. Office administrators and retail packaging operations increasingly utilize manual desktop dispensers for their ease of use, reliable cutting performance, and cost-effective operation across mail room applications, gift wrapping stations, and light-duty packaging tasks. Manual desktop dispenser technology's proven functionality and minimal maintenance requirements directly address the operational needs for dependable adhesive dispensing in lower-volume applications.
This product segment forms the foundation of office and retail packaging operations, as it represents the equipment type with the greatest versatility and established adoption across multiple work environments and packaging scenarios. User investments in weighted bases and ergonomic designs continue to strengthen adoption among administrative staff and retail personnel. With businesses prioritizing cost-effective packaging tools and reliable daily operation, manual desktop dispensers align with both budget constraints and functional requirements, making them the central component of comprehensive office supply and retail packaging strategies.
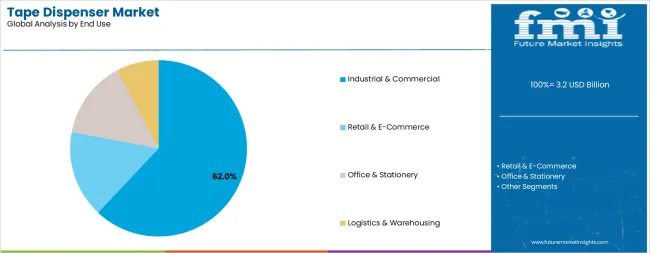
Industrial and commercial users are projected to represent 62.0% of tape dispenser demand in 2025, underscoring their critical role as the primary consumers of tape dispensing equipment for high-volume packaging and manufacturing operations. Manufacturing facilities and distribution centers prefer heavy-duty tape dispensers for their durability, consistent performance, and ability to withstand repetitive use while reducing packaging cycle times and worker fatigue. Positioned as essential equipment for modern logistics operations, industrial tape dispensers offer both productivity advantages and ergonomic benefits.
The segment is supported by continuous innovation in automated dispensing technologies and the growing availability of programmable electronic systems that enable precise tape length control with minimal operator intervention. Additionally, industrial users are investing in ergonomic equipment upgrades to support worker safety initiatives and repetitive motion injury prevention. As e-commerce fulfillment volumes become more prevalent and packaging efficiency requirements increase, industrial and commercial users will continue to dominate the end-user market while supporting advanced dispensing technology adoption and operational optimization strategies.
The tape dispenser market is advancing rapidly due to increasing e-commerce package volumes and growing adoption of packaging automation equipment that provides improved efficiency and ergonomic benefits across diverse fulfilment and manufacturing applications. The market faces challenges, including competition from integrated carton sealing machines, price sensitivity in lower-volume applications, and the need for compatibility with diverse tape formulations and widths. Innovation in electronic dispensing technologies and ergonomic design improvements continues to influence product development and market expansion patterns.
The growing adoption of automatic and electronic tape dispensers is enabling logistics operators to achieve consistent tape cutting lengths, reduced material waste, and improved packaging throughput in high-volume fulfilment operations. Automatic dispensing systems provide programmable length settings while allowing more efficient operation and reduced operator training requirements across various packaging applications. Manufacturers are increasingly recognizing the competitive advantages of electronic dispensing capabilities for operational efficiency and material cost reduction.
Modern tape dispenser producers are incorporating ergonomic handle designs, adjustable tension controls, and reduced-force cutting mechanisms to minimize repetitive strain injuries and enhance operator comfort during extended packaging shifts. These design improvements support workplace safety initiatives while enabling new applications, including standing workstation configurations and ambidextrous operation capabilities. Advanced ergonomic integration also allows operators to maintain productivity levels while reducing fatigue-related errors and injury claims beyond traditional packaging tool performance.
| Country | CAGR (2025-2035) |
|---|---|
| China | 7.8% |
| USA | 5.9% |
| India | 8.2% |
| Germany | 5.4% |
| Japan | 4.8% |
| United Kingdom | 5.2% |
| Brazil | 6.5% |
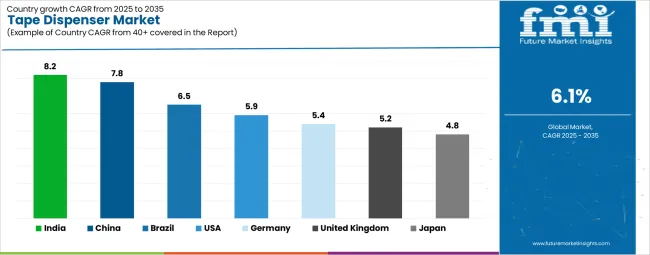
The tape dispenser market is experiencing strong growth globally, with India leading at an 8.2% CAGR through 2035, driven by rapid e-commerce expansion, growing manufacturing output, and significant investment in logistics infrastructure development. China follows at 7.8%, supported by massive e-commerce volumes, extensive manufacturing operations, and increasing warehouse automation adoption.
The USA shows growth at 5.9%, emphasizing automated packaging solutions and ergonomic equipment upgrades. Brazil records 6.5%, focusing on e-commerce logistics expansion and industrial modernization. The United Kingdom demonstrates 5.2% growth, prioritizing fulfilment canter efficiency and automated packaging equipment.
Germany exhibits 5.4% growth, emphasizing manufacturing automation and industrial packaging optimization. Japan shows 4.8% growth, supported by precision manufacturing applications and ergonomic workplace standards.
The report covers an in-depth analysis of 40+ countries, Top-performing countries are highlighted below.
The tape dispensers market in India is projected to exhibit exceptional growth with a CAGR of 8.2% through 2035, driven by explosive e-commerce growth and rapidly expanding logistics infrastructure supported by government digital economy initiatives. The country's burgeoning online retail sector and increasing investment in warehouse automation are creating substantial demand for efficient packaging equipment solutions. Major e-commerce companies and third-party logistics providers are establishing comprehensive fulfilment capabilities requiring advanced tape dispensing equipment to serve growing package volumes.
The tape dispensers market in China is expanding at a CAGR of 7.8%, supported by the country's massive e-commerce ecosystem, extensive manufacturing base, and increasing adoption of warehouse automation technologies. The country's comprehensive logistics infrastructure and growing emphasis on packaging efficiency are driving demand for sophisticated tape dispensing capabilities. International equipment providers and domestic manufacturers are establishing extensive production and distribution capabilities to address the growing demand for packaging automation products.
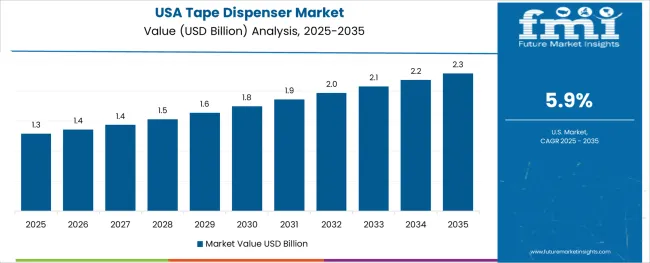
The tape dispensers market in the USA is expanding at a CAGR of 5.9%, supported by the country's mature e-commerce market, advanced warehouse automation infrastructure, and strong emphasis on worker safety and ergonomic equipment. The nation's extensive logistics network and high labor costs are driving sophisticated automation capabilities throughout the supply chain. Leading equipment manufacturers and technology providers are investing extensively in electronic dispensing systems and integrated packaging solutions to serve both e-commerce fulfilment operations and manufacturing facilities.
The tape dispensers market in Brazil is growing at a CAGR of 6.5%, driven by expanding e-commerce penetration, increasing logistics infrastructure investment, and growing adoption of modern packaging equipment. The country's rapidly growing online retail sector and modernization of distribution facilities are supporting demand for efficient tape dispensing technologies across major urban centers. Logistics providers and manufacturers are establishing improved packaging capabilities to serve both domestic e-commerce operations and export packaging requirements.
The tape dispensers market in the United Kingdom is expanding at a CAGR of 5.2%, supported by the country's mature e-commerce market, extensive fulfillment infrastructure, and strong emphasis on packaging automation and worker ergonomics. The UK's established logistics sector and high labor costs are driving demand for efficient tape dispensing technologies that reduce packaging time and improve worker comfort. Equipment providers are investing in automated dispensing solutions to serve both e-commerce fulfillment centers and traditional retail distribution operations.
The tape dispensers market in Germany is growing at a CAGR of 5.4%, driven by the country's advanced manufacturing sector, emphasis on automated packaging solutions, and strong engineering capabilities in material handling equipment. Germany's extensive industrial base and technological expertise are supporting investment in sophisticated tape dispensing equipment throughout manufacturing facilities and logistics centers. Industry leaders are establishing comprehensive automation systems integrating tape dispensers with broader packaging line operations.
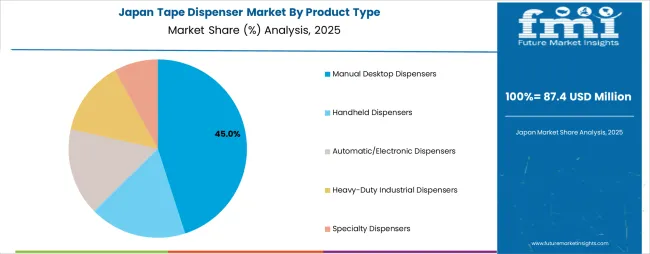
The tape dispensers market in Japan is expanding at a CAGR of 4.8%, supported by the country's focus on manufacturing precision, advanced ergonomic workplace standards, and strong emphasis on quality packaging equipment. Japan's sophisticated manufacturing industry and mature logistics infrastructure are driving demand for high-precision tape dispensing technologies. Leading equipment manufacturers are investing in specialized dispensing solutions serving electronics manufacturing, precision assembly operations, and high-end retail packaging applications.
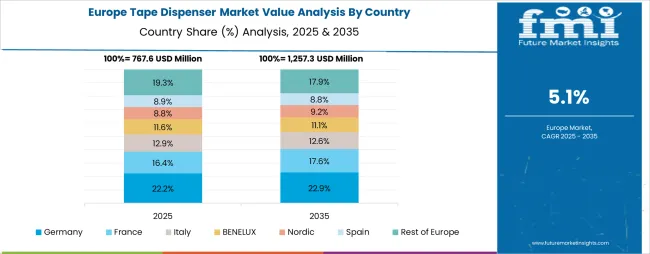
The tape dispenser market in Europe is projected to grow from USD 710 million in 2025 to USD 1.28 billion by 2035, registering a CAGR of 6.1% over the forecast period. Germany is expected to maintain its leadership position with a 31.0% market share in 2025, slightly declining to 30.5% by 2035, supported by its strong manufacturing base, extensive logistics infrastructure, and comprehensive industrial packaging equipment supply networks serving major European markets.
The United Kingdom follows with a 22.0% share in 2025, projected to reach 22.5% by 2035, driven by robust e-commerce fulfillment activity, extensive warehouse operations, and growing adoption of automated packaging equipment across retail logistics and third-party fulfillment providers. France holds a 16.0% share in 2025, expected to reach 16.5% by 2035, supported by strong manufacturing sector demand and expanding e-commerce logistics operations. Italy commands a 12.0% share in 2025, projected to reach 12.3% by 2035, while Spain accounts for 8.0% in 2025, expected to reach 8.2% by 2035.
The Netherlands maintains a 4.5% share in 2025, growing to 4.7% by 2035, driven by its position as a European logistics hub. The Rest of Europe region, including Nordic countries, Eastern Europe, Belgium, Switzerland, Austria, and Portugal, is anticipated to gain momentum, expanding its collective share from 6.5% to 6.8% by 2035, attributed to increasing warehouse automation adoption in Nordic countries and growing e-commerce fulfillment activities across Eastern European markets implementing logistics modernization programs.
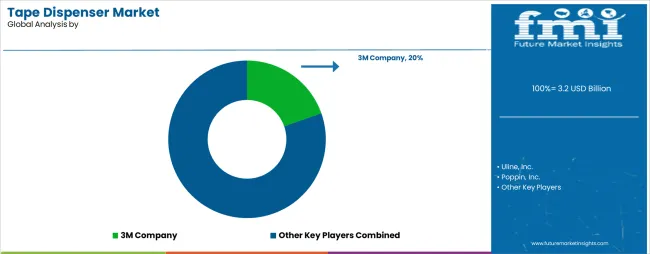
The tape dispenser market is characterized by competition among established packaging equipment manufacturers, specialty adhesive product companies, and industrial supply distributors. Companies are investing in automatic dispensing technology research, ergonomic design optimization, blade durability improvements, and comprehensive product portfolios to deliver reliable, efficient, and user-friendly tape dispensing solutions. Innovation in electronic cutting systems, programmable length controls, and integration with packaging automation equipment is central to strengthening market position and competitive advantage.
3M Company leads the market with a strong presence, offering comprehensive tape dispenser solutions ranging from desktop models to heavy-duty industrial systems with a focus on ergonomic design and blade technology. Uline, Inc. provides extensive packaging equipment distribution capabilities with emphasis on rapid delivery and comprehensive product selection.
Poppin, Inc. delivers modern office supply solutions with a focus on contemporary design and workplace aesthetics. Scotch Brand (3M) specializes in consumer and office tape dispensing products with established brand recognition. IPG (Intertape Polymer Group) focuses on industrial packaging solutions and tape dispenser systems for commercial applications. Shurtape Technologies offers specialized tape products and compatible dispensing equipment with emphasis on contractor and industrial markets.
| Items | Values |
|---|---|
| Quantitative Units (2025) | USD 3.2 billion |
| Product Type | Manual Desktop Dispensers, Handheld Dispensers, Automatic/Electronic Dispensers, Heavy-Duty Industrial Dispensers, Specialty Dispensers |
| Tape Width Compatibility | Standard (up to 2 inches), Wide (2-3 inches), Extra-Wide (above 3 inches) |
| Mechanism | Blade Cutting, Serrated Edge, Electronic Cutting |
| End Use | Industrial & Commercial, Retail & E-Commerce, Office & Stationery, Logistics & Warehousing |
| Distribution Channel | Wholesalers & Distributors, Specialty Packaging Suppliers, Office Supply Retailers, Online Retail |
| Regions Covered | North America, Europe, East Asia, South Asia & Pacific, Latin America, Middle East & Africa |
| Countries Covered | United States, Canada, United Kingdom, Germany, France, China, Japan, South Korea, India, Brazil, Australia and 40+ countries |
| Key Companies Profiled | 3M Company, Uline, Inc., Poppin, Inc., Scotch Brand (3M), IPG (Intertape Polymer Group), and Shurtape Technologies, LLC |
| Additional Attributes | Dollar sales by product type and end use category, regional demand trends, competitive landscape, technological advancements in automatic dispensing systems, ergonomic design innovation, electronic cutting technologies, and packaging automation integration |
The global tape dispenser market is estimated to be valued at USD 3.2 billion in 2025.
The market size for the tape dispenser market is projected to reach USD 5.8 billion by 2035.
The tape dispenser market is expected to grow at a 6.1% CAGR between 2025 and 2035.
The key product types in tape dispenser market are manual desktop dispensers, handheld dispensers, automatic/electronic dispensers, heavy-duty industrial dispensers and specialty dispensers.
In terms of end use, industrial & commercial segment to command 62.0% share in the tape dispenser market in 2025.
Explore Similar Insights

Thank you!
You will receive an email from our Business Development Manager. Please be sure to check your SPAM/JUNK folder too.
Chat With
MaRIA