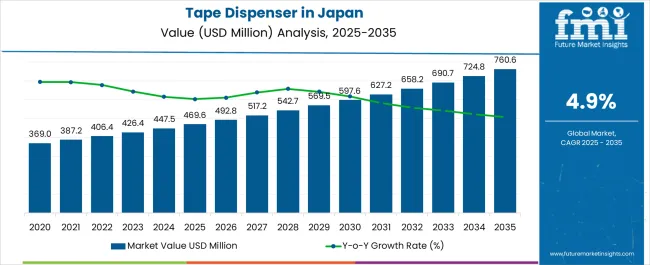
The Tape Dispenser Industry Analysis in Japan is estimated to be valued at USD 469.6 million in 2025 and is projected to reach USD 760.6 million by 2035, registering a compound annual growth rate (CAGR) of 4.9% over the forecast period.

| Metric | Value |
|---|---|
| Tape Dispenser Industry Analysis in Japan Estimated Value in (2025 E) | USD 469.6 million |
| Tape Dispenser Industry Analysis in Japan Forecast Value in (2035 F) | USD 760.6 million |
| Forecast CAGR (2025 to 2035) | 4.9% |
The tape dispenser industry in Japan is demonstrating steady growth as a result of strong demand across office, commercial, and packaging applications. Market development is being influenced by rising operational efficiency needs, user preference for convenience-driven products, and the presence of technologically adaptable solutions. The current scenario reflects stable adoption in both professional and consumer environments, with manufacturers focusing on enhancing design durability, ergonomics, and cost efficiency.
Regulatory emphasis on workplace productivity and safety is also contributing to consistent market expansion. Future outlook is being shaped by automation trends, increased integration of dispensing solutions in organized retail and logistics, and the introduction of sustainable materials that align with environmental standards.
Growth rationale is anchored on Japan’s mature commercial infrastructure, the need for precision in office and industrial applications, and continuous innovation in product designs that improve efficiency, reliability, and long-term usability These factors collectively support sustainable revenue growth and broader market penetration across domestic segments.

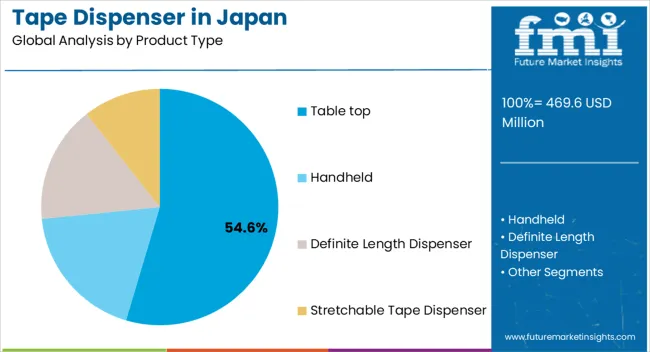
The table top segment, holding 54.60% of the product type category, has maintained its leadership due to its reliability, durability, and widespread application across office and industrial workspaces. Preference for table top models has been reinforced by their stability, ease of use, and suitability for repetitive tasks requiring efficiency.
Manufacturers have been optimizing product designs to improve ergonomics and safety, which has enhanced adoption across diverse professional environments. Consistent demand has been supported by the strong presence of corporate offices and manufacturing facilities in Japan, where workflow optimization is prioritized.
Innovation in multi-roll and heavy-duty variants has also strengthened the value proposition The continued preference for table top dispensers is expected to sustain growth momentum, making the segment a cornerstone of the Japanese tape dispenser industry.

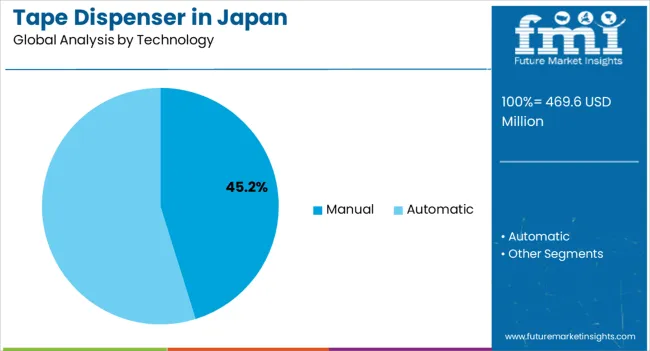
The manual segment, representing 45.20% of the technology category, has retained its dominance due to its cost-effectiveness, ease of operation, and minimal maintenance requirements. Its adoption has been driven by offices, retail stores, and small-scale businesses where affordability and straightforward usage are essential.
Manual dispensers have benefited from design improvements that reduce user fatigue and increase operational efficiency. Strong demand has been observed in environments where automation is not required, reinforcing segment stability.
Manufacturers are focusing on enhancing durability and integrating user-friendly features, ensuring continued relevance in competitive markets As workplace productivity needs expand, the manual dispenser segment is expected to maintain its substantial market presence while serving as a dependable choice for cost-conscious buyers.

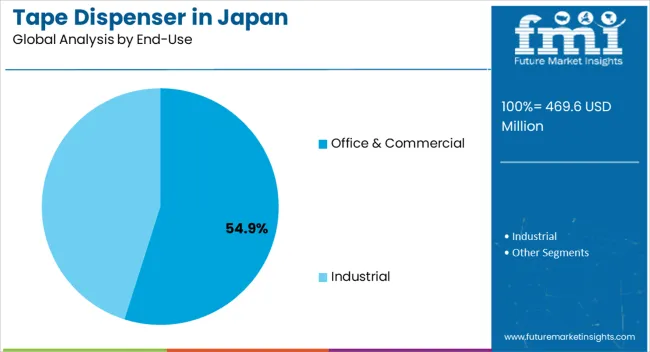
The office and commercial segment, accounting for 54.90% of the end-use category, has been leading the market due to Japan’s well-developed corporate infrastructure and extensive retail and commercial activity. High adoption has been supported by demand for efficient packaging, labeling, and administrative solutions in office settings and retail outlets.
The segment’s strength has been reinforced by large-scale distribution networks and procurement by institutional buyers. Continuous investment in commercial infrastructure and the emphasis on productivity have sustained segment leadership.
Product availability through diversified distribution channels, combined with innovation in ergonomically designed dispensers, has improved accessibility and adoption The office and commercial end-use segment is expected to remain the dominant growth driver, supported by expanding business activities and the ongoing need for efficiency in daily operations.
The Kanto region, encompassing Tokyo and its surrounding prefectures, is a bustling economic hub with a robust industrial base. In Kanto, the demand for tape dispensers is fueled by the concentration of manufacturing and logistics activities, particularly in Tokyo and neighboring prefectures.
The region extensive network of businesses, including those engaged in electronics, automotive, and e-commerce, drives the need for efficient packaging solutions. The tape dispenser industry in Kanto is influenced by a quest for innovative and automated dispensing technologies to cater to the diverse packaging demands of this economically vibrant region.
The Chubu region in central Japan is home to major manufacturing centers and industrial zones, including Nagoya, a pivotal automotive hub. In Chubu, the tape dispenser industry is closely tied to manufacturing processes, with a particular emphasis on precision and efficiency.
As automotive and manufacturing companies seek advanced packaging solutions, there is a growing trend toward adopting automated tape dispensers and smart technologies in the Chubu region. This reflects the region commitment to technological advancements and the integration of Industry 4.0 principles into manufacturing operations, driving the demand for sophisticated tape dispenser solutions.
The table below highlights how the table top and office and commercial will lead the product type and end use segments in 2025.
| Category | Industrial Share by 2025 |
|---|---|
| Table top | 54.6% |
| Office and commercial | 54.9% |
Table-top tape dispensers find widespread utility in office and commercial environments, specifically designed to handle high-volume usage and accommodate large tape rolls efficiently. These dispensers are also extensively employed in the manufacturing industry, playing a crucial role in sealing boxes and packaging materials with precision.
Their prevalence in settings requiring continuous tape dispensing activity, such as manufacturing facilities, underscores their preference over hand-held alternatives. The design and functionality of table-top tape dispensers make them particularly well-suited for tasks that demand durability, efficiency, and a consistent output, making them indispensable tools in various professional settings.
The tape dispenser industry end-user landscape is predominantly led by the office and commercial segment, reflecting a substantial demand for tape dispensers in these settings. The prevalence of tape dispensers in offices and commercial environments is driven by their versatile applications, from sealing envelopes and attaching documents to facilitating efficient packaging processes.
The widespread use of tape dispensers in these sectors underscores their indispensability in everyday tasks, contributing to the segment dominant position within the industry. The high demand within office and commercial settings highlights tape dispensers crucial role in promoting productivity and organization in various professional contexts.
| Attribute | Details |
|---|---|
| Estimated Industry Size in 2025 | USD 469.6 million |
| Projected Industry Size in 2035 | USD 760.6 million |
| Anticipated CAGR between 2025 to 2035 | 4.9% CAGR |
| Demand Forecast for the Tape Dispenser Industry in Japan | 2025 to 2035 |
| Report Coverage | Industry Size, Industry Trends, Analysis of key factors influencing the Tape Dispenser Industry in Japan, Insights on Global Players and their Industry Strategy in Japan, Ecosystem Analysis of Local and Regional Japan Providers |
| Key Countries Analyzed | Kanto, Chubu, Kinki (Kansai), Kyushu and Okinawa, Tohoku, Rest of Japan |
| Key Companies Profiled | Yaesu Keikogyo Co., Ltd; TOYO STEEL Co., Ltd.; ARHAN JAPAN KABUSHIKI KAISHA; Excel Factory Inc.; Tesa SE; Intertape Polymer Group Inc.; Fellow Brands; Shurtape Technologies LLC; Koziol USA; START International |
The global tape dispenser industry analysis in Japan is estimated to be valued at USD 469.6 million in 2025.
The market size for the tape dispenser industry analysis in Japan is projected to reach USD 762.7 million by 2035.
The tape dispenser industry analysis in Japan is expected to grow at a 5.0% CAGR between 2025 and 2035.
The key product types in tape dispenser industry analysis in Japan are table top, handheld, definite length dispenser and stretchable tape dispenser.
In terms of technology, manual segment to command 45.2% share in the tape dispenser industry analysis in Japan in 2025.


Full Research Suite comprises of:
Market outlook & trends analysis
Interviews & case studies
Strategic recommendations
Vendor profiles & capabilities analysis
5-year forecasts
8 regions and 60+ country-level data splits
Market segment data splits
12 months of continuous data updates
DELIVERED AS:
PDF EXCEL ONLINE
Tape Measure Market Size and Share Forecast Outlook 2025 to 2035
Tapes Market Insights – Growth & Demand 2025 to 2035
Tape & Label Adhesives Market
Tape Unwinder Market Size and Share Forecast Outlook 2025 to 2035
Tape Backing Materials Market Analysis by Material Type, Application, and Region through 2025 to 2035
Tape Banding Machine Market Overview - Demand & Growth Forecast 2025 to 2035
Tape Stretching Line Market Analysis – Growth & Trends 2025 to 2035
Tape Applicator Machines Market
Competitive Overview of Tape Backing Materials Companies
Tape Dispenser Market Size and Share Forecast Outlook 2025 to 2035
Competitive Overview of Tape Dispenser Companies
Tape Dispenser Industry Analysis in Western Europe Size and Share Forecast Outlook 2025 to 2035
UV Tapes Market Growth - Trends & Forecast 2025 to 2035
PVC Tapes Market Size and Share Forecast Outlook 2025 to 2035
ESD Tapes and Labels Market from 2025 to 2035
USA Tapes Market Analysis – Growth & Forecast 2024-2034
Leading Providers & Market Share in PVC Tapes Industry
Duct Tape Market Size and Share Forecast Outlook 2025 to 2035
Foam Tape Market Size and Share Forecast Outlook 2025 to 2035
Body Tape Market Size and Share Forecast Outlook 2025 to 2035

Thank you!
You will receive an email from our Business Development Manager. Please be sure to check your SPAM/JUNK folder too.
Chat With
MaRIA