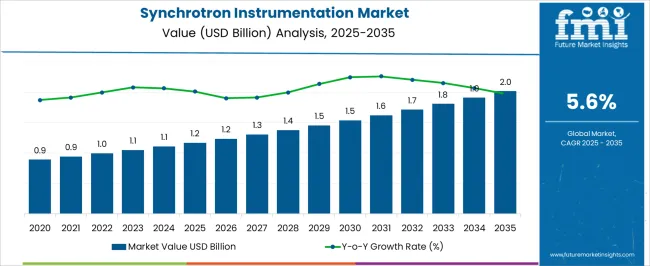
The Synchrotron Instrumentation Market is estimated to be valued at USD 1.2 billion in 2025 and is projected to reach USD 2.0 billion by 2035, registering a compound annual growth rate (CAGR) of 5.6% over the forecast period.
| Metric | Value |
|---|---|
| Synchrotron Instrumentation Market Estimated Value in (2025 E) | USD 1.2 billion |
| Synchrotron Instrumentation Market Forecast Value in (2035 F) | USD 2.0 billion |
| Forecast CAGR (2025 to 2035) | 5.6% |
The synchrotron instrumentation market is experiencing robust development driven by increasing applications in materials science, pharmaceuticals, energy research, and nanotechnology. Expanding investments in research infrastructure and collaborations between academic institutions and industrial players are propelling market growth.
The ability of synchrotron facilities to provide high resolution imaging, precise material characterization, and structural analysis is reinforcing their importance across advanced scientific domains. Growing demand for real time structural analysis of nanoparticles, biomolecules, and complex materials is shaping innovation in optical devices and beamline technologies.
Additionally, the oil and gas sector, along with renewable energy research, is leveraging synchrotron capabilities for enhanced exploration, corrosion analysis, and catalytic process optimization. The market outlook remains positive as synchrotron instrumentation continues to align with global trends in nanotechnology, advanced materials, and sustainable energy solutions.
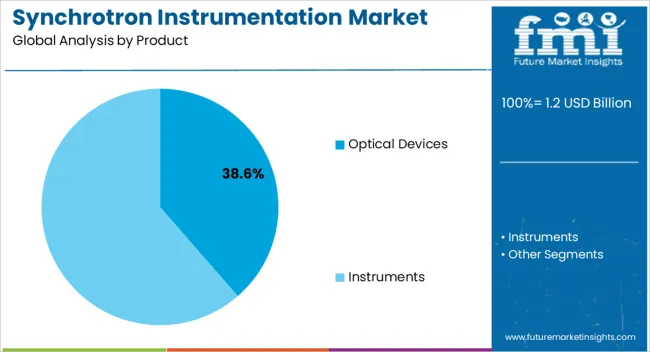
The optical devices segment is expected to represent 38.60% of total revenue by 2025 within the product category, making it the leading product segment. Growth has been supported by the essential role of optical devices in beamline operations, enabling enhanced resolution, stability, and precision in experimental outputs.
The adaptability of these devices for multiple synchrotron applications, including spectroscopy and imaging, has increased their adoption.
Ongoing improvements in optics design and manufacturing are further improving performance reliability, while demand from advanced research centers continues to sustain their leadership in the product category.
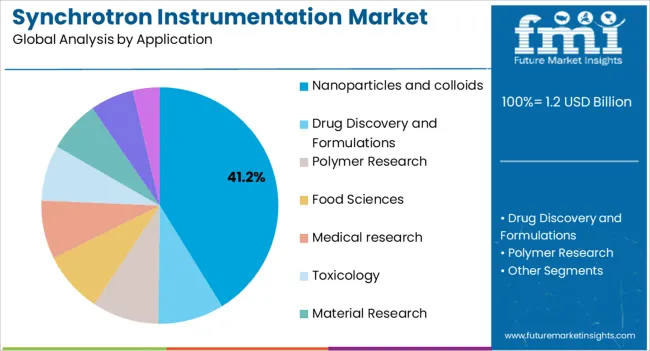
The nanoparticles and colloids application segment is projected to account for 41.20% of total revenue by 2025, positioning it as the most prominent application. This dominance is linked to the growing use of synchrotron light sources for analyzing particle size distribution, stability, and structural behavior of nanoparticles.
Research in drug delivery, nanomaterials, and advanced coatings relies extensively on synchrotron instrumentation, reinforcing the segment’s strength.
The increasing role of nanotechnology in healthcare, electronics, and energy has intensified the demand for high precision structural characterization, thereby strengthening the segment’s market share.
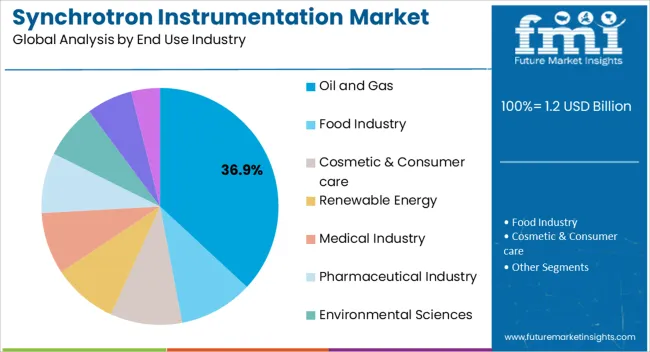
The oil and gas segment is estimated to hold 36.90% of overall revenue by 2025, making it the leading end use industry. Adoption has been driven by the need to analyze corrosion mechanisms, fluid behavior in porous media, and catalytic processes with high accuracy.
Synchrotron instrumentation has enabled deeper insights into refining processes and material degradation, leading to improved operational safety and efficiency. With growing pressure on oil and gas companies to optimize resources and reduce environmental impact, the use of synchrotron techniques has become increasingly critical.
This has reinforced the segment’s position as a key contributor to market revenue.
Sales of the synchrotron instrumentation market grew at a CAGR of 3.8% between 2020 to 2025. Synchrotron instrumentation market contributes 0.2% revenue share to the global radiation application market in 2025, which is valued around USD 1.2.0 Billion in 2025.
Synchrotron facilities and their instrumentation cater to a wide range of scientific disciplines, including materials science, physics, chemistry, biology, environmental science, and more. The increasing emphasis on interdisciplinary research and collaborations between different scientific domains create opportunities for synchrotron instrumentation to be used in diverse applications. This expanded scope drives the demand for versatile and adaptable instruments.
Considering this, FMI expects the global market to grow at a CAGR of 5.6% through the forecasted years.
An increased focus on nanotechnology is projected to increase demand for synchrotron instrumentation as researchers seek for more advanced tools to explore the properties and interactions of nanomaterials at the atomic and molecular level.
Also, growing importance of synchrotron research is driving the development of new and advanced instrumentation technologies. This is because researchers are constantly pushing the limits of what can be achieved using synchrotron facilities, which is driving the need for new and more advanced instrumentation technologies.
As synchrotron research becomes more important in various fields such as materials science, biotechnology, and environmental science, there will be an increase in demand for advanced synchrotron instrumentation to support this research. This will drive the growth of the market.
Strategic partnerships and collaborations can provide access to funding that may not be available to individual companies. This funding can be used to support research and development efforts, as well as the development and commercialization of new technologies. Also, new product launch is also the reason stimulating the market growth.
The high price of synchrotron equipment may restrain the development of the worldwide synchrotron instrumentation industry by limiting innovation, adoption, funding, and affordability. Synchrotron instrumentation can be prohibitively expensive for smaller research institutions or universities. This may restrict the market's size and lower demand for synchrotron equipment.
The high price of synchrotron equipment can restrict researchers' capacity to develop and explore uncharted territory. This may reduce the possibilities for novel uses and scientific advancements that can spur industry expansion. The high price of synchrotron equipment can also result in less financing being available for research programmes that need it.
This can lower the demand for these instruments and lower the number of research programmes that employ synchrotron equipment. Also, the expensive price of synchrotron instrumentation may prevent its use in developing nations or regions with tight research resources. This may reduce the market's potential for expansion and growth.
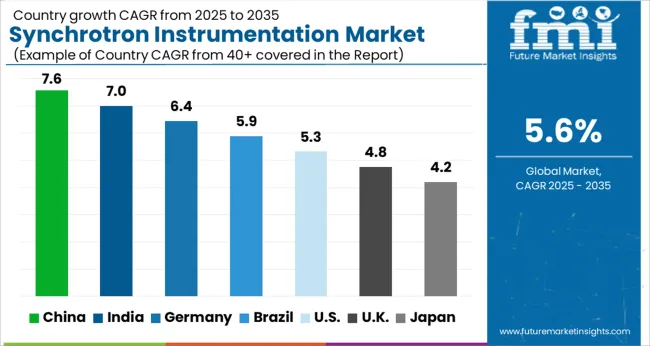
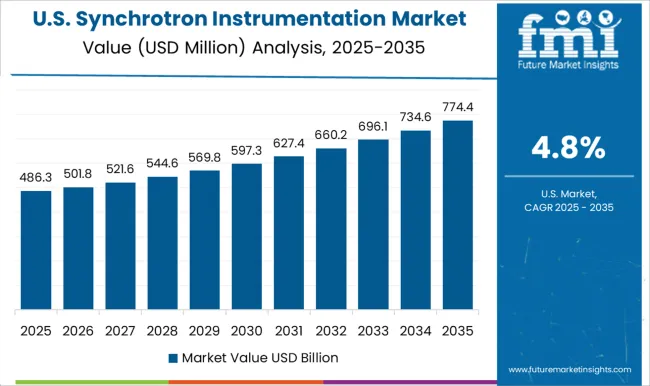
The USA dominated the global market with value share of around 21.5% in 2025 and is expected to register a CAGR of 5.7% during the forecast period.
Increasing research in the United States is the primary factors accelerating the regional dominance. The research areas and scientific disciplines driving the demand for synchrotron experiments can influence the market. Synchrotron facilities in the USA support a wide range of research fields, including materials science, chemistry, biology, physics, geosciences, environmental science, and more. The demand for synchrotron instrumentation may vary depending on the focus and priorities of these research areas.
Also, upgrades or expansions of existing synchrotron facilities can create opportunities for the market. As facilities aim to enhance their capabilities, they may invest in new instrumentation and technologies, driving demand in the market. For instance, the recent upgrade of the APS to the APS Upgrade (APS-U) project involves the construction of new beamlines and improved capabilities, which can lead to increased demand for instrumentation.
Japan is projected to be the most attractive market in the synchrotron instrumentation after USA with value share of 18.3% in 2025 globally. The Japanese market is an important part of the scientific instrument industry in Japan. Japan is home to the SPring-8 facility, which is one of the world's largest and most advanced synchrotron radiation facilities.
Increasing research and development funding in the region is the main factor to drive the demand of synchrotron instrumentation in the region. The availability and allocation of research funding from government agencies such as the Japan Society for the Promotion of Science (JSPS), the Ministry of Education, Culture, Sports, Science and Technology (MEXT), and other research funding bodies play a significant role in driving the demand for synchrotron instrumentation in Japan.
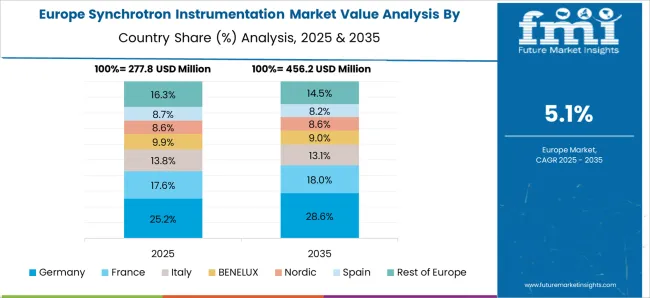
Germany dominated the European market for synchrotron instrumentation and accounted for around 27.3% of the market share in 2025. Technological development is the main factor stimulating the regional market. Advances in synchrotron instrumentation technology play a crucial role in market growth. Innovations that enhance instrument performance, resolution, data acquisition speed, and ease of use attract researchers and drive adoption.
Also, German manufacturers and research institutes contribute to technological advancements in synchrotron instrumentation.
The optical devices segment held the major chunk of about 75.8% in global market by the end of 2025. Optical devices are largely adopted in synchrotron instrumentation due to their ability to provide high precision, beam conditioning and shaping, excellent energy resolution, versatility, adaptability, and seamless integration with experimental techniques.
These optical components play a crucial role in manipulating and optimizing the synchrotron radiation beam for a wide range of scientific studies and applications. Hence, optical devices are largely adopted product option for synchrotron instrumentation.
The semiconductor research segment held the major chunk of about 16.7% in global market by the end of 2025. Synchrotron radiation sources provide intense and tunable X-rays that can be used to probe the structural, electronic, and optical properties of semiconductor materials.
Researchers can use synchrotron-based techniques such as X-ray diffraction, X-ray absorption spectroscopy, and X-ray photoelectron spectroscopy to investigate the crystal structure, chemical composition, and electronic band structure of semiconductors. This primary use of synchrotron in the various semiconductor research is driving the demand of synchrotron instrumentation in semiconductor research.
The electronic industry segment accounted for revenue share of 18.1% in the global market at the end of 2025. Synchrotron techniques are used in research related to energy storage and conversion devices, such as batteries and fuel cells. These techniques help scientists understand the atomic and electronic structure of electrode materials, interfaces, and reaction mechanisms, leading to the development of improved energy storage materials and more efficient conversion processes.
Also, synchrotron-based techniques aid in studying the characteristics and behavior of semiconductor materials, interfaces, and devices, providing valuable insights that can inform manufacturing processes, materials selection, and device design. Hence, synchrotron instrumentation is widely used by the electronic industry.
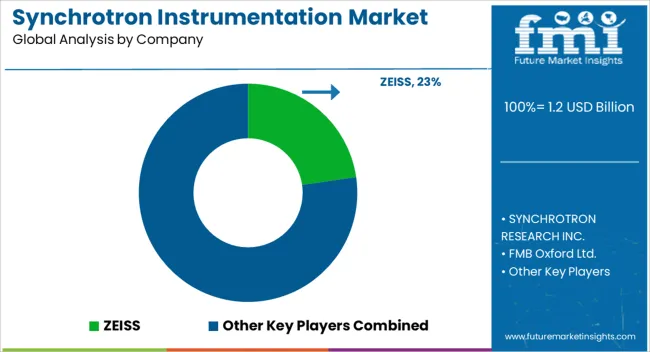
The market's major companies are concentrating on diversifying their product offerings to boost their market share in synchrotron instrumentation and to broaden their presence in developing economies. Market strategies, technological developments, conferences, acquisitions, and distribution agreements with other businesses are the main tactics used by manufacturers to obtain a competitive edge in the market.
For instance:
Similarly, recent developments have been tracked by the team at Future Market Insights related to companies in the synchrotron instrumentation market space, which are available in the full report
| Attribute | Details |
|---|---|
| Forecast Period | 2025 to 2035 |
| Historical Data Available for | 2020 to 2025 |
| Market Analysis | USD Million for Value |
| Key Regions Covered | North America; Europe; Asia Pacific; and the Rest of World |
| Key Countries Covered | USA, Canada, Germany, UK, France, Italy, Russia, the Rest of Europe, China, Japan, Australia, Thailand, the Rest of Asia Pacific, and the Rest of the World. |
| Key Segments Covered | Product, Application, End Use Industry, and Region |
| Key Companies Profiled | ZEISS; SYNCHROTRON RESEARCH INC.; FMB Oxford Ltd.; Rigaku Corporation; Quantum Design Inc.; TOP-UNISTAR (HK) SCIENCE & TECHNOLOGY CO., LTD.; Shimadzu Corporation; Proto Manufacturing; Agilent Technologies; HUBER Diffraktionstechnik GmbH & Co. KG; DECTRIS AG; Avaco; Rayonix, L.L.C.; AVS. Added Value Solutions; Xenocs; Malvern Panalytical Ltd; Alemnis; JJ X-Ray A/S; Thermofisher Scientific; Edwards Vacuum; G&H Group |
| Report Coverage | Market Forecast, Competition Intelligence, DROT Analysis, Market Dynamics and Challenges, Strategic Growth Initiatives |
| Customization & Pricing | Available upon Request |
The global synchrotron instrumentation market is estimated to be valued at USD 1.2 billion in 2025.
The market size for the synchrotron instrumentation market is projected to reach USD 2.0 billion by 2035.
The synchrotron instrumentation market is expected to grow at a 5.6% CAGR between 2025 and 2035.
The key product types in synchrotron instrumentation market are optical devices, _other beam line components, _mirrors, _objective lenses, _detectors, _diagnostics, _monochromators, _vacuum systems, instruments, _diffraction gratings systems/ diffractometer, _x-ray tomography, _small-angle x-ray scattering (saxs), _large area rapid imaging analytical tool (lariat), _sub-micron ct/xrm, _x-ray absorption spectroscopy (xas), _x-ray fluorescence (xrf), _spectrometers, _ftir, _nano-mechanical test instrumentation and _cryo-electron microscopy.
In terms of application, nanoparticles and colloids segment to command 41.2% share in the synchrotron instrumentation market in 2025.


Full Research Suite comprises of:
Market outlook & trends analysis
Interviews & case studies
Strategic recommendations
Vendor profiles & capabilities analysis
5-year forecasts
8 regions and 60+ country-level data splits
Market segment data splits
12 months of continuous data updates
DELIVERED AS:
PDF EXCEL ONLINE
Instrumentation Valve and Fitting Market Trends & Forecast for 2025 to 2035
Instrumentation and Control Devices Market Growth – Trends & Forecast 2024-2034
PLTC Instrumentation Cable Market Size and Share Forecast Outlook 2025 to 2035
Safety Instrumentation Systems Market – Trends & Forecast 2025 to 2035
Modular Instrumentation Platform Market Analysis - Size, Share, and Forecast Outlook 2025 to 2035
Process Instrumentation Market Growth - Trends & Forecast 2025 to 2035
Microplate Instrumentation and Supplies Market Growth - Trends & Forecast 2025 to 2035
Microplate Instrumentation and Systems Market Growth - Trends & Forecast 2025 to 2035
Geotechnical Instrumentation And Monitoring Market Size and Share Forecast Outlook 2025 to 2035
Chromatography Instrumentation Market Size and Share Forecast Outlook 2025 to 2035
Water Activity Instrumentation Market Size, Growth, and Forecast 2025 to 2035
Water Analysis Instrumentation Market Analysis – Size, Share, and Forecast 2025 to 2035
Water Automation & Instrumentation Market Trends & Forecast by Process Stage, Automation Technology, Instrumentation, End-User and Region through 2035
Process Automation and Instrumentation Market Size and Share Forecast Outlook 2025 to 2035
Evaluating Process Automation and Instrumentation Market Share & Provider Insights

Thank you!
You will receive an email from our Business Development Manager. Please be sure to check your SPAM/JUNK folder too.
Chat With
MaRIA