Sweetener Market Size and Share Forecast Outlook 2025 to 2035

The sweetener market is estimated to be valued at USD 11.2 billion in 2025 and is projected to reach USD 16.3 billion by 2035, registering a CAGR of 3.8% over the forecast period. The market is expected to add an absolute dollar opportunity of USD 5.1 billion during this period. This reflects a 1.45 times growth at a CAGR of 3.8%. The market evolution is expected to be shaped by increasing consumer demand for low-calorie and natural sweeteners, rising health awareness, and expansion in the processed food and beverage sectors.

By 2030, the market is projected to reach USD 13.5 billion, with an incremental gain of USD 2.3 billion in the first half of the decade. Between 2030 and 2035, an additional USD 3.5 billion is expected, highlighting steady growth supported by the proliferation of functional foods, innovative sugar alternatives, and favorable regulations in North America and Europe.

Companies, such as Tate & Lyle Plc, Kemin Industries, DuPont, Cargill, Ajinomoto Co., Archer Daniels Midland, Nestlé S.A., Wilmar International, Ingredion, Roquette Freres, JK Sucralose, Hermes Sweeteners, McNeil Nutritionals, Beijing Vitasweet, and Madhava Sweeteners, are strengthening market presence through product innovations, capacity expansions, and strategic partnerships. Sustainability, regulatory compliance, and clean-label trends are expected to remain central to market growth.
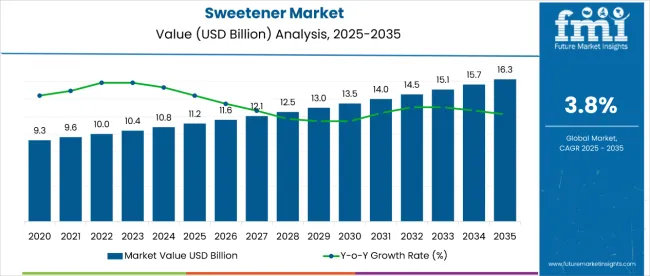
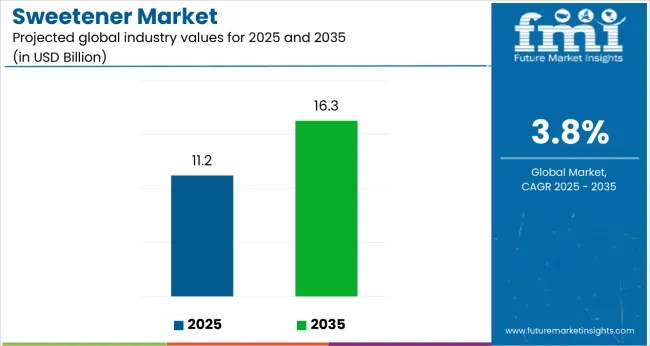
Sweetener Market Value Analysis

Quick Stats for Sweetener Market

  • Sweetener Market Value (2025): USD 11.2 billion
  • Sweetener Market Forecast Value (2035): USD 16.3 billion
  • Sweetener Market Forecast CAGR (2025 to 2035): 3.8%
  • Leading Segment in Sweetener Market (2025): Natural Sweeteners (42% share)
  • Key Growth Regions in Sweetener Market: North America, Europe, Asia-Pacific
  • Key Players in Sweetener Market: Tate & Lyle Plc, Kemin Industries, DuPont, Cargill, Ajinomoto, and Archer Daniels Midland

Sweetener Market

Metric Value
Estimated Size (2025E) USD 11.2 billion
Projected Value (2035F) USD 16.3 billion
CAGR (2025 to 2035) 3.8%

The market holds a strong position across its parent industries, reflecting its rising adoption in food and beverage, pharmaceuticals, and personal care sectors. Within the food and beverage category, natural sweeteners contribute significantly, accounting for about 42% of the market, driven by demand for low-calorie and clean-label products. In pharmaceuticals, sweeteners account for nearly 12% of the market, primarily used in syrups, chewable tablets, and nutraceuticals for taste-masking purposes. In personal care and cosmetics, sweeteners contribute an estimated 6%, fueled by applications in oral care, skincare, and health supplements. Overall, sweeteners hold close to 40% of the broader sugar substitute market, underlining their critical role in industrial and consumer applications.

The market is being driven by expanding demand in food and beverage industries, where sweeteners enhance product appeal, shelf-life, and nutritional positioning. Rising adoption in pharmaceutical formulations and functional foods is further boosting consumption. Innovations are being observed in natural, plant-based, and low-glycemic alternatives, aligning with health trends and regulatory standards. Developments include capacity expansions in Asia-Pacific, particularly in China, India, and Southeast Asia, to meet growing demand from manufacturing hubs and retail markets. Trends show a gradual shift toward sustainable, clean-label, and non-GMO sweeteners, though conventional and natural sweeteners continue to dominate due to their versatility, performance efficiency, and cost-effectiveness. Increasing regulatory emphasis on health, safety, and environmental compliance is shaping R&D strategies and influencing global competition among leading manufacturers.

Why is the Sweetener Market Growing?

Sweeteners unique ability to provide sweetness, functionality, and calorie management across diverse industries is driving their adoption. Their versatile properties make them indispensable in food and beverages, pharmaceuticals, and personal care products, where taste, product stability, and consumer health are critical.

Rising demand in the food and beverage sector, where sweeteners improve flavor, shelf-life, and nutritional appeal, is a key growth driver. Growth is further supported by expanding use in pharmaceutical syrups, chewable tablets, and nutraceuticals for taste masking, as well as in personal care products like oral care and health supplements. Technological innovations in natural, plant-based, low-glycemic, and clean-label sweeteners are enhancing both safety and health benefits, aligning with global regulatory trends and consumer preferences.

Increasing industrialization and rising middle-class consumption in Asia-Pacific, along with regulatory emphasis on sugar reduction, health-conscious formulations, and clean-label products in Europe and North America, are strengthening market prospects. As industries prioritize product quality, cost-effectiveness, and sustainability, sweeteners continue to gain traction. With leading manufacturers focusing on natural and functional innovations, strategic partnerships, and capacity expansion, the market is expected to witness steady and long-term growth across its parent industries.

Sweetener Market Analysis by Top Investment Segments

The market is segmented by product type, form, category, nature, end use, sales channel, and region. By product type, the market is categorized into natural sweeteners, artificial sweeteners, sucrose, novel sweeteners, and sugar alcohols. Based on form, the market is segmented into powder, liquid, and crystals. In terms of category, the market is bifurcated into high-intensity sweeteners and low-intensity sweeteners. By nature, the market is divided into organic and conventional sweeteners.

Based on end use, the market is segmented into food, beverages, pharmaceuticals, personal care, and other applications. By sales channel, the market is categorized into hypermarkets/supermarkets, convenience stores, specialty retail stores, traditional grocery retailers, online retailers, and other channels. Regionally, the market spans North America, Latin America, Western Europe, Eastern Europe, East Asia, South Asia & Pacific, and the Middle East & Africa.
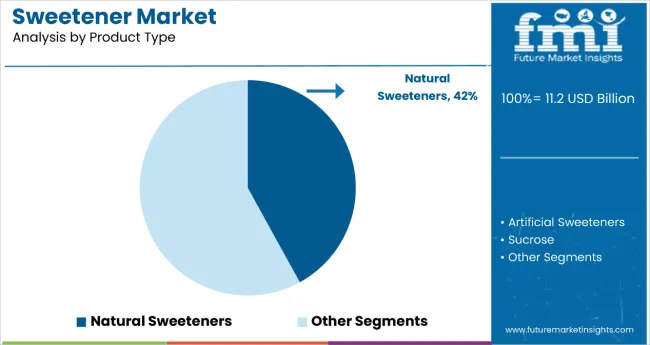
By Product Type, Natural Sweeteners Segment Accounts for 42% of the Market Share

Sweetener Market By Product Type

The natural sweeteners segment dominates the product type category with a 42% market share, supported by its widespread use as a healthier and clean-label alternative in food, beverages, and pharmaceutical applications. Its functional properties, including low-calorie content, natural origin, and compatibility with diverse formulations, make it indispensable for large-scale bakery, confectionery, and beverage production.

Natural sweeteners are extensively used in sugar-reduced and functional foods, soft drinks, dairy products, and nutraceuticals, owing to their ability to enhance taste, shelf-life, and nutritional value. The rising demand for health-conscious, low-glycemic, and clean-label products in both developed and emerging markets has positioned this segment as the primary growth driver.

Increasing investments in plant-based, organic, and non-GMO formulations, coupled with expanding production capacity in Asia-Pacific, North America, and Europe, are further strengthening demand. Manufacturers are focusing on sustainable and regulatory-compliant production to meet consumer and safety standards. With growing adoption in processed foods, beverages, and health-focused applications, the natural sweeteners segment is expected to remain the cornerstone of sweetener consumption in the coming decade.
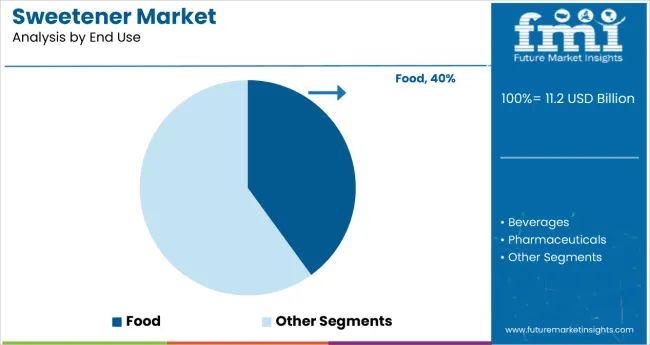
By End Use, Food Applications Segment Accounts for 40% of the Market Share

Sweetener Market By End Use

The food applications segment dominates the end-use category with a 40% market share, driven by high consumption of sweeteners in bakery, confectionery, dairy, snacks, and processed foods. These products form the backbone of the global food industry, where taste, texture, and nutritional appeal are critical.

Sweeteners are widely used to enhance flavor, reduce sugar content, and improve product shelf-life in both conventional and health-focused foods. The rising demand for healthier, low-calorie, and natural products in developed and emerging markets has positioned this segment as the primary growth driver.

Increasing industrial production, particularly in Asia-Pacific, North America, and Europe, coupled with growing consumer awareness and regulatory encouragement for sugar reduction, is further strengthening demand. Manufacturers are focusing on innovative, high-purity, and clean-label sweetener solutions to meet industrial, nutritional, and environmental requirements. With expanding applications in bakery, beverages, snacks, and dairy, the food applications segment is expected to remain the cornerstone of sweetener consumption in the coming decade.

What are the Drivers, Restraints, and Key Trends of the Sweetener Market?

In 2025, global sweetener demand is estimated at USD 11.2 billion, with Asia-Pacific accounting for nearly 35 to 40% of total consumption. Applications include food, beverages, pharmaceuticals, personal care, and other specialty products. Manufacturers are focusing on natural, organic, plant-based, and clean-label formulations to meet regulatory compliance and consumer demand. Cost-effectiveness, functional versatility, and ability to provide low-calorie and sugar-reduction benefits across multiple industries continue to support market penetration. Specialty and sustainable sweeteners are increasingly being deployed in nutraceuticals, functional foods, and health-oriented beverages, further supporting adoption.

Growing Food and Beverage Demand Drives Sweetener Adoption

The food and beverage sector is the largest consumer of sweeteners, leveraging their flavor-enhancing, sugar-reduction, and shelf-life-extending properties. With global industrial output and processed food production on the rise, sweeteners are witnessing expanded demand. Natural sweeteners, in particular, account for a significant share of applications due to their health benefits, clean-label appeal, and versatility. The ability of sweeteners to improve taste, texture, and nutritional value continues to anchor their adoption. Expanding bakery, confectionery, beverage, and dairy manufacturing in Asia-Pacific, North America, and Europe further strengthens growth prospects.

Regulatory and Health Factors Restrain Expansion

Growth faces limitations due to increasing health and safety regulations, sugar-reduction guidelines, and volatility in raw material prices. Compliance with labeling, food safety, and organic certification standards requires additional investment in production and quality control. Consumer concerns over artificial sweeteners and synthetic additives in certain regions have led to stricter regulations, particularly in Europe and North America. Additionally, dependency on raw materials such as sugar alcohols, stevia extracts, and high-intensity sweeteners presents supply chain challenges. These restraints are encouraging manufacturers to develop clean-label, natural, and eco-friendly formulations while balancing cost-effectiveness and industrial performance.
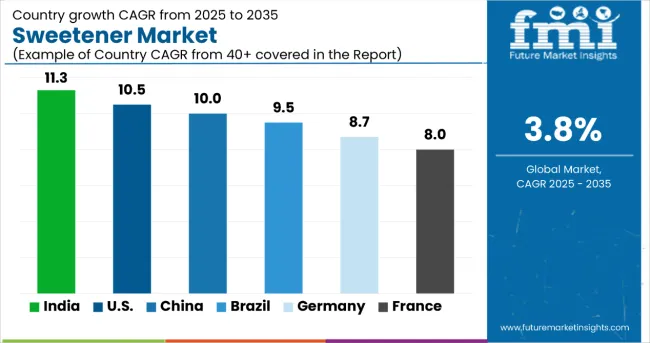
Sweetener Market Analysis by Top Countries

Sweetener Market By Country

Country CAGR (2025 to 2035)
India 11.3%
USA 10.5%
China 10.0%
Brazil 9.5%
Germany 8.7%
France 8.0%

The sweetener market shows varied growth trajectories across the top six countries. India leads with the highest projected CAGR of 11.3% from 2025 to 2035, supported by rising demand for processed foods, beverages, and natural sweeteners. The USA follows at 10.5%, driven by health-conscious consumer trends, sugar-reduction initiatives, and clean-label adoption. China maintains strong growth at 10.0%, fueled by increasing consumption in bakery, confectionery, and beverage industries. Meanwhile, Brazil (9.5%), Germany (8.7%), and France (8.0%) experience steady growth, reflecting established markets, regulatory support for low-calorie products, and rising adoption of organic and natural alternatives.

The report covers an in-depth analysis of 40+ countries; six top-performing markets are highlighted below.

Growth Outlook of the Sweetener Market in India

The sweetener market in India is projected to expand at a CAGR of 11.3% from 2025 to 2035, fueled by rapid growth in food and beverage manufacturing, functional foods, and health-oriented product lines. Manufacturers are investing in natural, plant-based, and organic sweeteners to meet rising consumer demand and regulatory standards. The country’s expanding bakery, dairy, beverage, and nutraceutical industries are driving adoption of low-calorie and clean-label alternatives, while exports of processed foods further strengthen market growth.

Key Statistics:

  • 38% of sweetener consumption originates from bakery and confectionery applications
  • 2.5 million tons consumed in food and beverage applications in 2025
  • USD 500 million invested in natural, organic, and high-purity sweetener production

Expansion of Sweetener Applications in the USA

Sales of sweeteners in the USA are expected to grow at a CAGR of 10.5% from 2025 to 2035, supported by increasing demand for sugar-reduced and functional foods and beverages. Adoption of low-calorie, natural, and clean-label sweeteners is rising to comply with FDA guidelines and consumer preferences. Strong demand in confectionery, dairy, beverages, and nutraceuticals is driving investments in advanced production technologies, while innovation in high-intensity and sugar alcohol sweeteners enhances market growth.

Key Statistics:

  • 32% of sweeteners used in beverages and confectionery
  • USD 1.1 billion invested in natural and low-calorie sweetener production
  • 28% of sweeteners applied in functional foods and nutraceutical products

Dynamics of the Sweetener Market in China

Revenue from sweeteners in China is projected to grow at a CAGR of 10.0% from 2025 to 2035, fueled by rising demand in processed foods, beverages, and pharmaceutical syrups. Manufacturers are focusing on organic, natural, and high-purity formulations to meet domestic standards and export requirements. The country’s expanding bakery, confectionery, and beverage industries, along with growing health-conscious consumer trends, are driving adoption of low-calorie sweeteners.

Key Statistics:

  • 40% of sweetener consumption comes from bakery and beverage applications
  • USD 950 million invested in natural and clean-label sweeteners
  • 35% used in confectionery and dairy applications

Brazil Sweetener Market Outlook

Sales of sweeteners in Brazil are expected to grow at a CAGR of 9.5% from 2025 to 2035, supported by expanding food and beverage industries and rising adoption of sugar alternatives in processed foods. Increasing awareness of obesity and diabetes is driving demand for low-calorie and natural sweeteners, while manufacturers invest in plant-based, clean-label, and organic products to meet regulatory and consumer expectations.

Key Statistics:

  • 36% of sweeteners used in beverages and bakery
  • USD 420 million allocated to natural and functional sweetener production
  • 30% used in dairy and confectionery applications

Growth Assessment of the Sweetener Market in Germany

The sweetener market in Germany is projected to expand at a CAGR of 8.7% from 2025 to 2035, driven by consumer demand for low-calorie, organic, and clean-label products. Manufacturers focus on natural, high-intensity, and plant-based sweeteners to comply with strict EU regulations and meet industrial needs. Expanding applications in bakery, beverages, and functional foods strengthen market adoption, while innovation in sustainable production supports competitive positioning.

Key Statistics:

  • 32% consumed in beverages and confectionery
  • USD 310 million invested in high-purity and organic sweetener production
  • 28% used in bakery, dairy, and functional food applications

Clean-Label Demand of the Sweetener Market in France

Demand for sweeteners in France is projected to grow at a CAGR of 8.0% from 2025 to 2035, supported by expanding processed food, beverage, and nutraceutical industries. Manufacturers emphasize organic, natural, and low-calorie sweeteners to meet consumer preferences and regulatory requirements. Growing functional food and beverage consumption, along with export opportunities in Europe, are strengthening market growth.

Key Statistics:
  • 30% consumed in bakery and beverages
  • USD 250 million allocated to natural and clean-label sweetener production
  • 28% applied in dairy, confectionery, and functional foods

Competitive Landscape of the Sweetener Market

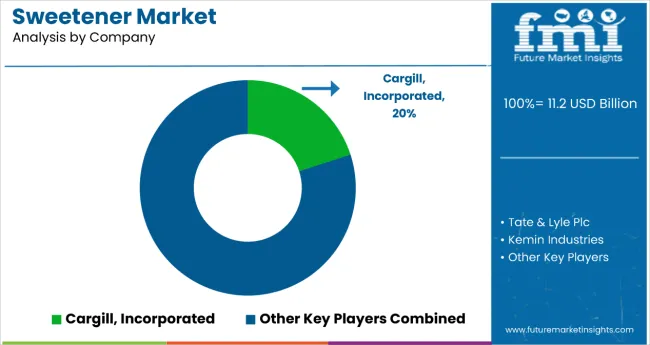
Sweetener Market By Company

The market is moderately consolidated, comprising multinational food and ingredient corporations, regional producers, and specialized sweetener manufacturers. Key players include Tate & Lyle Plc, Kemin Industries, DuPont, Cargill, Incorporated, Ajinomoto Co., Inc., Archer Daniels Midland Company, Nestlé S.A., Wilmar International Limited, Ingredion Incorporated, Roquette Freres, JK Sucralose, Hermes Sweeteners Ltd., McNeil Nutritionals, Beijing Vitasweet Co. Ltd., and Madhava Sweeteners. These companies leverage advanced production technologies, extensive R&D capabilities, and wide distribution networks to serve applications across food, beverages, pharmaceuticals, personal care, and functional foods.

The market is characterized by a significant share of natural, organic, and high-intensity sweeteners, which accounted for over 60% of total consumption in 2025. These grades are preferred due to their health benefits, clean-label appeal, and regulatory compliance. Conventional and artificial sweeteners remain widely used in beverages, confectionery, and processed foods, while natural and specialty grades are increasingly adopted in nutraceuticals, functional foods, and low-calorie products.

Strategic initiatives such as mergers and acquisitions, joint ventures, regional expansions, and product innovation are common among market participants aiming to strengthen their global footprint. Additionally, companies are investing in sustainable production processes, eco-friendly formulations, and high-purity natural sweeteners to meet evolving regulatory standards and consumer demand. Overall, the sweetener market continues to evolve as established and emerging players focus on technological innovation, clean-label solutions, and expansion into high-growth segments, shaping the competitive landscape.

Scope of Report

Items Values
Quantitative Units (2025) USD 11.2 billion
Product Type Natural Sweeteners, Artificial Sweeteners, Sucrose, Novel Sweeteners, and Sugar Alcohol
Form Powder, Liquid, and Crystals
Category High-Intensity Sweeteners and Low-Intensity Sweeteners
Nature Organic and Conventional
End Use Food, Beverages, Pharmaceuticals, Personal Care, and Other Applications
Sales Channel Hypermarkets / Supermarkets, Convenience Stores, Specialty Retail Stores, Traditional Grocery Retailers, Online Retailers, and Other Channels
Regions Covered North America, Latin America, Western Europe, Eastern Europe, South Asia and Pacific, East Asia, and Middle East & Africa
Country Covered United States, Canada, United Kingdom, Germany, France, China, Japan, South Korea, Brazil, Australia and 40+ countries
Key Companies Profiled Tate & Lyle Plc, Kemin Industries, DuPont, Cargill, Incorporated, Ajinomoto Co., Inc., Archer Daniels Midland Company, Nestlé S.A., Wilmar International Limited, Ingredion Incorporated, Roquette Freres, JK Sucralose, Hermes Sweeteners Ltd., McNeil Nutritionals, Beijing Vitasweet Co. Ltd., and Madhava Sweeteners
Additional Attributes Dollar sales by product type, form, and application; regional demand trends; competitive landscape; consumer preferences for natural versus artificial sweeteners; integration with clean-label and sustainable production practices; innovations in high-purity, organic, and functional sweeteners; quality standardization across food, beverage, pharmaceutical, and personal care applications

Key Segmentation

By Product Type:

  • Natural Sweeteners
    • Stevia
    • Palm Sugar
    • Coconut Sugar
    • Honey
    • Maple Syrup
    • Monk Fruit Sugar
    • Agave Syrup
    • Lucuma Fruit Sugar
    • Molasses
    • Other Natural Sweeteners
  • Artificial Sweeteners
    • Acesulfame Potassium
    • Aspartame
    • Neotame
    • Advantame
    • Saccharin
    • Sucralose
    • Other Artificial Sweeteners
  • Sucrose
  • Novel Sweeteners
  • Sugar Alcohol

By Category:

  • High Intensity Sweetener
  • Low Intensity Sweetener

By Form:

  • Powder
  • Liquid
  • Crystals

By Nature:

  • Organic
  • Conventional

By Application:

  • Food
    • Bakery Goods
    • Sweet Spreads
    • Confectionery and Chewing Gums
    • Dairy Products
    • Others
  • Beverages
    • Carbonated Drinks
    • Fruit Drinks & Juice
    • Sports & Energy Drinks
    • Powdered Drinks and Mixes
    • Others
  • Pharmaceuticals
  • Personal Care
  • Other Applications

By Sales Channel:

  • Hypermarkets / Supermarkets
  • Convenience Stores
  • Specialty Retail Stores
  • Traditional Grocery Retailers
  • Online Retailers
  • Other Channels

By Region:

  • South Asia
  • East Asia
  • Oceania
  • North America
  • Latin America
  • Europe
  • Middle East and Africa

Table of Content

  1. Executive Summary
    • Global Market Outlook
    • Demand-side Trends
    • Supply-side Trends
    • Technology Roadmap Analysis
    • Analysis and Recommendations
  2. Market Overview
    • Market Coverage / Taxonomy
    • Market Definition / Scope / Limitations
  3. Market Background
    • Market Dynamics
      • Drivers
      • Restraints
      • Opportunity
      • Trends
    • Scenario Forecast
      • Demand in Optimistic Scenario
      • Demand in Likely Scenario
      • Demand in Conservative Scenario
    • Opportunity Map Analysis
    • Product Life Cycle Analysis
    • Supply Chain Analysis
      • Supply Side Participants and their Roles
        • Producers
        • Mid-Level Participants (Traders/ Agents/ Brokers)
        • Wholesalers and Distributors
      • Value Added and Value Created at Node in the Supply Chain
      • List of Raw Material Suppliers
      • List of Existing and Potential Buyer’s
    • Investment Feasibility Matrix
    • Value Chain Analysis
      • Profit Margin Analysis
      • Wholesalers and Distributors
      • Retailers
    • PESTLE and Porter’s Analysis
    • Regulatory Landscape
      • By Key Regions
      • By Key Countries
    • Regional Parent Market Outlook
    • Production and Consumption Statistics
    • Import and Export Statistics
  4. Global Market Analysis 2020 to 2024 and Forecast, 2025 to 2035
    • Historical Market Size Value (USD Billion) & Volume (Metric Tons) Analysis, 2020 to 2024
    • Current and Future Market Size Value (USD Billion) & Volume (Metric Tons) Projections, 2025 to 2035
      • Y-o-Y Growth Trend Analysis
      • Absolute $ Opportunity Analysis
  5. Global Market Pricing Analysis 2020 to 2024 and Forecast 2025 to 2035
  6. Global Market Analysis 2020 to 2024 and Forecast 2025 to 2035, By Product Type
    • Introduction / Key Findings
    • Historical Market Size Value (USD Billion) & Volume (Metric Tons) Analysis By Product Type, 2020 to 2024
    • Current and Future Market Size Value (USD Billion) & Volume (Metric Tons) Analysis and Forecast By Product Type, 2025 to 2035
      • Natural Sweeteners
      • Artificial Sweeteners
      • Sucrose
      • Novel Sweeteners
      • Sugar Alcohol
    • Y-o-Y Growth Trend Analysis By Product Type, 2020 to 2024
    • Absolute $ Opportunity Analysis By Product Type, 2025 to 2035
  7. Global Market Analysis 2020 to 2024 and Forecast 2025 to 2035, By Form
    • Introduction / Key Findings
    • Historical Market Size Value (USD Billion) & Volume (Metric Tons) Analysis By Form, 2020 to 2024
    • Current and Future Market Size Value (USD Billion) & Volume (Metric Tons) Analysis and Forecast By Form, 2025 to 2035
      • Powder
      • Liquid
      • Crystals
    • Y-o-Y Growth Trend Analysis By Form, 2020 to 2024
    • Absolute $ Opportunity Analysis By Form, 2025 to 2035
  8. Global Market Analysis 2020 to 2024 and Forecast 2025 to 2035, By Category
    • Introduction / Key Findings
    • Historical Market Size Value (USD Billion) & Volume (Metric Tons) Analysis By Category, 2020 to 2024
    • Current and Future Market Size Value (USD Billion) & Volume (Metric Tons) Analysis and Forecast By Category, 2025 to 2035
      • High Intensity Sweetener
      • Low Intensity Sweetener
    • Y-o-Y Growth Trend Analysis By Category, 2020 to 2024
    • Absolute $ Opportunity Analysis By Category, 2025 to 2035
  9. Global Market Analysis 2020 to 2024 and Forecast 2025 to 2035, By Nature
    • Introduction / Key Findings
    • Historical Market Size Value (USD Billion) & Volume (Metric Tons) Analysis By Nature, 2020 to 2024
    • Current and Future Market Size Value (USD Billion) & Volume (Metric Tons) Analysis and Forecast By Nature, 2025 to 2035
      • Organic
      • Conventional
    • Y-o-Y Growth Trend Analysis By Nature, 2020 to 2024
    • Absolute $ Opportunity Analysis By Nature, 2025 to 2035
  10. Global Market Analysis 2020 to 2024 and Forecast 2025 to 2035, By End Use
    • Introduction / Key Findings
    • Historical Market Size Value (USD Billion) & Volume (Metric Tons) Analysis By End Use, 2020 to 2024
    • Current and Future Market Size Value (USD Billion) & Volume (Metric Tons) Analysis and Forecast By End Use, 2025 to 2035
      • Food
      • Beverages
      • Pharmaceuticals
      • Personal Care
      • Other Applications
    • Y-o-Y Growth Trend Analysis By End Use, 2020 to 2024
    • Absolute $ Opportunity Analysis By End Use, 2025 to 2035
  11. Global Market Analysis 2020 to 2024 and Forecast 2025 to 2035, By Sales Channel
    • Introduction / Key Findings
    • Historical Market Size Value (USD Billion) & Volume (Metric Tons) Analysis By Sales Channel, 2020 to 2024
    • Current and Future Market Size Value (USD Billion) & Volume (Metric Tons) Analysis and Forecast By Sales Channel, 2025 to 2035
      • Hypermarkets / Supermarkets
      • Convenience Stores
      • Specialty Retail Stores
      • Traditional Grocery Retailers
      • Online Retailers
      • Other Channels
    • Y-o-Y Growth Trend Analysis By Sales Channel, 2020 to 2024
    • Absolute $ Opportunity Analysis By Sales Channel, 2025 to 2035
  12. Global Market Analysis 2020 to 2024 and Forecast 2025 to 2035, By Region
    • Introduction
    • Historical Market Size Value (USD Billion) & Volume (Metric Tons) Analysis By Region, 2020 to 2024
    • Current Market Size Value (USD Billion) & Volume (Metric Tons) Analysis and Forecast By Region, 2025 to 2035
      • North America
      • Latin America
      • Western Europe
      • Eastern Europe
      • East Asia
      • South Asia & Pacific
      • Middle East and Africa
    • Market Attractiveness Analysis By Region
  13. North America Market Analysis 2020 to 2024 and Forecast 2025 to 2035, By Country
    • Historical Market Size Value (USD Billion) & Volume (Metric Tons) Trend Analysis By Market Taxonomy, 2020 to 2024
    • Market Size Value (USD Billion) & Volume (Metric Tons) Forecast By Market Taxonomy, 2025 to 2035
      • By Country
        • USA
        • Canada
        • Mexico
      • By Product Type
      • By Form
      • By Category
      • By Nature
      • By End Use
      • By Sales Channel
    • Market Attractiveness Analysis
      • By Country
      • By Product Type
      • By Form
      • By Category
      • By Nature
      • By End Use
      • By Sales Channel
    • Key Takeaways
  14. Latin America Market Analysis 2020 to 2024 and Forecast 2025 to 2035, By Country
    • Historical Market Size Value (USD Billion) & Volume (Metric Tons) Trend Analysis By Market Taxonomy, 2020 to 2024
    • Market Size Value (USD Billion) & Volume (Metric Tons) Forecast By Market Taxonomy, 2025 to 2035
      • By Country
        • Brazil
        • Argentina
        • Rest of LATAM
      • By Product Type
      • By Form
      • By Category
      • By Nature
      • By End Use
      • By Sales Channel
    • Market Attractiveness Analysis
      • By Country
      • By Product Type
      • By Form
      • By Category
      • By Nature
      • By End Use
      • By Sales Channel
    • Key Takeaways
  15. Western Europe Market Analysis 2020 to 2024 and Forecast 2025 to 2035, By Country
    • Historical Market Size Value (USD Billion) & Volume (Metric Tons) Trend Analysis By Market Taxonomy, 2020 to 2024
    • Market Size Value (USD Billion) & Volume (Metric Tons) Forecast By Market Taxonomy, 2025 to 2035
      • By Country
        • Germany
        • Italy
        • France
        • UK
        • Spain
        • BENELUX
        • Nordic
        • Rest of W.Europe
      • By Product Type
      • By Form
      • By Category
      • By Nature
      • By End Use
      • By Sales Channel
    • Market Attractiveness Analysis
      • By Country
      • By Product Type
      • By Form
      • By Category
      • By Nature
      • By End Use
      • By Sales Channel
    • Key Takeaways
  16. Eastern Europe Market Analysis 2020 to 2024 and Forecast 2025 to 2035, By Country
    • Historical Market Size Value (USD Billion) & Volume (Metric Tons) Trend Analysis By Market Taxonomy, 2020 to 2024
    • Market Size Value (USD Billion) & Volume (Metric Tons) Forecast By Market Taxonomy, 2025 to 2035
      • By Country
        • Russia
        • Hungary
        • Poland
        • Balkan & Baltics
        • Rest of E. Europe
      • By Product Type
      • By Form
      • By Category
      • By Nature
      • By End Use
      • By Sales Channel
    • Market Attractiveness Analysis
      • By Country
      • By Product Type
      • By Form
      • By Category
      • By Nature
      • By End Use
      • By Sales Channel
    • Key Takeaways
  17. East Asia Market Analysis 2020 to 2024 and Forecast 2025 to 2035, By Country
    • Historical Market Size Value (USD Billion) & Volume (Metric Tons) Trend Analysis By Market Taxonomy, 2020 to 2024
    • Market Size Value (USD Billion) & Volume (Metric Tons) Forecast By Market Taxonomy, 2025 to 2035
      • By Country
        • China
        • Japan
        • South Korea
      • By Product Type
      • By Form
      • By Category
      • By Nature
      • By End Use
      • By Sales Channel
    • Market Attractiveness Analysis
      • By Country
      • By Product Type
      • By Form
      • By Category
      • By Nature
      • By End Use
      • By Sales Channel
    • Key Takeaways
  18. South Asia & Pacific Market Analysis 2020 to 2024 and Forecast 2025 to 2035, By Country
    • Historical Market Size Value (USD Billion) & Volume (Metric Tons) Trend Analysis By Market Taxonomy, 2020 to 2024
    • Market Size Value (USD Billion) & Volume (Metric Tons) Forecast By Market Taxonomy, 2025 to 2035
      • By Country
        • India
        • Australia & New Zealand
        • ASEAN
        • Rest of SAP
      • By Product Type
      • By Form
      • By Category
      • By Nature
      • By End Use
      • By Sales Channel
    • Market Attractiveness Analysis
      • By Country
      • By Product Type
      • By Form
      • By Category
      • By Nature
      • By End Use
      • By Sales Channel
    • Key Takeaways
  19. Middle East and Africa Market Analysis 2020 to 2024 and Forecast 2025 to 2035, By Country
    • Historical Market Size Value (USD Billion) & Volume (Metric Tons) Trend Analysis By Market Taxonomy, 2020 to 2024
    • Market Size Value (USD Billion) & Volume (Metric Tons) Forecast By Market Taxonomy, 2025 to 2035
      • By Country
        • GCC Countries
        • Northern Africa
        • South Africa
        • Turkiye
        • Rest of MEA
      • By Product Type
      • By Form
      • By Category
      • By Nature
      • By End Use
      • By Sales Channel
    • Market Attractiveness Analysis
      • By Country
      • By Product Type
      • By Form
      • By Category
      • By Nature
      • By End Use
      • By Sales Channel
    • Key Takeaways
  20. Key Countries Market Analysis
    • USA
      • Pricing Analysis
      • Market Share Analysis, 2024
        • By Product Type
        • By Form
        • By Category
        • By Nature
        • By End Use
        • By Sales Channel
    • Canada
      • Pricing Analysis
      • Market Share Analysis, 2024
        • By Product Type
        • By Form
        • By Category
        • By Nature
        • By End Use
        • By Sales Channel
    • Brazil
      • Pricing Analysis
      • Market Share Analysis, 2024
        • By Product Type
        • By Form
        • By Category
        • By Nature
        • By End Use
        • By Sales Channel
    • Mexico
      • Pricing Analysis
      • Market Share Analysis, 2024
        • By Product Type
        • By Form
        • By Category
        • By Nature
        • By End Use
        • By Sales Channel
    • Argentina
      • Pricing Analysis
      • Market Share Analysis, 2024
        • By Product Type
        • By Form
        • By Category
        • By Nature
        • By End Use
        • By Sales Channel
  21. Market Structure Analysis
    • Competition Dashboard
    • Competition Benchmarking
    • Market Share Analysis of Top Players
      • By Regional
      • By Product Type
      • By Form
      • By Category
      • By Nature
      • By End Use
      • By Sales Channel
  22. Competition Analysis
    • Competition Deep Dive
      • Tate & Lyle Plc
        • Overview
        • Product Portfolio
        • Profitability by Market Segments (Product/Age /Sales Channel/Region)
        • Sales Footprint
        • Strategy Overview
          • Marketing Strategy
          • Product Strategy
          • Channel Strategy
      • Kemin Industries
        • Overview
        • Product Portfolio
        • Profitability by Market Segments (Product/Age /Sales Channel/Region)
        • Sales Footprint
        • Strategy Overview
          • Marketing Strategy
          • Product Strategy
          • Channel Strategy
      • DuPont
        • Overview
        • Product Portfolio
        • Profitability by Market Segments (Product/Age /Sales Channel/Region)
        • Sales Footprint
        • Strategy Overview
          • Marketing Strategy
          • Product Strategy
          • Channel Strategy
      • Cargill, Incorporated
        • Overview
        • Product Portfolio
        • Profitability by Market Segments (Product/Age /Sales Channel/Region)
        • Sales Footprint
        • Strategy Overview
          • Marketing Strategy
          • Product Strategy
          • Channel Strategy
      • Ajinomoto Co., Inc.
        • Overview
        • Product Portfolio
        • Profitability by Market Segments (Product/Age /Sales Channel/Region)
        • Sales Footprint
        • Strategy Overview
          • Marketing Strategy
          • Product Strategy
          • Channel Strategy
      • Archer Daniels Midland Company
        • Overview
        • Product Portfolio
        • Profitability by Market Segments (Product/Age /Sales Channel/Region)
        • Sales Footprint
        • Strategy Overview
          • Marketing Strategy
          • Product Strategy
          • Channel Strategy
      • Nestlé S.A.
        • Overview
        • Product Portfolio
        • Profitability by Market Segments (Product/Age /Sales Channel/Region)
        • Sales Footprint
        • Strategy Overview
          • Marketing Strategy
          • Product Strategy
          • Channel Strategy
      • Wilmar International Limited
        • Overview
        • Product Portfolio
        • Profitability by Market Segments (Product/Age /Sales Channel/Region)
        • Sales Footprint
        • Strategy Overview
          • Marketing Strategy
          • Product Strategy
          • Channel Strategy
      • Ingredion Incorporated
        • Overview
        • Product Portfolio
        • Profitability by Market Segments (Product/Age /Sales Channel/Region)
        • Sales Footprint
        • Strategy Overview
          • Marketing Strategy
          • Product Strategy
          • Channel Strategy
      • Roquette Freres
        • Overview
        • Product Portfolio
        • Profitability by Market Segments (Product/Age /Sales Channel/Region)
        • Sales Footprint
        • Strategy Overview
          • Marketing Strategy
          • Product Strategy
          • Channel Strategy
      • JK Sucralose
        • Overview
        • Product Portfolio
        • Profitability by Market Segments (Product/Age /Sales Channel/Region)
        • Sales Footprint
        • Strategy Overview
          • Marketing Strategy
          • Product Strategy
          • Channel Strategy
      • Hermes Sweeteners Ltd.
        • Overview
        • Product Portfolio
        • Profitability by Market Segments (Product/Age /Sales Channel/Region)
        • Sales Footprint
        • Strategy Overview
          • Marketing Strategy
          • Product Strategy
          • Channel Strategy
      • McNeil Nutritionals
        • Overview
        • Product Portfolio
        • Profitability by Market Segments (Product/Age /Sales Channel/Region)
        • Sales Footprint
        • Strategy Overview
          • Marketing Strategy
          • Product Strategy
          • Channel Strategy
      • Beijing Vitasweet Co. Ltd.
        • Overview
        • Product Portfolio
        • Profitability by Market Segments (Product/Age /Sales Channel/Region)
        • Sales Footprint
        • Strategy Overview
          • Marketing Strategy
          • Product Strategy
          • Channel Strategy
      • Madhava Sweeteners
        • Overview
        • Product Portfolio
        • Profitability by Market Segments (Product/Age /Sales Channel/Region)
        • Sales Footprint
        • Strategy Overview
          • Marketing Strategy
          • Product Strategy
          • Channel Strategy
  23. Assumptions & Acronyms Used
  24. Research Methodology

List of Tables

  • Table 1: Global Market Value (USD Billion) Forecast by Region, 2020-2035
  • Table 2: Global Market Volume (Metric Tons) Forecast by Region, 2020-2035
  • Table 3: Global Market Value (USD Billion) Forecast by Product Type, 2020-2035
  • Table 4: Global Market Volume (Metric Tons) Forecast by Product Type, 2020-2035
  • Table 5: Global Market Value (USD Billion) Forecast by Form, 2020-2035
  • Table 6: Global Market Volume (Metric Tons) Forecast by Form, 2020-2035
  • Table 7: Global Market Value (USD Billion) Forecast by Category, 2020-2035
  • Table 8: Global Market Volume (Metric Tons) Forecast by Category, 2020-2035
  • Table 9: Global Market Value (USD Billion) Forecast by Nature, 2020-2035
  • Table 10: Global Market Volume (Metric Tons) Forecast by Nature, 2020-2035
  • Table 11: Global Market Value (USD Billion) Forecast by End Use, 2020-2035
  • Table 12: Global Market Volume (Metric Tons) Forecast by End Use, 2020-2035
  • Table 13: Global Market Value (USD Billion) Forecast by Sales Channel, 2020-2035
  • Table 14: Global Market Volume (Metric Tons) Forecast by Sales Channel, 2020-2035
  • Table 15: North America Market Value (USD Billion) Forecast by Country, 2020-2035
  • Table 16: North America Market Volume (Metric Tons) Forecast by Country, 2020-2035
  • Table 17: North America Market Value (USD Billion) Forecast by Product Type, 2020-2035
  • Table 18: North America Market Volume (Metric Tons) Forecast by Product Type, 2020-2035
  • Table 19: North America Market Value (USD Billion) Forecast by Form, 2020-2035
  • Table 20: North America Market Volume (Metric Tons) Forecast by Form, 2020-2035
  • Table 21: North America Market Value (USD Billion) Forecast by Category, 2020-2035
  • Table 22: North America Market Volume (Metric Tons) Forecast by Category, 2020-2035
  • Table 23: North America Market Value (USD Billion) Forecast by Nature, 2020-2035
  • Table 24: North America Market Volume (Metric Tons) Forecast by Nature, 2020-2035
  • Table 25: North America Market Value (USD Billion) Forecast by End Use, 2020-2035
  • Table 26: North America Market Volume (Metric Tons) Forecast by End Use, 2020-2035
  • Table 27: North America Market Value (USD Billion) Forecast by Sales Channel, 2020-2035
  • Table 28: North America Market Volume (Metric Tons) Forecast by Sales Channel, 2020-2035
  • Table 29: Latin America Market Value (USD Billion) Forecast by Country, 2020-2035
  • Table 30: Latin America Market Volume (Metric Tons) Forecast by Country, 2020-2035
  • Table 31: Latin America Market Value (USD Billion) Forecast by Product Type, 2020-2035
  • Table 32: Latin America Market Volume (Metric Tons) Forecast by Product Type, 2020-2035
  • Table 33: Latin America Market Value (USD Billion) Forecast by Form, 2020-2035
  • Table 34: Latin America Market Volume (Metric Tons) Forecast by Form, 2020-2035
  • Table 35: Latin America Market Value (USD Billion) Forecast by Category, 2020-2035
  • Table 36: Latin America Market Volume (Metric Tons) Forecast by Category, 2020-2035
  • Table 37: Latin America Market Value (USD Billion) Forecast by Nature, 2020-2035
  • Table 38: Latin America Market Volume (Metric Tons) Forecast by Nature, 2020-2035
  • Table 39: Latin America Market Value (USD Billion) Forecast by End Use, 2020-2035
  • Table 40: Latin America Market Volume (Metric Tons) Forecast by End Use, 2020-2035
  • Table 41: Latin America Market Value (USD Billion) Forecast by Sales Channel, 2020-2035
  • Table 42: Latin America Market Volume (Metric Tons) Forecast by Sales Channel, 2020-2035
  • Table 43: Western Europe Market Value (USD Billion) Forecast by Country, 2020-2035
  • Table 44: Western Europe Market Volume (Metric Tons) Forecast by Country, 2020-2035
  • Table 45: Western Europe Market Value (USD Billion) Forecast by Product Type, 2020-2035
  • Table 46: Western Europe Market Volume (Metric Tons) Forecast by Product Type, 2020-2035
  • Table 47: Western Europe Market Value (USD Billion) Forecast by Form, 2020-2035
  • Table 48: Western Europe Market Volume (Metric Tons) Forecast by Form, 2020-2035
  • Table 49: Western Europe Market Value (USD Billion) Forecast by Category, 2020-2035
  • Table 50: Western Europe Market Volume (Metric Tons) Forecast by Category, 2020-2035
  • Table 51: Western Europe Market Value (USD Billion) Forecast by Nature, 2020-2035
  • Table 52: Western Europe Market Volume (Metric Tons) Forecast by Nature, 2020-2035
  • Table 53: Western Europe Market Value (USD Billion) Forecast by End Use, 2020-2035
  • Table 54: Western Europe Market Volume (Metric Tons) Forecast by End Use, 2020-2035
  • Table 55: Western Europe Market Value (USD Billion) Forecast by Sales Channel, 2020-2035
  • Table 56: Western Europe Market Volume (Metric Tons) Forecast by Sales Channel, 2020-2035
  • Table 57: Eastern Europe Market Value (USD Billion) Forecast by Country, 2020-2035
  • Table 58: Eastern Europe Market Volume (Metric Tons) Forecast by Country, 2020-2035
  • Table 59: Eastern Europe Market Value (USD Billion) Forecast by Product Type, 2020-2035
  • Table 60: Eastern Europe Market Volume (Metric Tons) Forecast by Product Type, 2020-2035
  • Table 61: Eastern Europe Market Value (USD Billion) Forecast by Form, 2020-2035
  • Table 62: Eastern Europe Market Volume (Metric Tons) Forecast by Form, 2020-2035
  • Table 63: Eastern Europe Market Value (USD Billion) Forecast by Category, 2020-2035
  • Table 64: Eastern Europe Market Volume (Metric Tons) Forecast by Category, 2020-2035
  • Table 65: Eastern Europe Market Value (USD Billion) Forecast by Nature, 2020-2035
  • Table 66: Eastern Europe Market Volume (Metric Tons) Forecast by Nature, 2020-2035
  • Table 67: Eastern Europe Market Value (USD Billion) Forecast by End Use, 2020-2035
  • Table 68: Eastern Europe Market Volume (Metric Tons) Forecast by End Use, 2020-2035
  • Table 69: Eastern Europe Market Value (USD Billion) Forecast by Sales Channel, 2020-2035
  • Table 70: Eastern Europe Market Volume (Metric Tons) Forecast by Sales Channel, 2020-2035
  • Table 71: East Asia Market Value (USD Billion) Forecast by Country, 2020-2035
  • Table 72: East Asia Market Volume (Metric Tons) Forecast by Country, 2020-2035
  • Table 73: East Asia Market Value (USD Billion) Forecast by Product Type, 2020-2035
  • Table 74: East Asia Market Volume (Metric Tons) Forecast by Product Type, 2020-2035
  • Table 75: East Asia Market Value (USD Billion) Forecast by Form, 2020-2035
  • Table 76: East Asia Market Volume (Metric Tons) Forecast by Form, 2020-2035
  • Table 77: East Asia Market Value (USD Billion) Forecast by Category, 2020-2035
  • Table 78: East Asia Market Volume (Metric Tons) Forecast by Category, 2020-2035
  • Table 79: East Asia Market Value (USD Billion) Forecast by Nature, 2020-2035
  • Table 80: East Asia Market Volume (Metric Tons) Forecast by Nature, 2020-2035
  • Table 81: East Asia Market Value (USD Billion) Forecast by End Use, 2020-2035
  • Table 82: East Asia Market Volume (Metric Tons) Forecast by End Use, 2020-2035
  • Table 83: East Asia Market Value (USD Billion) Forecast by Sales Channel, 2020-2035
  • Table 84: East Asia Market Volume (Metric Tons) Forecast by Sales Channel, 2020-2035
  • Table 85: South Asia & Pacific Market Value (USD Billion) Forecast by Country, 2020-2035
  • Table 86: South Asia & Pacific Market Volume (Metric Tons) Forecast by Country, 2020-2035
  • Table 87: South Asia & Pacific Market Value (USD Billion) Forecast by Product Type, 2020-2035
  • Table 88: South Asia & Pacific Market Volume (Metric Tons) Forecast by Product Type, 2020-2035
  • Table 89: South Asia & Pacific Market Value (USD Billion) Forecast by Form, 2020-2035
  • Table 90: South Asia & Pacific Market Volume (Metric Tons) Forecast by Form, 2020-2035
  • Table 91: South Asia & Pacific Market Value (USD Billion) Forecast by Category, 2020-2035
  • Table 92: South Asia & Pacific Market Volume (Metric Tons) Forecast by Category, 2020-2035
  • Table 93: South Asia & Pacific Market Value (USD Billion) Forecast by Nature, 2020-2035
  • Table 94: South Asia & Pacific Market Volume (Metric Tons) Forecast by Nature, 2020-2035
  • Table 95: South Asia & Pacific Market Value (USD Billion) Forecast by End Use, 2020-2035
  • Table 96: South Asia & Pacific Market Volume (Metric Tons) Forecast by End Use, 2020-2035
  • Table 97: South Asia & Pacific Market Value (USD Billion) Forecast by Sales Channel, 2020-2035
  • Table 98: South Asia & Pacific Market Volume (Metric Tons) Forecast by Sales Channel, 2020-2035
  • Table 99: Middle East and Africa Market Value (USD Billion) Forecast by Country, 2020-2035
  • Table 100: Middle East and Africa Market Volume (Metric Tons) Forecast by Country, 2020-2035
  • Table 101: Middle East and Africa Market Value (USD Billion) Forecast by Product Type, 2020-2035
  • Table 102: Middle East and Africa Market Volume (Metric Tons) Forecast by Product Type, 2020-2035
  • Table 103: Middle East and Africa Market Value (USD Billion) Forecast by Form, 2020-2035
  • Table 104: Middle East and Africa Market Volume (Metric Tons) Forecast by Form, 2020-2035
  • Table 105: Middle East and Africa Market Value (USD Billion) Forecast by Category, 2020-2035
  • Table 106: Middle East and Africa Market Volume (Metric Tons) Forecast by Category, 2020-2035
  • Table 107: Middle East and Africa Market Value (USD Billion) Forecast by Nature, 2020-2035
  • Table 108: Middle East and Africa Market Volume (Metric Tons) Forecast by Nature, 2020-2035
  • Table 109: Middle East and Africa Market Value (USD Billion) Forecast by End Use, 2020-2035
  • Table 110: Middle East and Africa Market Volume (Metric Tons) Forecast by End Use, 2020-2035
  • Table 111: Middle East and Africa Market Value (USD Billion) Forecast by Sales Channel, 2020-2035
  • Table 112: Middle East and Africa Market Volume (Metric Tons) Forecast by Sales Channel, 2020-2035

List of Figures

  • Figure 1: Global Market Volume (Metric Tons) Forecast 2020-2035
  • Figure 2: Global Market Pricing Analysis
  • Figure 3: Global Market Value (USD Billion) Forecast 2020-2035
  • Figure 4: Global Market Value Share and BPS Analysis by Product Type, 2025 and 2035
  • Figure 5: Global Market Y-o-Y Growth Comparison by Product Type, 2025-2035
  • Figure 6: Global Market Attractiveness Analysis by Product Type
  • Figure 7: Global Market Value Share and BPS Analysis by Form, 2025 and 2035
  • Figure 8: Global Market Y-o-Y Growth Comparison by Form, 2025-2035
  • Figure 9: Global Market Attractiveness Analysis by Form
  • Figure 10: Global Market Value Share and BPS Analysis by Category, 2025 and 2035
  • Figure 11: Global Market Y-o-Y Growth Comparison by Category, 2025-2035
  • Figure 12: Global Market Attractiveness Analysis by Category
  • Figure 13: Global Market Value Share and BPS Analysis by Nature, 2025 and 2035
  • Figure 14: Global Market Y-o-Y Growth Comparison by Nature, 2025-2035
  • Figure 15: Global Market Attractiveness Analysis by Nature
  • Figure 16: Global Market Value Share and BPS Analysis by End Use, 2025 and 2035
  • Figure 17: Global Market Y-o-Y Growth Comparison by End Use, 2025-2035
  • Figure 18: Global Market Attractiveness Analysis by End Use
  • Figure 19: Global Market Value Share and BPS Analysis by Sales Channel, 2025 and 2035
  • Figure 20: Global Market Y-o-Y Growth Comparison by Sales Channel, 2025-2035
  • Figure 21: Global Market Attractiveness Analysis by Sales Channel
  • Figure 22: Global Market Value (USD Billion) Share and BPS Analysis by Region, 2025 and 2035
  • Figure 23: Global Market Y-o-Y Growth Comparison by Region, 2025-2035
  • Figure 24: Global Market Attractiveness Analysis by Region
  • Figure 25: North America Market Incremental $ Opportunity, 2025-2035
  • Figure 26: Latin America Market Incremental $ Opportunity, 2025-2035
  • Figure 27: Western Europe Market Incremental $ Opportunity, 2025-2035
  • Figure 28: Eastern Europe Market Incremental $ Opportunity, 2025-2035
  • Figure 29: East Asia Market Incremental $ Opportunity, 2025-2035
  • Figure 30: South Asia & Pacific Market Incremental $ Opportunity, 2025-2035
  • Figure 31: Middle East and Africa Market Incremental $ Opportunity, 2025-2035
  • Figure 32: North America Market Value Share and BPS Analysis by Country, 2025 and 2035
  • Figure 33: North America Market Value Share and BPS Analysis by Product Type, 2025 and 2035
  • Figure 34: North America Market Y-o-Y Growth Comparison by Product Type, 2025-2035
  • Figure 35: North America Market Attractiveness Analysis by Product Type
  • Figure 36: North America Market Value Share and BPS Analysis by Form, 2025 and 2035
  • Figure 37: North America Market Y-o-Y Growth Comparison by Form, 2025-2035
  • Figure 38: North America Market Attractiveness Analysis by Form
  • Figure 39: North America Market Value Share and BPS Analysis by Category, 2025 and 2035
  • Figure 40: North America Market Y-o-Y Growth Comparison by Category, 2025-2035
  • Figure 41: North America Market Attractiveness Analysis by Category
  • Figure 42: North America Market Value Share and BPS Analysis by Nature, 2025 and 2035
  • Figure 43: North America Market Y-o-Y Growth Comparison by Nature, 2025-2035
  • Figure 44: North America Market Attractiveness Analysis by Nature
  • Figure 45: North America Market Value Share and BPS Analysis by End Use, 2025 and 2035
  • Figure 46: North America Market Y-o-Y Growth Comparison by End Use, 2025-2035
  • Figure 47: North America Market Attractiveness Analysis by End Use
  • Figure 48: North America Market Value Share and BPS Analysis by Sales Channel, 2025 and 2035
  • Figure 49: North America Market Y-o-Y Growth Comparison by Sales Channel, 2025-2035
  • Figure 50: North America Market Attractiveness Analysis by Sales Channel
  • Figure 51: Latin America Market Value Share and BPS Analysis by Country, 2025 and 2035
  • Figure 52: Latin America Market Value Share and BPS Analysis by Product Type, 2025 and 2035
  • Figure 53: Latin America Market Y-o-Y Growth Comparison by Product Type, 2025-2035
  • Figure 54: Latin America Market Attractiveness Analysis by Product Type
  • Figure 55: Latin America Market Value Share and BPS Analysis by Form, 2025 and 2035
  • Figure 56: Latin America Market Y-o-Y Growth Comparison by Form, 2025-2035
  • Figure 57: Latin America Market Attractiveness Analysis by Form
  • Figure 58: Latin America Market Value Share and BPS Analysis by Category, 2025 and 2035
  • Figure 59: Latin America Market Y-o-Y Growth Comparison by Category, 2025-2035
  • Figure 60: Latin America Market Attractiveness Analysis by Category
  • Figure 61: Latin America Market Value Share and BPS Analysis by Nature, 2025 and 2035
  • Figure 62: Latin America Market Y-o-Y Growth Comparison by Nature, 2025-2035
  • Figure 63: Latin America Market Attractiveness Analysis by Nature
  • Figure 64: Latin America Market Value Share and BPS Analysis by End Use, 2025 and 2035
  • Figure 65: Latin America Market Y-o-Y Growth Comparison by End Use, 2025-2035
  • Figure 66: Latin America Market Attractiveness Analysis by End Use
  • Figure 67: Latin America Market Value Share and BPS Analysis by Sales Channel, 2025 and 2035
  • Figure 68: Latin America Market Y-o-Y Growth Comparison by Sales Channel, 2025-2035
  • Figure 69: Latin America Market Attractiveness Analysis by Sales Channel
  • Figure 70: Western Europe Market Value Share and BPS Analysis by Country, 2025 and 2035
  • Figure 71: Western Europe Market Value Share and BPS Analysis by Product Type, 2025 and 2035
  • Figure 72: Western Europe Market Y-o-Y Growth Comparison by Product Type, 2025-2035
  • Figure 73: Western Europe Market Attractiveness Analysis by Product Type
  • Figure 74: Western Europe Market Value Share and BPS Analysis by Form, 2025 and 2035
  • Figure 75: Western Europe Market Y-o-Y Growth Comparison by Form, 2025-2035
  • Figure 76: Western Europe Market Attractiveness Analysis by Form
  • Figure 77: Western Europe Market Value Share and BPS Analysis by Category, 2025 and 2035
  • Figure 78: Western Europe Market Y-o-Y Growth Comparison by Category, 2025-2035
  • Figure 79: Western Europe Market Attractiveness Analysis by Category
  • Figure 80: Western Europe Market Value Share and BPS Analysis by Nature, 2025 and 2035
  • Figure 81: Western Europe Market Y-o-Y Growth Comparison by Nature, 2025-2035
  • Figure 82: Western Europe Market Attractiveness Analysis by Nature
  • Figure 83: Western Europe Market Value Share and BPS Analysis by End Use, 2025 and 2035
  • Figure 84: Western Europe Market Y-o-Y Growth Comparison by End Use, 2025-2035
  • Figure 85: Western Europe Market Attractiveness Analysis by End Use
  • Figure 86: Western Europe Market Value Share and BPS Analysis by Sales Channel, 2025 and 2035
  • Figure 87: Western Europe Market Y-o-Y Growth Comparison by Sales Channel, 2025-2035
  • Figure 88: Western Europe Market Attractiveness Analysis by Sales Channel
  • Figure 89: Eastern Europe Market Value Share and BPS Analysis by Country, 2025 and 2035
  • Figure 90: Eastern Europe Market Value Share and BPS Analysis by Product Type, 2025 and 2035
  • Figure 91: Eastern Europe Market Y-o-Y Growth Comparison by Product Type, 2025-2035
  • Figure 92: Eastern Europe Market Attractiveness Analysis by Product Type
  • Figure 93: Eastern Europe Market Value Share and BPS Analysis by Form, 2025 and 2035
  • Figure 94: Eastern Europe Market Y-o-Y Growth Comparison by Form, 2025-2035
  • Figure 95: Eastern Europe Market Attractiveness Analysis by Form
  • Figure 96: Eastern Europe Market Value Share and BPS Analysis by Category, 2025 and 2035
  • Figure 97: Eastern Europe Market Y-o-Y Growth Comparison by Category, 2025-2035
  • Figure 98: Eastern Europe Market Attractiveness Analysis by Category
  • Figure 99: Eastern Europe Market Value Share and BPS Analysis by Nature, 2025 and 2035
  • Figure 100: Eastern Europe Market Y-o-Y Growth Comparison by Nature, 2025-2035
  • Figure 101: Eastern Europe Market Attractiveness Analysis by Nature
  • Figure 102: Eastern Europe Market Value Share and BPS Analysis by End Use, 2025 and 2035
  • Figure 103: Eastern Europe Market Y-o-Y Growth Comparison by End Use, 2025-2035
  • Figure 104: Eastern Europe Market Attractiveness Analysis by End Use
  • Figure 105: Eastern Europe Market Value Share and BPS Analysis by Sales Channel, 2025 and 2035
  • Figure 106: Eastern Europe Market Y-o-Y Growth Comparison by Sales Channel, 2025-2035
  • Figure 107: Eastern Europe Market Attractiveness Analysis by Sales Channel
  • Figure 108: East Asia Market Value Share and BPS Analysis by Country, 2025 and 2035
  • Figure 109: East Asia Market Value Share and BPS Analysis by Product Type, 2025 and 2035
  • Figure 110: East Asia Market Y-o-Y Growth Comparison by Product Type, 2025-2035
  • Figure 111: East Asia Market Attractiveness Analysis by Product Type
  • Figure 112: East Asia Market Value Share and BPS Analysis by Form, 2025 and 2035
  • Figure 113: East Asia Market Y-o-Y Growth Comparison by Form, 2025-2035
  • Figure 114: East Asia Market Attractiveness Analysis by Form
  • Figure 115: East Asia Market Value Share and BPS Analysis by Category, 2025 and 2035
  • Figure 116: East Asia Market Y-o-Y Growth Comparison by Category, 2025-2035
  • Figure 117: East Asia Market Attractiveness Analysis by Category
  • Figure 118: East Asia Market Value Share and BPS Analysis by Nature, 2025 and 2035
  • Figure 119: East Asia Market Y-o-Y Growth Comparison by Nature, 2025-2035
  • Figure 120: East Asia Market Attractiveness Analysis by Nature
  • Figure 121: East Asia Market Value Share and BPS Analysis by End Use, 2025 and 2035
  • Figure 122: East Asia Market Y-o-Y Growth Comparison by End Use, 2025-2035
  • Figure 123: East Asia Market Attractiveness Analysis by End Use
  • Figure 124: East Asia Market Value Share and BPS Analysis by Sales Channel, 2025 and 2035
  • Figure 125: East Asia Market Y-o-Y Growth Comparison by Sales Channel, 2025-2035
  • Figure 126: East Asia Market Attractiveness Analysis by Sales Channel
  • Figure 127: South Asia & Pacific Market Value Share and BPS Analysis by Country, 2025 and 2035
  • Figure 128: South Asia & Pacific Market Value Share and BPS Analysis by Product Type, 2025 and 2035
  • Figure 129: South Asia & Pacific Market Y-o-Y Growth Comparison by Product Type, 2025-2035
  • Figure 130: South Asia & Pacific Market Attractiveness Analysis by Product Type
  • Figure 131: South Asia & Pacific Market Value Share and BPS Analysis by Form, 2025 and 2035
  • Figure 132: South Asia & Pacific Market Y-o-Y Growth Comparison by Form, 2025-2035
  • Figure 133: South Asia & Pacific Market Attractiveness Analysis by Form
  • Figure 134: South Asia & Pacific Market Value Share and BPS Analysis by Category, 2025 and 2035
  • Figure 135: South Asia & Pacific Market Y-o-Y Growth Comparison by Category, 2025-2035
  • Figure 136: South Asia & Pacific Market Attractiveness Analysis by Category
  • Figure 137: South Asia & Pacific Market Value Share and BPS Analysis by Nature, 2025 and 2035
  • Figure 138: South Asia & Pacific Market Y-o-Y Growth Comparison by Nature, 2025-2035
  • Figure 139: South Asia & Pacific Market Attractiveness Analysis by Nature
  • Figure 140: South Asia & Pacific Market Value Share and BPS Analysis by End Use, 2025 and 2035
  • Figure 141: South Asia & Pacific Market Y-o-Y Growth Comparison by End Use, 2025-2035
  • Figure 142: South Asia & Pacific Market Attractiveness Analysis by End Use
  • Figure 143: South Asia & Pacific Market Value Share and BPS Analysis by Sales Channel, 2025 and 2035
  • Figure 144: South Asia & Pacific Market Y-o-Y Growth Comparison by Sales Channel, 2025-2035
  • Figure 145: South Asia & Pacific Market Attractiveness Analysis by Sales Channel
  • Figure 146: Middle East and Africa Market Value Share and BPS Analysis by Country, 2025 and 2035
  • Figure 147: Middle East and Africa Market Value Share and BPS Analysis by Product Type, 2025 and 2035
  • Figure 148: Middle East and Africa Market Y-o-Y Growth Comparison by Product Type, 2025-2035
  • Figure 149: Middle East and Africa Market Attractiveness Analysis by Product Type
  • Figure 150: Middle East and Africa Market Value Share and BPS Analysis by Form, 2025 and 2035
  • Figure 151: Middle East and Africa Market Y-o-Y Growth Comparison by Form, 2025-2035
  • Figure 152: Middle East and Africa Market Attractiveness Analysis by Form
  • Figure 153: Middle East and Africa Market Value Share and BPS Analysis by Category, 2025 and 2035
  • Figure 154: Middle East and Africa Market Y-o-Y Growth Comparison by Category, 2025-2035
  • Figure 155: Middle East and Africa Market Attractiveness Analysis by Category
  • Figure 156: Middle East and Africa Market Value Share and BPS Analysis by Nature, 2025 and 2035
  • Figure 157: Middle East and Africa Market Y-o-Y Growth Comparison by Nature, 2025-2035
  • Figure 158: Middle East and Africa Market Attractiveness Analysis by Nature
  • Figure 159: Middle East and Africa Market Value Share and BPS Analysis by End Use, 2025 and 2035
  • Figure 160: Middle East and Africa Market Y-o-Y Growth Comparison by End Use, 2025-2035
  • Figure 161: Middle East and Africa Market Attractiveness Analysis by End Use
  • Figure 162: Middle East and Africa Market Value Share and BPS Analysis by Sales Channel, 2025 and 2035
  • Figure 163: Middle East and Africa Market Y-o-Y Growth Comparison by Sales Channel, 2025-2035
  • Figure 164: Middle East and Africa Market Attractiveness Analysis by Sales Channel
  • Figure 165: Global Market - Tier Structure Analysis
  • Figure 166: Global Market - Company Share Analysis

Frequently Asked Questions

How big is the sweetener market in 2025?

The global sweetener market is estimated to be valued at USD 11.2 billion in 2025.

What will be the size of sweetener market in 2035?

The market size for sweetener is projected to reach USD 16.3 billion by 2035.

How much will be the sweetener market growth between 2025 and 2035?

The sweetener market is expected to grow at a 3.8% CAGR between 2025 and 2035.

Which product type is projected to lead in the sweetener market in 2025?

The natural sweeteners segment is projected to lead in the sweetener market with 42% market share in 2025.

Which end-use segment to contribute significant share in the sweetener market in 2025?

In terms of end use, the food segment is projected to command 40% share in the sweetener market in 2025.

Explore Similar Insights

Future Market Insights

Sweetener Market

Chat With

MaRIA

Hi There, I am MaRIA, Your Market Research Intelligence Assistant. How may I help you?