
- Market Size (2026)
- USD 11.1 Bn
- Forecast (2036)
- USD 20.6 Bn
- CAGR (2026 to 2036)
- 6.4%
How big is Sustainable Footwear Market in 2026?
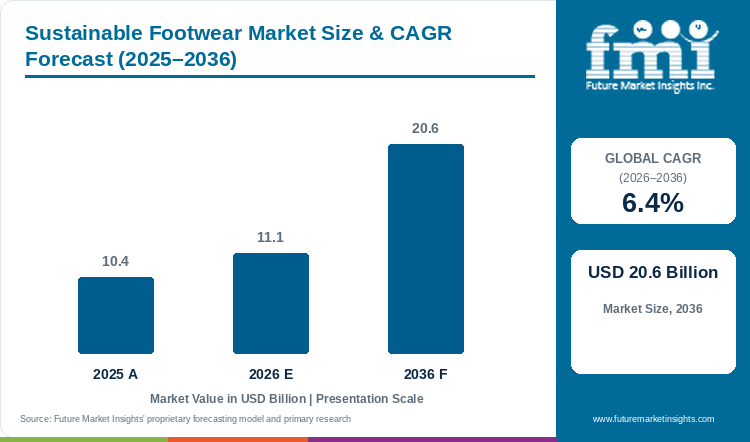
The sustainable footwear market is estimated at USD 10.4 billion in 2025 and is likely to reach USD 11.1 billion in 2026. Sales of sustainable footwear are projected to grow at a 6.4% CAGR across the forecast period and reach USD 20.6 billion by 2036.
Growth of the sustainable footwear market comes from shoppers swapping to recycled and bio-based pairs, and the projected CAGR through 2036 is 6.4%. In value terms, sales of sustainable footwear are estimated at USD 10.4 billion for 2025, with USD 11.1 billion likely in 2026 and USD 20.6 billion by 2036. Over the coming decade, the leading trend will be a move of material change from the upper to the sole, the heaviest and most fossil-based part of a shoe. For instance, Fashion for Good launched The Next Stride in October 2025 with adidas, Target and Zalando to test bio-based polymers for soles, which make up at least 40% of a shoe's mass, World Footwear reported.[1] A sole change of that kind moves far more material per pair than a recycled upper, so brand-backed sole projects point to the largest volume gains of the decade.
In contrast to soles, recycled polyester uppers are now common, so the next carbon and fossil-content cuts can only come from foams and outsoles. Therefore, FMI analysts recommend that brands qualify one bio-based or recycled sole compound per core franchise, since a validated sole moves a whole model line and buyers already expect recycled uppers.
Key Market Trends & Insights
- Athletic shoes are expected to lead type with 60% share in 2026, as running and training lines carry most recycled and bio-based launches. By comparison, non-athletic shoes, from sneakers to sandals and boots, are likely to hold 40%. Performance brands are growing fastest within athletic. Among performance brands, shoe sales at the Swiss running brand On grew 10.9% to CHF 781.6 million in Q2 2026.[2] Double-digit growth at a brand built on new upper technology shows shoppers paying full price for material change in running shoes.
- Men are projected to account for 54% of end-user sales in 2026, women about 34% and children 12%.
Regional Highlights
- Demand in India is forecast by FMI to expand at 7.9%, against the market average of 6.4%, as domestic brands and export factories add plant-based and recycled lines.
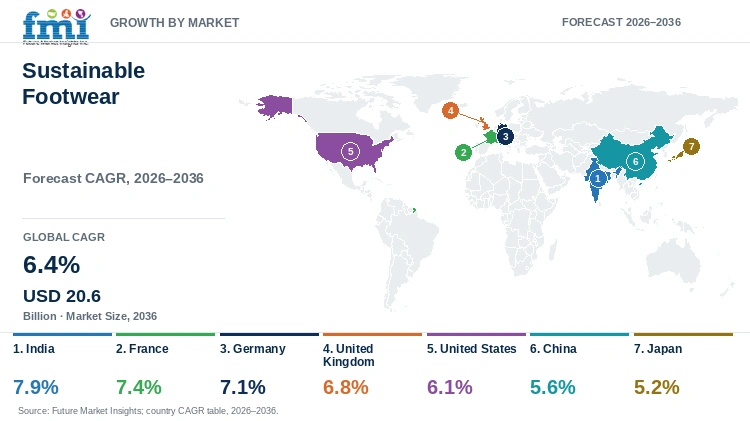
- France (7.4%), Germany (7.1%) and the United Kingdom (6.8%) come next, supported by repair and EPR schemes. Further back, growth in the United States is 6.1% and in China 5.6%, both under the global rate, and Japan, at 5.2%, is last in the country ranking.
- France is paying shoppers to repair. French shoppers get EUR 7 to EUR 25 off each certified footwear or clothing repair under a bonus funded by brand EPR fees, FashionUnited reported on 21 October 2026.[3] A subsidy at the point of repair keeps more pairs in use and builds service revenue for brands that join the scheme.
Market Size & Forecast
Table 1: Market Size and Forecast for the Sustainable Footwear Market (USD billion and percentage), 2025 to 2036
| Metric | Value |
|---|---|
| 2025 Market Size | USD 10.4 billion |
| Estimated Market Size in 2026 | USD 11.1 billion |
| Projected Market Size by 2036 | USD 20.6 billion |
| CAGR, 2026 to 2036 | 6.4% |
| Added Revenue, 2026 to 2036 | USD 9.5 billion |
| Market Expansion Multiple | 1.9x |
Large sportswear groups are growing again, which gives brands the cash and shelf space to move new materials into core franchises. For example, adidas reported Q3 2026 revenue of EUR 7.3 billion, up 9%, and raised the full-year operating profit outlook to about EUR 2.5 billion, World Footwear reported.[4] A higher profit outlook at the largest European brand supports continued investment in recycled and bio-based lines. Alongside footwear, lower-impact clothing grows faster, and a 10.4% CAGR forecast for the sustainable fashion market keeps eco-minded shoppers in the same stores. Over the forecast period, the FMI outlook gives USD 9.5 billion of added sales over the decade, with the sustainable footwear market reaching 1.9 times the 2026 level by 2036. Even so, weak demand at mass brands is the main risk, as Nike reported Q1 FY27 footwear revenue of USD 6,951 million, down 6%.[5] A decline at the largest brand slows the pace at which recycled materials reach mass-market price points.
Repair, Chemical Rules and Brand Restructuring
Repair is becoming part of the shoe offer. For instance, Salomon partnered with United Repair Centre and widened the repair programme to the UK, Germany, the Netherlands, Italy and Spain, FashionUnited reported.[3] Repair across five countries gives outdoor shoppers a reason to buy more durable pairs. Beyond this, in a United Repair Centre analysis of 1,131 branded items, repaired goods resold at an average of EUR 73.93 against EUR 22.73 of repair cost.[3] As a result, brands that add repair can earn a second sale from the same pair.
Chemical rules are tightening around membranes and treatments. In particular, the European Footwear Confederation backed a phase-out of intentionally added PFAS in footwear and leather goods in a position paper published on 19 October 2026.[6] A PFAS phase-out would require new water-repellent finishes, which raises compliance cost per model. Smaller sustainability-led brands are also under financial strain. At the same time, the pioneer brand of wool sneakers is changing hands, as Allbirds agreed in March 2026 to sell footwear assets to an affiliate of American Exchange Group for USD 39.0 million.[7] Consequently, large groups with supply-chain depth are more able to carry new material and compliance costs.
Table 2: Repair, Chemical and Brand Indicators for the Sustainable Footwear Market (rules, sales and deals), 2026
| Indicator | Data Point | Relevance | Source |
|---|---|---|---|
| Fashion for Good The Next Stride, October 2025 | Bio-based sole project with adidas, Target and Zalando | Sole material change | [1] |
| French repair bonus, 2026 | EUR 7 to EUR 25 per certified repair | Footwear repair demand | [3] |
| CEC PFAS position paper, October 2026 | Support for PFAS-free footwear and leather goods | Chemical compliance in membranes and treatments | [6] |
| On shoe sales, Q2 2026 | CHF 781.6 million; up 10.9% | Performance shoe demand | [2] |
| adidas revenue, Q3 2026 | EUR 7.3 billion; up 9% | Sportswear brand growth | [4] |
| Allbirds footwear asset sale, March 2026 | USD 39.0 million to an American Exchange Group affiliate | Restructuring among sustainability-led brands | [7] |
| ANTA Sports stake in PUMA, October 2026 | 29.06% | Ownership change at a major brand | [8] |
Analyst Perspective
“Soles are the source of the next real gains for sustainable shoes, and brands that move a best-selling sole to bio-based or recycled foam will change far more pairs than any capsule collection. I expect repair and resale to become standard services at large brands by the early 2030s, giving each pair a second sale. Smaller brands built only on a sustainability story will struggle, and groups with stores and service networks will profit most from giving repaired trainers a paid second run in stores.”
- Rahul Pandita, Principal Consultant, Future Market Insights.
How is the sustainable footwear market segmented?
The market is segmented into type, end user, and region. Athletic shoes lead type with 60% share in 2026, and men lead end user with 54%.
By type: athletic and non-athletic.
By end user: men, women, and children.
By region: North America, Latin America, Western Europe, Eastern Europe, East Asia, South Asia and Pacific, and Middle East and Africa.
Why do athletic shoes lead sustainable footwear sales by type?
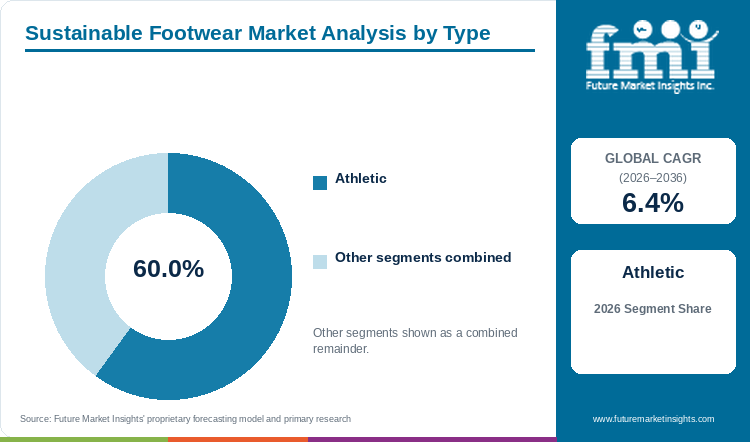
Athletic shoes are expected to lead type sales with 60% share in 2026, ahead of non-athletic shoes at 40%.
Table 3: Type Share for the Sustainable Footwear Market (percentage share), 2026
| Type | Estimated Share (2026) |
|---|---|
| Athletic | 60% |
| Non-Athletic | 40% |
| Total | 100.0% |
Table 4: Type Leadership and Market Growth for the Sustainable Footwear Market (segment and CAGR percentage), 2026 to 2036
| Metric | Value |
|---|---|
| Global CAGR (2026 to 2036) | 6.4% |
| Leading Segment | Athletic |
Athletic shoes are expected to lead type sales at 60% in 2026, as sportswear brands put recycled yarn, bio-based foam and low-waste uppers into running and training shoes first. On the other hand, non-athletic shoes, at 40%, include leather-free sneakers, cork sandals and boots, which rely more on natural materials and sell through fashion stores. Performance brands add volume fastest, and the On brand said in August 2026 that LightSpray uppers will move into more core franchises.[2] Wider use of spray-formed uppers cuts offcut waste on the models that sell in the largest numbers. In addition, running shoe sales set the base for many recycled launches, with the running shoes market growing at a projected 4.6% CAGR. Accordingly, athletic lines will keep the lead as sole and foam changes reach best-selling models.
- Running, training, court and hiking shoes with recycled or bio-based parts make up the athletic group.
- Material start-ups are moving into brand supply chains. Fashion for Good named Algenesis Labs, Balena, Evoco, Kuori and Yulex as material partners in The Next Stride.[1] Brand backing gives these suppliers a path from pilot batches to production foams.
Why do men lead sustainable footwear sales by end user?
Men are projected to lead end-user sales with 54% share in 2026, with women at 34% and children at 12%.
Table 5: End User Share for the Sustainable Footwear Market (percentage share), 2026
| End User | Estimated Share (2026) |
|---|---|
| Men | 54% |
| Women | 34% |
| Children | 12% |
| Total | 100.0% |
Men are projected to lead end-user sales at 54% in 2026, as men buy more running and training shoes and replace pairs on mileage. By comparison, women, at 34%, choose sustainable shoes more often in fashion sneakers and flats, but the range of performance sizes for women is narrower. Lastly, children, at 12%, outgrow shoes within months, which makes parents price-sensitive and limits premium eco lines. Chemical safety is becoming a bigger buying factor for families. On safety, the European Footwear Confederation found that 27 of 76 pairs bought on Shein, Temu and AliExpress failed at least one chemical requirement, World Footwear reported in October 2026.[9] This means clear chemical labelling will matter most to parents buying for children.
- Running, gym and everyday sneakers form most sales to men.
- European producers want marketplace imports held to the same chemical rules. The CEC called for stronger enforcement of EU product safety rules on online footwear sales.[9] Stricter checks on online imports would narrow the price gap between compliant and non-compliant shoes.
What are the drivers, restraints, and opportunities in the sustainable footwear market?
Brand material programmes and repair schemes keep shoppers trading into lower-impact shoes. Higher costs and doubts over green claims slow mass adoption, and bio-based soles and repair services open new sales.
- Driver: Large sportswear brands moving recycled and bio-based materials into best-selling models put sustainable options in front of mainstream buyers.
- Restraint: New materials cost more and need fresh testing, and shoppers who doubt green claims will not pay the higher price.
- Opportunity: Repair, resale and bio-based soles let brands earn more from each pair and meet tightening chemical rules.
Brand Material Programmes Reach Mainstream Buyers
Sustainable shoes reach volume only when a large brand changes a core model. For example, adidas joined the Fashion for Good sole project with Target and Zalando.[1] Participation by a brand of that scale gives sole suppliers a route to volume orders. Likewise, LightSpray, the spray-formed upper from On, is moving into further core franchises after Q2 2026.[2] In turn, mainstream buyers will meet lower-impact shoes in the models already on shoppers' lists.
Cost and Credibility Slow Mass Adoption
Higher material costs and green-claim fatigue limit the price premium shoppers will accept. As an example, Allbirds reported Q1 2026 net revenue of USD 22.3 million, down from USD 32.1 million, and announced the closure of the U.S. full-price store fleet.[7] In FMI's view, brands relying only on a sustainability story face the hardest squeeze.
Repair, Resale and Bio-Based Soles Open New Sales
Repair and resale turn one pair into two sales. On this front, nine brand repair programmes were launched or expanded in H1 2026, and Salomon widened repair with United Repair Centre.[3] Nine programmes in six months show repair moving from pilot to standard service. Alongside this, the CEC supports a move to PFAS-free footwear, which favours new water-repellent treatments.[6] Consequently, brands offering repair, resale and safer finishes will keep shoppers coming back.
Which country CAGRs are profiled in the sustainable footwear market?
Table 6: Country CAGR Comparison for the Sustainable Footwear Market (CAGR percentage), 2026 to 2036
| Country | CAGR (2026 to 2036) |
|---|---|
| India | 7.9% |
| France | 7.4% |
| Germany | 7.1% |
| United Kingdom | 6.8% |
| United States | 6.1% |
| China | 5.6% |
| Japan | 5.2% |
How do country-level CAGRs compare in the sustainable footwear market?
Policy support for repair is strongest in Western Europe. France funds footwear repair through a bonus of EUR 7 to EUR 25 per repair, paid from brand EPR fees.[3] Payments of that kind cut the cost of keeping a pair in use, which supports French demand for repairable models. Growth is still fastest in India, at 7.9%, 1.5 points over the 6.4% global CAGR, with France second at 7.4%. Behind them, FMI expects repair networks and retailer take-back schemes to support a 7.1% rate in Germany and 6.8% in the United Kingdom. Further down, the United States, at 6.1%, carries the largest sales base, though sustainability-led brands there are restructuring. At the bottom, China and Japan stock smaller eco-labelled ranges, so growth there is projected at 5.6% and 5.2%.
- Indian export clusters are taking recycled-material orders from global brands, and city shoppers buy domestic eco labels online. Factories that certify recycled inputs gain from both export and home demand.
- France pays part of each repair bill from brand EPR fees, which makes repairable footwear cheaper to own. Brands that join the scheme early collect service revenue and repeat store visits.
- With adidas and PUMA headquartered in Germany and repair offered through United Repair Centre, German shoppers see new materials and repair services early. Bio-based foam suppliers find close development partners there.
- British retailers such as Next and Primark have added repair services, and online resale is growing. For brands, this opens a second sale on shoes already sold.
- The US market is the largest, though sustainability-led brands there are shrinking and mass brands are cutting prices. Growth for recycled lines will come mainly through large groups.
- Domestic sportswear brands in China compete hard on price, which leaves little room for a green premium. Recycled material suppliers there need cost parity to gain orders.
- Japanese shoppers value durability over eco labels, so lower-impact claims carry less weight at the shelf. Brands selling in Japan gain more from repair and long wear life than from material messaging.
Full report country CAGRs cover: India, France, Germany and the United Kingdom over 6.4%, the United States, China and Japan beneath that line, and regional figures for the remaining standard countries.
Country-wise Analysis
India Sustainable Footwear Market Outlook (2026 to 2036)
Indian brands such as Paaduks make footwear from upcycled tyres and natural materials. At the same time, shoe clusters in Tamil Nadu and Uttar Pradesh make shoes for global brands, which brings recycled-material orders into Indian factories. In addition, rising incomes and online sales bring these products to city buyers. As a result, FMI analysts expect India to grow at a 7.9% CAGR on city demand and export orders.
Key takeaway: Indian factories with certified recycled inputs serve both export brands and city shoppers.
France Sustainable Footwear Market Outlook (2026 to 2036)
France is building repair into the shoe economy through EPR rules. France runs a repair bonus of EUR 7 to EUR 25 per certified footwear or clothing repair, funded by brand EPR fees.[3] The bonus lowers the price of repair at the counter, which brings more shoppers into repair shops. On top of this, Kiabi, Moea and Octobre launched repair services with Save Your Wardrobe in H1 2026.[3] Mass retailers joining the scheme spread repair beyond premium brands, and FMI projects France to grow at 7.4%, second among the seven countries.
Key takeaway: EPR-funded repair gives French brands a second source of revenue from each pair.
Germany Sustainable Footwear Market Outlook (2026 to 2036)
Ownership changes at German sportswear groups are reshaping investment in materials. adidas and PUMA are both based in Germany, and ANTA Sports became the largest PUMA shareholder with 29.06% in October 2026.[8] A new anchor shareholder gives PUMA a long-term owner for material programmes. Meanwhile, Salomon now offers repair in Germany through United Repair Centre.[3] A 7.1% CAGR is forecast for Germany as repair access widens.
Key takeaway: Home to adidas and PUMA, Germany sees new materials and repair services early.
United Kingdom Sustainable Footwear Market Outlook (2026 to 2036)
British high-street retailers are adding repair to the shopping trip. Next with Sojo and Primark with The Seam launched repair services in the United Kingdom in H1 2026, FashionUnited reported.[3] Repair at mass retailers brings the service to price-conscious buyers. Besides this, British brands such as Po-Zu sell shoes made from natural and recycled materials, and the United Kingdom carries a projected 6.8% rate.
Key takeaway: Repair at high-street retailers brings sustainable footwear to price-conscious British shoppers.
United States Sustainable Footwear Market Outlook (2026 to 2036)
US demand is splitting between struggling eco brands and steadier mass brands. Allbirds reported U.S. net revenue of USD 18.4 million for Q1 2026, down about 28%, before agreeing to sell footwear assets.[7] The asset sale shows how hard a single-story brand finds the US market. On the other hand, Nike reported North America revenue of USD 5,127 million for Q1 FY27, up 2%.[5] Steady growth at the largest brand keeps mass channels as the main route for recycled shoes, and FMI forecasts a 6.1% CAGR for the United States.
Key takeaway: US growth for recycled shoes runs through mass brands as eco-only labels restructure.
China Sustainable Footwear Market Outlook (2026 to 2036)
Foreign brands are losing ground in China. Nike reported Greater China revenue of USD 1,180 million for Q1 FY27, down 22%.[5] Meanwhile, domestic sportswear brands compete hard on price, which slows the premium for recycled and bio-based shoes and holds China to 5.6%.
Key takeaway: Chinese price competition leaves little room for a green premium.
Japan Sustainable Footwear Market Outlook (2026 to 2036)
Performance running brands are growing quickly across Asia. Asia-Pacific net sales at On reached CHF 170.5 million in Q2 2026, up 43.1%, with the region above 20% of global net sales.[2] Growth of that pace reaches Japan mainly through performance features, as Japanese shoppers favour durable, well-made shoes and give eco labels less weight at the shelf. Japan is therefore forecast at 5.2%.
Key takeaway: Durability, more than eco labelling, sells shoes to Japanese buyers.
Who are the notable companies in the sustainable footwear market?
Allbirds, adidas, Nike, Veja, Reebok, Timberland, Ecco, PUMA, Patagonia, Vivobarefoot, On, Everlane, Po-Zu and Paaduks are the profiled companies.
Sportswear groups, sustainability-led brands and outdoor and lifestyle labels compete in the sustainable footwear market, and the large groups are gaining scale. Among the sportswear groups, Q2 2026 net sales at On were CHF 850.3 million, up 13.5%.[2] Growth at that rate funds the rollout of spray-formed uppers. In Germany, PUMA welcomed ANTA Sports as the largest shareholder on 7 October 2026.[8] The change brings a major Asian sportswear group into PUMA's ownership. Likewise, adidas raised the 2026 operating profit outlook in October 2026.[4] A higher outlook gives adidas room to keep funding sole material projects.
- Sportswear groups: adidas, Nike, PUMA, On and Reebok.
- Sustainability-led brands: Allbirds, Veja, Vivobarefoot, Everlane, Po-Zu and Paaduks.
- Outdoor and lifestyle labels: Timberland, Ecco and Patagonia.
Competitive Benchmarking: Sustainable Footwear Market
Table 7: Competitive Benchmarking for the Sustainable Footwear Market (qualitative ratings), 2026
| Company | Material Innovation | Repair and Resale | Brand Reach | Recent Activity |
|---|---|---|---|---|
| adidas | High | Medium | High | High |
| Nike | Medium | Low | High | High |
| On | High | Low | Medium | High |
| PUMA | Medium | Low | High | High |
| Allbirds | High | Low | Low | Medium |
Ratings compare the brands on material innovation, repair and resale, brand reach and recent activity.
Key Developments in the Sustainable Footwear Market
- The CEC backed PFAS-free footwear in a position paper reported on 22 October 2026, which points to reformulation of membranes and water-repellent finishes.[6]
- Brands launched or expanded nine repair programmes in H1 2026, according to a review published on 21 October 2026; repair is becoming a standard brand service.[3]
- On 7 October 2026, PUMA announced ANTA Sports as the new largest shareholder, which brings a major Asian sportswear group into the ownership of a global brand.[8]
- Nike said in results of 1 October 2026 that Q1 FY27 footwear revenue fell 6% to USD 6,951 million; for recycled material suppliers this means slower volume at the largest brand.[5]
- In the Q2 update of 11 August 2026, the On brand raised the 2026 gross margin goal to at least 65% after Q2 net sales of CHF 850.3 million, a sign that premium pricing holds for new-material shoes.[2]
- On 14 May 2026, Allbirds filed Q1 2026 results describing the planned USD 39.0 million footwear asset sale, which marks the retreat of a pioneer eco brand.[7]
- Fashion for Good launched The Next Stride bio-based sole project, reported on 8 October 2025, opening a route from lab polymers to production soles.[1]
Key Players in the Sustainable Footwear Market
Sportswear Groups
- adidas
- Nike
- PUMA
- On
- Reebok
Sustainability-Led Brands
- Allbirds
- Veja
- Vivobarefoot
- Everlane
- Po-Zu
- Paaduks
Outdoor and Lifestyle Labels
- Timberland
- Ecco
- Patagonia
Sustainable Footwear Market - Report Scope
Table 8: Report Scope for the Sustainable Footwear Market (coverage fields and definitions), 2026 to 2036
| Coverage field | Report scope |
|---|---|
| Market breakdown | Type; end user; region |
| Quantitative units | USD billion |
| Market definition | Athletic and non-athletic shoes made mainly from recycled, bio-based, natural or low-impact materials, or sold with documented repair, take-back or circular programmes, for men, women and children. |
| Regions covered | North America; Latin America; Western Europe; Eastern Europe; East Asia; South Asia and Pacific; Middle East and Africa |
| Countries covered | United States; Canada; Brazil; Mexico; Argentina; Chile; Germany; France; United Kingdom; Italy; Spain; Benelux; Nordics; Poland; Czech Republic; Romania; Hungary; China; Japan; South Korea; India; ASEAN; Australia and New Zealand; GCC Countries; South Africa; Türkiye; Israel |
| Key companies profiled | Allbirds, adidas, Nike, Veja, Reebok, Timberland, Ecco, PUMA, Patagonia, Vivobarefoot, On, Everlane, Po-Zu, Paaduks |
| Forecast period | 2026 to 2036 |
Sustainable Footwear Market - Research Methodology
Table 9: Research Methodology for the Sustainable Footwear Market (research methods and approach), 2026 edition
| Method | Approach |
|---|---|
| Data Sources | Brand results, industry body position papers and footwear and fashion trade publications. |
| Desk Research | Material programmes, sole projects, repair schemes, chemical rules and brand ownership changes. |
| Market Sizing and Forecasting | Sizing starts from the 2026 base of USD 11.1 billion and the 6.4% CAGR for 2026 to 2036. |
| Data Validation | Figures are cross-checked across company, industry and government sources. |
Sustainable Footwear Market by Segments
Sustainable Footwear Market segmented by Type:
- Athletic
- Non-Athletic
Sustainable Footwear Market segmented by End User:
- Men
- Women
- Children
Sustainable Footwear Market by Region
- North America
- United States
- Canada
- Latin America
- Brazil
- Mexico
- Argentina
- Chile
- Western Europe
- Germany
- France
- United Kingdom
- Italy
- Spain
- Benelux
- Nordics
- Eastern Europe
- Poland
- Czech Republic
- Romania
- Hungary
- East Asia
- China
- Japan
- South Korea
- South Asia and Pacific
- India
- ASEAN
- Australia and New Zealand
- Middle East and Africa
- GCC Countries
- South Africa
- Türkiye
- Israel
Research Sources and Bibliography
- [1] World Footwear. (2025, October 8). Fashion for Good launches new project to advance footwear circularity. https://www.worldfootwear.com/news.asp?id=10948
- [2] On Holding AG. (2026, August 11). On Reports Results for the Second Quarter and Six-Month Period Ended June 30, 2026. https://press.on-running.com/on-reports-results-for-the-second-quarter-and-six-month-period-ended-june-30-2026
- [3] FashionUnited. (2026, October 21). Clothing repair is trending, but is it a real industry shift? https://fashionunited.com/news/business/clothing-repair-is-trending-but-is-it-a-real-industry-shift/2026102175281
- [4] World Footwear. (2026, October 22). adidas raises full-year profit outlook. https://www.worldfootwear.com/news/adidas-raises-full-year-profit-outlook/11851.html
- [5] NIKE, Inc. (2026, October 1). NIKE, Inc. Reports Fiscal 2027 First Quarter Results. https://investors.nike.com/news-events/press-releases/detail/575/nike-inc-reports-fiscal-2027-first-quarter-results
- [6] World Footwear. (2026, October 22). CEC calls for clear rules on proposed EU Universal PFAS restriction. https://www.worldfootwear.com/news/cec-calls-for-clear-rules-on-proposed-eu-universal-pfas-restriction/11850.html
- [7] Allbirds, Inc. (2026, May 14). Quarterly Report on Form 10-Q for the quarter ended March 31, 2026. https://www.sec.gov/Archives/edgar/data/0001653909/000162828026035302/bird-20260331.htm
- [8] PUMA SE. (2026, October 7). PUMA welcomes ANTA Sports as new largest shareholder. https://about.puma.com/en/newsroom/corporate-news/2026/07-10-2026-puma-welcomes-anta-sports-new-largest-shareholder
- [9] World Footwear. (2026, October 13). CEC study finds safety and chemical compliance failures in online footwear. https://www.worldfootwear.com/news/cec-study-finds-safety-and-chemical-compliance-failures-in-online-footwear/11821.html
This bibliography is provided for reader reference. The full report contains the complete reference list and detailed citations.
This Report Answers
- How big is the sustainable footwear market during 2026?
- What market size is projected by 2036?
- Which type holds notable share?
- Which end user holds notable share?
- Which countries have notable growth?
- Which companies are notable in the market?
Table of Content
Table of Content
- Key Takeaways
- Market Size and CAGR
- Top Growth Driver
- Fastest Growing Segment
- Leading Region
- Key Companies
- Emerging Opportunities
- Executive Summary
- Global Market Outlook
- Demand-side Trends
- Supply-side Trends
- Technology Roadmap Analysis
- Analysis and Recommendations
- Analyst Perspective (What is happening? Why now? What should investors know?)
- Key Questions Answered
- How large is the market?
- What is the CAGR?
- What are key trends?
- Which region dominates?
- Who are the leaders?
Read More...
- Market Overview
- Market Coverage / Taxonomy
- Market Definition / Scope / Limitations
- Research Methodology
- Chapter Orientation
- Analytical Lens and Working Hypotheses
- Market Structure, Signals, and Trend Drivers
- Benchmarking and Cross-market Comparability
- Market Sizing, Forecasting, and Opportunity Mapping
- Research Design and Evidence Framework
- Desk Research Programme (Secondary Evidence)
- Expert Input and Fieldwork (Primary Evidence)
- Tooling, Models, and Reference Databases
- Data Engineering and Model Build
- Quality Assurance and Audit Trail
- Market Background
- Market Dynamics (Drivers, Restraints, Opportunity, Trends)
- Scenario Forecast (Optimistic, Likely, Conservative)
- Impact Analysis
- AI Impact
- Sustainability Impact
- Regulatory Impact
- Technology Impact
- Consumer / Buyer Analysis
- Purchase Drivers
- Adoption Barriers
- Buyer Journey
- Opportunity Map Analysis
- Product Life Cycle Analysis
- Supply Chain Analysis
- Investment Feasibility Matrix
- Value Chain Analysis
- PESTLE and Porter's Analysis
- Regulatory Landscape
- Regional Parent Market Outlook
- Production and Consumption Statistics
- Import and Export Statistics
- Global Market Analysis and Forecast, 2021 to 2036
- Historical Market Size Value (USD Billion) Analysis, 2021 to 2025
- Current and Future Market Size Value (USD Billion) Projections, 2026 to 2036
- Y-o-Y Growth Trend Analysis
- Absolute $ Opportunity Analysis
- Global Market Pricing Analysis, 2021 to 2036
- Global Market Analysis and Forecast, By Type, 2021 to 2036
- Introduction / Key Findings
- Historical Market Size Value (USD Billion) Analysis By Type, 2021 to 2025
- Current and Future Market Size Value (USD Billion) Analysis and Forecast By Type, 2026 to 2036
- Athletic
- Non-Athletic
- Y-o-Y Growth Trend Analysis By Type, 2021 to 2025
- Absolute $ Opportunity Analysis By Type, 2026 to 2036
- Global Market Analysis and Forecast, By End User, 2021 to 2036
- Introduction / Key Findings
- Historical Market Size Value (USD Billion) Analysis By End User, 2021 to 2025
- Current and Future Market Size Value (USD Billion) Analysis and Forecast By End User, 2026 to 2036
- Men
- Women
- Children
- Y-o-Y Growth Trend Analysis By End User, 2021 to 2025
- Absolute $ Opportunity Analysis By End User, 2026 to 2036
- Global Market Analysis and Forecast, By Region, 2021 to 2036
- Introduction
- Historical Market Size Value (USD Billion) Analysis By Region, 2021 to 2025
- Current Market Size Value (USD Billion) Analysis and Forecast By Region, 2026 to 2036
- North America
- Latin America
- Western Europe
- Eastern Europe
- East Asia
- South Asia and Pacific
- Middle East and Africa
- Market Attractiveness Analysis By Region
- North America Market Analysis and Forecast, By Country, 2021 to 2036
- Historical Market Size Value (USD Billion) Trend Analysis By Market Taxonomy, 2021 to 2025
- Market Size Value (USD Billion) Forecast By Market Taxonomy, 2026 to 2036
- By Country
- United States
- Canada
- By Type
- By End User
- By Country
- Market Attractiveness Analysis
- By Country
- By Type
- By End User
- Key Takeaways
- Latin America Market Analysis and Forecast, By Country
- Historical Market Size Value (USD Billion) Trend Analysis By Market Taxonomy, 2021 to 2025
- Market Size Value (USD Billion) Forecast By Market Taxonomy, 2026 to 2036
- By Country
- Brazil
- Mexico
- Argentina
- Chile
- By Type
- By End User
- By Country
- Market Attractiveness Analysis
- By Country
- By Type
- By End User
- Key Takeaways
- Western Europe Market Analysis and Forecast, By Country
- Historical Market Size Value (USD Billion) Trend Analysis By Market Taxonomy, 2021 to 2025
- Market Size Value (USD Billion) Forecast By Market Taxonomy, 2026 to 2036
- By Country
- Germany
- France
- United Kingdom
- Italy
- Spain
- Benelux
- Nordics
- By Type
- By End User
- By Country
- Market Attractiveness Analysis
- By Country
- By Type
- By End User
- Key Takeaways
- Eastern Europe Market Analysis and Forecast, By Country
- Historical Market Size Value (USD Billion) Trend Analysis By Market Taxonomy, 2021 to 2025
- Market Size Value (USD Billion) Forecast By Market Taxonomy, 2026 to 2036
- By Country
- Poland
- Czech Republic
- Romania
- Hungary
- By Type
- By End User
- By Country
- Market Attractiveness Analysis
- By Country
- By Type
- By End User
- Key Takeaways
- East Asia Market Analysis and Forecast, By Country
- Historical Market Size Value (USD Billion) Trend Analysis By Market Taxonomy, 2021 to 2025
- Market Size Value (USD Billion) Forecast By Market Taxonomy, 2026 to 2036
- By Country
- China
- Japan
- South Korea
- By Type
- By End User
- By Country
- Market Attractiveness Analysis
- By Country
- By Type
- By End User
- Key Takeaways
- South Asia and Pacific Market Analysis and Forecast, By Country
- Historical Market Size Value (USD Billion) Trend Analysis By Market Taxonomy, 2021 to 2025
- Market Size Value (USD Billion) Forecast By Market Taxonomy, 2026 to 2036
- By Country
- India
- ASEAN
- Australia and New Zealand
- By Type
- By End User
- By Country
- Market Attractiveness Analysis
- By Country
- By Type
- By End User
- Key Takeaways
- Middle East and Africa Market Analysis and Forecast, By Country
- Historical Market Size Value (USD Billion) Trend Analysis By Market Taxonomy, 2021 to 2025
- Market Size Value (USD Billion) Forecast By Market Taxonomy, 2026 to 2036
- By Country
- GCC Countries
- South Africa
- Türkiye
- Israel
- By Type
- By End User
- By Country
- Market Attractiveness Analysis
- By Country
- By Type
- By End User
- Key Takeaways
- Key Countries Market Analysis
- United States
- Pricing Analysis
- Market Share Analysis, 2025
- By Type
- By End User
- Canada
- Pricing Analysis
- Market Share Analysis, 2025
- By Type
- By End User
- Mexico
- Pricing Analysis
- Market Share Analysis, 2025
- By Type
- By End User
- Brazil
- Pricing Analysis
- Market Share Analysis, 2025
- By Type
- By End User
- Chile
- Pricing Analysis
- Market Share Analysis, 2025
- By Type
- By End User
- Germany
- Pricing Analysis
- Market Share Analysis, 2025
- By Type
- By End User
- United Kingdom
- Pricing Analysis
- Market Share Analysis, 2025
- By Type
- By End User
- Italy
- Pricing Analysis
- Market Share Analysis, 2025
- By Type
- By End User
- Spain
- Pricing Analysis
- Market Share Analysis, 2025
- By Type
- By End User
- France
- Pricing Analysis
- Market Share Analysis, 2025
- By Type
- By End User
- India
- Pricing Analysis
- Market Share Analysis, 2025
- By Type
- By End User
- ASEAN
- Pricing Analysis
- Market Share Analysis, 2025
- By Type
- By End User
- Australia and New Zealand
- Pricing Analysis
- Market Share Analysis, 2025
- By Type
- By End User
- China
- Pricing Analysis
- Market Share Analysis, 2025
- By Type
- By End User
- Japan
- Pricing Analysis
- Market Share Analysis, 2025
- By Type
- By End User
- South Korea
- Pricing Analysis
- Market Share Analysis, 2025
- By Type
- By End User
- Poland
- Pricing Analysis
- Market Share Analysis, 2025
- By Type
- By End User
- Hungary
- Pricing Analysis
- Market Share Analysis, 2025
- By Type
- By End User
- Türkiye
- Pricing Analysis
- Market Share Analysis, 2025
- By Type
- By End User
- South Africa
- Pricing Analysis
- Market Share Analysis, 2025
- By Type
- By End User
- United States
- Market Structure Analysis
- Competition Dashboard
- Competition Benchmarking
- Market Share Analysis of Top Players
- By Regional
- By Type
- By End User
- Emerging Startups
- Innovation Benchmarking
- Competition Analysis
- Competition Deep Dive
- adidas
- Overview
- Product Portfolio
- Profitability by Market Segments
- Sales Footprint
- Strategy Overview
- Marketing Strategy
- Product Strategy
- Channel Strategy
- Nike
- On
- PUMA
- Allbirds
- Reebok
- Veja
- Vivobarefoot
- Everlane
- Po-Zu
- Paaduks
- Timberland
- Ecco
- Patagonia
- adidas
- Case Studies
- Success Stories
- Recent Developments
- Competition Deep Dive
- Assumptions & Acronyms Used
List of Tables
- Table 1: Global Market Value (USD Billion) Forecast by Region, 2021 to 2036
- Table 2: Global Market Value (USD Billion) Forecast by Type, 2021 to 2036
- Table 3: Global Market Value (USD Billion) Forecast by End User, 2021 to 2036
- Table 4: North America Market Value (USD Billion) Forecast by Country, 2021 to 2036
- Table 5: North America Market Value (USD Billion) Forecast by Type, 2021 to 2036
- Table 6: North America Market Value (USD Billion) Forecast by End User, 2021 to 2036
- Table 7: Latin America Market Value (USD Billion) Forecast by Country, 2021 to 2036
- Table 8: Latin America Market Value (USD Billion) Forecast by Type, 2021 to 2036
- Table 9: Latin America Market Value (USD Billion) Forecast by End User, 2021 to 2036
- Table 10: Western Europe Market Value (USD Billion) Forecast by Country, 2021 to 2036
- Table 11: Western Europe Market Value (USD Billion) Forecast by Type, 2021 to 2036
- Table 12: Western Europe Market Value (USD Billion) Forecast by End User, 2021 to 2036
- Table 13: Eastern Europe Market Value (USD Billion) Forecast by Country, 2021 to 2036
- Table 14: Eastern Europe Market Value (USD Billion) Forecast by Type, 2021 to 2036
- Table 15: Eastern Europe Market Value (USD Billion) Forecast by End User, 2021 to 2036
- Table 16: East Asia Market Value (USD Billion) Forecast by Country, 2021 to 2036
- Table 17: East Asia Market Value (USD Billion) Forecast by Type, 2021 to 2036
- Table 18: East Asia Market Value (USD Billion) Forecast by End User, 2021 to 2036
- Table 19: South Asia and Pacific Market Value (USD Billion) Forecast by Country, 2021 to 2036
- Table 20: South Asia and Pacific Market Value (USD Billion) Forecast by Type, 2021 to 2036
- Table 21: South Asia and Pacific Market Value (USD Billion) Forecast by End User, 2021 to 2036
- Table 22: Middle East and Africa Market Value (USD Billion) Forecast by Country, 2021 to 2036
- Table 23: Middle East and Africa Market Value (USD Billion) Forecast by Type, 2021 to 2036
- Table 24: Middle East and Africa Market Value (USD Billion) Forecast by End User, 2021 to 2036
List of Figures
- Figure 1: Global Market Pricing Analysis
- Figure 2: Global Market Value (USD Billion) Forecast 2021-2036
- Figure 3: Global Market Value Share and BPS Analysis by Type, 2026 and 2036
- Figure 4: Global Market Y-o-Y Growth Comparison by Type, 2026-2036
- Figure 5: Global Market Attractiveness Analysis by Type
- Figure 6: Global Market Value Share and BPS Analysis by End User, 2026 and 2036
- Figure 7: Global Market Y-o-Y Growth Comparison by End User, 2026-2036
- Figure 8: Global Market Attractiveness Analysis by End User
- Figure 9: Global Market Value (USD Billion) Share and BPS Analysis by Region, 2026 and 2036
- Figure 10: Global Market Y-o-Y Growth Comparison by Region, 2026-2036
- Figure 11: Global Market Attractiveness Analysis by Region
- Figure 12: North America Market Incremental Dollar Opportunity, 2026-2036
- Figure 13: Latin America Market Incremental Dollar Opportunity, 2026-2036
- Figure 14: Western Europe Market Incremental Dollar Opportunity, 2026-2036
- Figure 15: Eastern Europe Market Incremental Dollar Opportunity, 2026-2036
- Figure 16: East Asia Market Incremental Dollar Opportunity, 2026-2036
- Figure 17: South Asia and Pacific Market Incremental Dollar Opportunity, 2026-2036
- Figure 18: Middle East and Africa Market Incremental Dollar Opportunity, 2026-2036
- Figure 19: North America Market Value Share and BPS Analysis by Country, 2026 and 2036
- Figure 20: North America Market Value Share and BPS Analysis by Type, 2026 and 2036
- Figure 21: North America Market Y-o-Y Growth Comparison by Type, 2026-2036
- Figure 22: North America Market Attractiveness Analysis by Type
- Figure 23: North America Market Value Share and BPS Analysis by End User, 2026 and 2036
- Figure 24: North America Market Y-o-Y Growth Comparison by End User, 2026-2036
- Figure 25: North America Market Attractiveness Analysis by End User
- Figure 26: Latin America Market Value Share and BPS Analysis by Country, 2026 and 2036
- Figure 27: Latin America Market Value Share and BPS Analysis by Type, 2026 and 2036
- Figure 28: Latin America Market Y-o-Y Growth Comparison by Type, 2026-2036
- Figure 29: Latin America Market Attractiveness Analysis by Type
- Figure 30: Latin America Market Value Share and BPS Analysis by End User, 2026 and 2036
- Figure 31: Latin America Market Y-o-Y Growth Comparison by End User, 2026-2036
- Figure 32: Latin America Market Attractiveness Analysis by End User
- Figure 33: Western Europe Market Value Share and BPS Analysis by Country, 2026 and 2036
- Figure 34: Western Europe Market Value Share and BPS Analysis by Type, 2026 and 2036
- Figure 35: Western Europe Market Y-o-Y Growth Comparison by Type, 2026-2036
- Figure 36: Western Europe Market Attractiveness Analysis by Type
- Figure 37: Western Europe Market Value Share and BPS Analysis by End User, 2026 and 2036
- Figure 38: Western Europe Market Y-o-Y Growth Comparison by End User, 2026-2036
- Figure 39: Western Europe Market Attractiveness Analysis by End User
- Figure 40: Eastern Europe Market Value Share and BPS Analysis by Country, 2026 and 2036
- Figure 41: Eastern Europe Market Value Share and BPS Analysis by Type, 2026 and 2036
- Figure 42: Eastern Europe Market Y-o-Y Growth Comparison by Type, 2026-2036
- Figure 43: Eastern Europe Market Attractiveness Analysis by Type
- Figure 44: Eastern Europe Market Value Share and BPS Analysis by End User, 2026 and 2036
- Figure 45: Eastern Europe Market Y-o-Y Growth Comparison by End User, 2026-2036
- Figure 46: Eastern Europe Market Attractiveness Analysis by End User
- Figure 47: East Asia Market Value Share and BPS Analysis by Country, 2026 and 2036
- Figure 48: East Asia Market Value Share and BPS Analysis by Type, 2026 and 2036
- Figure 49: East Asia Market Y-o-Y Growth Comparison by Type, 2026-2036
- Figure 50: East Asia Market Attractiveness Analysis by Type
- Figure 51: East Asia Market Value Share and BPS Analysis by End User, 2026 and 2036
- Figure 52: East Asia Market Y-o-Y Growth Comparison by End User, 2026-2036
- Figure 53: East Asia Market Attractiveness Analysis by End User
- Figure 54: South Asia and Pacific Market Value Share and BPS Analysis by Country, 2026 and 2036
- Figure 55: South Asia and Pacific Market Value Share and BPS Analysis by Type, 2026 and 2036
- Figure 56: South Asia and Pacific Market Y-o-Y Growth Comparison by Type, 2026-2036
- Figure 57: South Asia and Pacific Market Attractiveness Analysis by Type
- Figure 58: South Asia and Pacific Market Value Share and BPS Analysis by End User, 2026 and 2036
- Figure 59: South Asia and Pacific Market Y-o-Y Growth Comparison by End User, 2026-2036
- Figure 60: South Asia and Pacific Market Attractiveness Analysis by End User
- Figure 61: Middle East and Africa Market Value Share and BPS Analysis by Country, 2026 and 2036
- Figure 62: Middle East and Africa Market Value Share and BPS Analysis by Type, 2026 and 2036
- Figure 63: Middle East and Africa Market Y-o-Y Growth Comparison by Type, 2026-2036
- Figure 64: Middle East and Africa Market Attractiveness Analysis by Type
- Figure 65: Middle East and Africa Market Value Share and BPS Analysis by End User, 2026 and 2036
- Figure 66: Middle East and Africa Market Y-o-Y Growth Comparison by End User, 2026-2036
- Figure 67: Middle East and Africa Market Attractiveness Analysis by End User
- Figure 68: Global Market - Tier Structure Analysis
- Figure 69: Global Market - Company Share Analysis
Frequently Asked Questions
How large is the sustainable footwear market expected in 2026?
On FMI's forecast, the sustainable footwear market is likely to reach USD 11.1 billion in 2026, from USD 10.4 billion in 2025. Sales of sustainable footwear are projected to reach USD 20.6 billion by 2036.
What CAGR is projected for the sustainable footwear market through 2036?
The sustainable footwear market is expected to grow at a 6.4% CAGR through 2036. Recycled and bio-based materials in best-selling models, repair schemes and tighter chemical rules carry that growth.
Which type holds a notable market share in 2026?
Athletic shoes are expected to lead with 60% share. Non-athletic shoes hold 40%.
Which end user holds a notable market share in 2026?
Men will lead with 54% share. Women follow at about 34%.
Which country has a notable expansion outlook through 2036?
FMI projects India to grow fastest, at 7.9%. France follows at 7.4%.
Who are the key companies in the sustainable footwear market?
adidas, Nike, PUMA, On and Reebok lead the sportswear group. Allbirds, Veja, Vivobarefoot, Everlane, Po-Zu, Paaduks, Timberland, Ecco and Patagonia make up the sustainability-led, outdoor and lifestyle brands.
Preview the report firsthand - request a free sample
Get SampleGet the brochure for pricing and purchase details.
Get PDF
