Surgical Operating Microscope Market Overview for 2024 to 2034

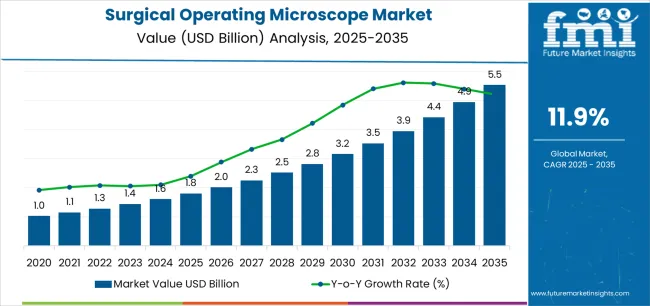
The surgical operating microscope market is expected to grow at a CAGR of 12.5% over the projected period. The market value is projected to increase from US$ 1.6 billion in 2024 to US$ 5.3 billion by 2034.

Surgical Operating Microscope Market Size, Analysis, and Insights

  • Increasing preference for minimally invasive surgeries drive the demand for surgical operating microscopes. The use of surgical operating microscopes is critical in minimally invasive procedures as they provide high-quality visualization and precision, enabling surgeons to perform complex procedures with greater accuracy and efficiency.
  • Rising incidences of chronic diseases such as cancer, cardiovascular diseases, and neurological disorders lead to an increase in the number of surgical procedures. This, in turn, has boosted demand for surgical operating microscopes, as they play a crucial role in enhancing the accuracy and efficiency of surgical procedures.
  • Increasing adoption of healthcare technology also drives market demand. The development of robotic-assisted surgical systems that incorporate surgical operating microscopes has further enhanced the accuracy and efficiency of surgeries.
  • The adoption of surgical operating microscopes is expected to continue to increase as healthcare facilities strive to improve surgical outcomes and patient care.
Attributes Details
Surgical Operating Microscope Market Size, 2024 US$ 1.6 billion
Projected Market Size, 2034 US$ 5.3 billion
Value-based CAGR (2024 to 2034) 12.5%

Don't pay for what you don't need

Customize your report by selecting specific countries or regions and save 30%!

Key Opportunities in the Surgical Operating Microscope Market

  • Increasing demand for digital and 3D imaging systems drive market growth and generate lucrative opportunities for manufacturers.
  • The integration of surgical operating microscopes with digital and 3D imaging systems is a significant opportunity for market players to enhance the functionality and performance of these devices.
  • Rising demand for portable surgical operating microscopes also drives the market forward.
  • Increasing adoption of telemedicine and remote surgery presents a significant opportunity for market players to develop portable surgical operating microscopes that can be used in remote surgeries.
  • Increasing adoption of robotic-assisted surgical systems is another significant opportunity for market players.
  • Growing demand for image-guided surgeries is another significant market opportunity.
  • The integration of surgical operating microscopes with imaging technologies such as magnetic resonance imaging (MRI) and computed tomography (CT) presents a significant opportunity for market players to enhance the functionality and performance of these devices.
  • Market players who can capitalize on opportunities are likely to gain a competitive advantage and drive market growth.

Challenges in the Surgical Operating Microscope Market

  • High cost of surgical operating microscopes require specialized technology, which makes them expensive to purchase. It is a major obstacle for small and medium-sized hospitals that have limited budgets. The high cost of surgical operating microscopes leads to a limited market size, as some hospitals may opt for cheaper alternatives.
  • The lack of skilled professionals who can operate surgical operating microscopes is expected to hamper the market growth during the forecast period. It leads to delays in the adoption of surgical operating microscopes, as hospitals may not have the resources to train their staff on how to use them.
  • Regulatory challenges pose a threat to the growth of the surgical operating microscope market. The market is highly regulated, with strict guidelines for safety and efficacy.
  • The regulations lead to delays in the approval process for new products, which is likely to slow down innovation and limit the availability of new technology.
  • Competition from alternative technologies, such as endoscopes and laparoscopes, also restrains the market.
Sabyasachi Ghosh
Sabyasachi Ghosh

Principal Consultant

Talk to Analyst

Find your sweet spots for generating winning opportunities in this market.

Comparative View of Adjacent Markets

Apart from analyzing the surgical operating microscope market, a comprehensive evaluation has been carried out on two related markets, which are the robot-assisted surgical microscope market and the 3D surgical microscopic systems market.

Increasing demand for minimally invasive surgeries is driving the growth of the robot-assisted surgical microscope market. Surging demand for cutting-edge surgical technology and enhanced visualization capabilities fuel the growth of the 3D surgical microscopic systems market.

Surgical Operating Microscope Market:

Attributes Surgical Operating Microscope Market
Value-based CAGR (2024 to 2034) 12.5%
Market Trends Increasing preference for minimally invasive surgeries
Growth Opportunities Increasing demand for digital and 3D imaging systems.

Robot-assisted Surgical Microscope Market:

Attributes Robot-assisted Surgical Microscope Market
Value-based CAGR (2024 to 2034) 7.6%
Market Trends The tendency is towards the development of modular robotic platforms and systems that can be customized and adapted for various surgical specialties and procedures.
Growth Opportunities Adoption of high-tech medical equipment for surgical procedures by healthcare professionals will provide a significant potential for the robotic-aided surgical microscopy industry.

3D Surgical Microscopic Systems Market:

Attributes 3D Surgical Microscopic Systems Market
Value-based CAGR (2024 to 2034) 10.1%
Market Trends Increased diagnostics laboratory infrastructure in developed nations is one of the major trends in the market.
Growth Opportunities Rising disease incidences, infection rates, increasing demand for improved diagnostic techniques, and increasing spending on healthcare.

Category-wise Insights

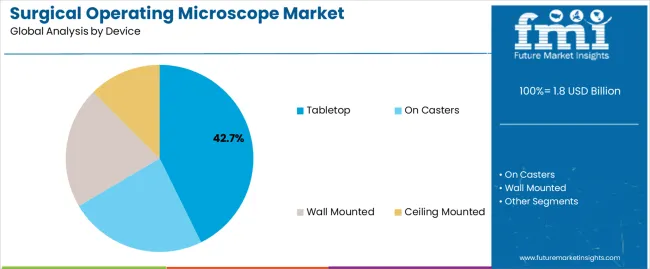
In terms of Device, the On Casters Segment Leads the Market Growth

Attributes Details
Device On Casters
CAGR from 2024 to 2034 12.3%
  • The on casters segment is dominating the market due to its ability to provide high mobility and ease of movement during surgeries where the microscope needs to be moved around.
  • Rising demand for minimally invasive surgeries, which require high precision and accuracy.
  • The use of microscopes in such surgeries plays a crucial role in ensuring that the procedure is performed with the utmost precision, which is driving the demand for on caster microscopes that are easy to move around is increasing.
  • On casters segment's growth is attributed to the increasing number of surgical procedures being performed in ambulatory surgical centers (ASCs) and clinics.

ACS and clinic facilities require microscopes that can be easily moved around and stored when not in use, making the On Casters segment more preferable.

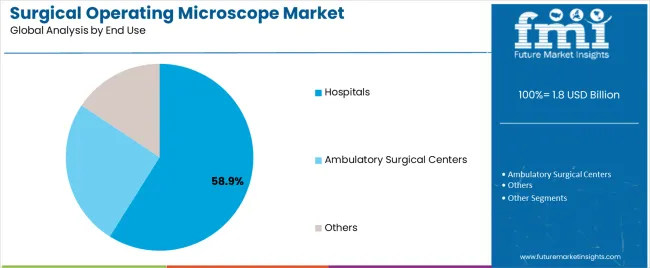
In terms of End Use, the Hospitals Segment Leads the Market

Attributes Details
Top End Use Hospitals
CAGR from 2024 to 2034 12.1%
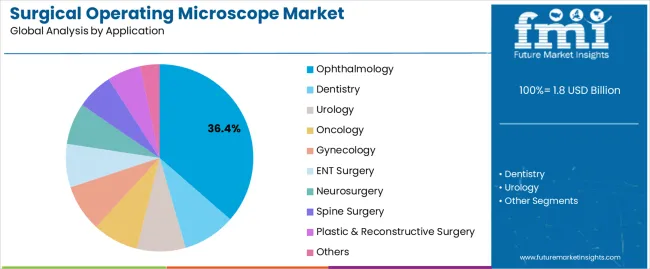
  • High usage in various surgical specialties, including neurology, ophthalmology, dentistry, and ENT is driving the growth of the hospital segment.
  • The increasing number of surgeries, being performed globally, has led to the rising demand for surgical microscopes.
  • Increasing prevalence of chronic diseases, coupled with the growing aging population, has led to a surge in surgical procedures, thereby creating a significant demand for surgical microscopes in hospitals
  • Hospitals have the necessary infrastructure and resources to house and maintain surgical microscopes, which makes them the preferred choice for purchasing such equipment.

Get the data you need at a Fraction of the cost

Personalize your report by choosing insights you need
and save 40%!

Country-wise insights

Countries CAGR through 2034
United States 12.8%
United Kingdom 13.8%
China 12.9%
Japan 14.2%
South Korea 15.0%

Increasing Number of Complex Surgeries in the United States

  • The United States surgical operating microscope market is experiencing a significant demand owing to the growing prevalence of chronic diseases, increasing investments in healthcare infrastructure, and the rising adoption of minimally invasive surgeries.
  • Demand for surgical operating microscopes is primarily driven by the increasing number of complex surgeries performed in the United States, coupled with advancements in technology.
  • Increasing prevalence of chronic diseases, such as cancer, is further driving the demand for surgical operating microscopes as they help in achieving precise and accurate surgical outcomes.
  • The United States is home to some of the leading medical device manufacturers, which are constantly investing in R&D activities to develop advanced surgical operating microscopes.

Strong Research and Development Capabilities in the United Kingdom

  • Increasing number of complex surgeries performed in the country, coupled with the advancements in technology.
  • Rising aging population in the country, which is leading to a higher incidence of chronic diseases such as cancer, cardiovascular diseases, and neurological disorders.
  • Surgical operating microscopes are critical in the treatment of these diseases, which is leading to a higher demand for these devices in the country.
  • The United Kingdom is known for its strong research and development capabilities in the healthcare sector.
  • The country has several universities and research centres that are conducting extensive research to develop advanced surgical operating microscopes.
  • Advancements are driving the growth of the market in the country as healthcare professionals are looking for more advanced devices to perform complex surgeries.

Growing Need for Advanced Medical Equipment in China

  • Increasing demand for high-quality healthcare services in the country.
  • As more and more people seek out advanced treatments and procedures, the demand for surgical operating microscopes has continued to grow.
  • Rising number of surgeries being performed in the country. With China's population aging rapidly, there has been a sharp rise in the number of surgeries being performed in recent years.
  • More number of surgeries created a growing need for advanced medical equipment, including surgical operating microscopes.
  • Increase in the number of private medical institutions in China, which has further fueled the demand for surgical operating microscopes.
  • Private hospitals and clinics have been investing heavily in advanced medical equipment to attract more patients, and surgical operating microscopes have been a key part of these investments.

Government's Focus on Improving Healthcare Infrastructure in Japan

  • Japan has one of the world's fastest-aging populations, with a large number of elderly citizens requiring surgery.
  • The aging population leads to an increased demand for surgical operating microscopes, as they offer an enhanced level of precision and accuracy during surgical procedures.
  • Japanese government's focus on improving healthcare infrastructure has also contributed to the growth of the surgical operating microscope market in Japan.
  • The government has invested heavily in healthcare technology, including the procurement of advanced medical equipment such as surgical operating microscopes.

Growing Trend toward Minimally Invasive Surgeries in South Korea

  • The healthcare sector in South Korea has been growing rapidly in recent years.
  • The government has been investing heavily in the sector to improve healthcare infrastructure and services, which has led to an increase in the number of medical facilities and hospitals in the country.
  • The growing trend towards minimally invasive surgeries has also increased the demand for surgical operating microscopes in South Korea.

Competitive Landscape

The market is highly competitive, with several players vying for higher market share. Established players in the market have a significant advantage in terms of brand recognition, product portfolio, and distribution network. These players have been in the market for a long time and have built a reputation for quality and reliability. They have a strong foothold in the market and have established relationships with key stakeholders such as hospitals, clinics, and surgeons.

New entrants, on the other hand, have to compete with established players on multiple fronts. These include pricing, product quality, and innovation. New entrants often rely on disruptive technologies or innovative business models to gain a foothold in the market. They also need to invest heavily in marketing and distribution to create awareness and build a customer base.

Recent Development in the Surgical Operating Microscope Market

  • In 2023, The Leica M690 Surgical Operating Microscope System was recently acquired by the Joseph N France General Hospital. This state-of-the-art technology is expected to bring about a significant improvement in the quality of surgical procedures carried out at the hospital, leading to better patient care and outcomes. The acquisition of this advanced surgical operating microscope system is set to revolutionize surgical procedures at the hospital and is a clear indication of the hospital's commitment to providing the best possible care to its patients.

Key Market Players

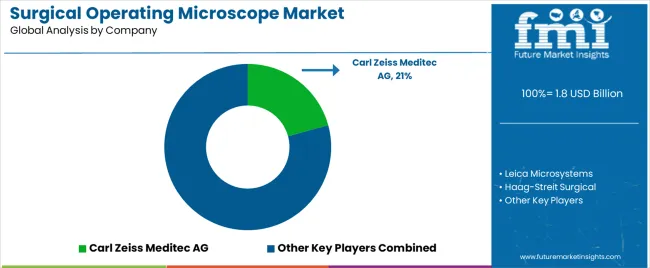
  • Carl Zeiss Meditec AG
  • Leica Microsystems
  • Haag-Streit Surgical
  • Topcon Corporation
  • Alltion (Wuzhou) Co., Ltd.
  • Takagi Seiko Co. Ltd.
  • Olympus Corporation
  • Alcon Laboratories, Inc.
  • ACCU-Scope Inc
  • TetraCam Inc.

Key Coverage in the Surgical Operating Microscope Market Report

  • Fluorescence Surgical Microscope Market Report
  • Ophthalmic Operating Microscope Industry Analysis
  • High-Resolution Surgical Microscope Market Assessment
  • Robot-Assisted Surgical Microscope Market Overview
  • ENT Operating Microscope Pricing Outlook

Key Market Segmentation

By Device:

  • Tabletop
  • On Casters
  • Wall Mounted
  • Ceiling Mounted

By Application:

  • Dentistry
  • Urology
  • Oncology
  • Gynecology
  • ENT Surgery
  • Neurosurgery
  • Ophthalmology
  • Spine Surgery
  • Plastic & Reconstructive Surgery
  • Others

By End Use:

  • Hospitals
  • Ambulatory Surgical Centers
  • Others

By Region:

  • North America
  • Latin America
  • East Asia
  • South Asia
  • Europe
  • Oceania
  • MEA

Frequently Asked Questions

How Big is the Surgical Operating Microscope Market in 2024?

The surgical operating microscope market is estimated to be valued at US$ 1.6 billion in 2024.

What is China’s Market Outlook?

The market in China is expected to progress at a CAGR of 12.5% over the forecast period.

Which Device Segment Contributes More to the Market?

The on casters segment is expected to register a 12.3% CAGR from 2024 to 2034.

What is the United States Market Outlook?

The United States market is expected to rise at a 12.8% CAGR from 2024 to 2034.

What is the Projected Market Value by 2034?

The market is set to reach a valuation of US$ 5.3 billion by 2034.

What was the Historical CAGR for the Market?

The demand for surgical operating microscopes increased at a 16.0% CAGR from 2019 to 2023.

Table of Content

1. Executive Summary

    1.1. Global Market Outlook

    1.2. Demand-side Trends

    1.3. Supply-side Trends

    1.4. Technology Roadmap Analysis

    1.5. Analysis and Recommendations

2. Market Overview

    2.1. Market Coverage / Taxonomy

    2.2. Market Definition / Scope / Limitations

3. Market Background

    3.1. Market Dynamics

        3.1.1. Drivers

        3.1.2. Restraints

        3.1.3. Opportunity

        3.1.4. Trends

    3.2. Scenario Forecast

        3.2.1. Demand in Optimistic Scenario

        3.2.2. Demand in Likely Scenario

        3.2.3. Demand in Conservative Scenario

    3.3. Opportunity Map Analysis

    3.4. Product Life Cycle Analysis

    3.5. Supply Chain Analysis

        3.5.1. Supply Side Participants and their Roles

            3.5.1.1. Manufacturer

            3.5.1.2. Mid-Level Participants (Traders)

            3.5.1.3. Distributors

        3.5.2. Value Added and Value Created at Node in the Supply Chain

        3.5.3. List of Raw Material Suppliers

        3.5.4. List of Existing and Potential Buyer’s

    3.6. Investment Feasibility Matrix

    3.7. Value Chain Analysis

        3.7.1. Profit Margin Analysis

        3.7.2. Distributors

    3.8. PESTLE and Porter’s Analysis

    3.9. Regulatory Landscape

        3.9.1. By Key Regions

        3.9.2. By Key Countries

    3.10. Regional Parent Market Outlook

    3.11. Production and Consumption Statistics

    3.12. Import and Export Statistics

4. Global Market Analysis 2019 to 2023 and Forecast, 2024 to 2034

    4.1. Historical Market Size Value (US$ Million) & Volume (Units) Analysis, 2019 to 2023

    4.2. Current and Future Market Size Value (US$ Million) & Volume (Units) Projections, 2024 to 2034

        4.2.1. Y-o-Y Growth Trend Analysis

        4.2.2. Absolute $ Opportunity Analysis

5. Global Market Analysis 2019 to 2023 and Forecast 2024 to 2034, By Device

    5.1. Introduction / Key Findings

    5.2. Historical Market Size Value (US$ Million) & Volume (Units) Analysis By Device, 2019 to 2023

    5.3. Current and Future Market Size Value (US$ Million) & Volume (Units) Analysis and Forecast By Device, 2024 to 2034

        5.3.1. Tabletop

        5.3.2. On Casters

        5.3.3. Wall Mounted

        5.3.4. Ceiling Mounted

    5.4. Y-o-Y Growth Trend Analysis By Device, 2019 to 2023

    5.5. Absolute $ Opportunity Analysis By Device, 2024 to 2034

6. Global Market Analysis 2019 to 2023 and Forecast 2024 to 2034, By Application

    6.1. Introduction / Key Findings

    6.2. Historical Market Size Value (US$ Million) & Volume (Units) Analysis By Application, 2019 to 2023

    6.3. Current and Future Market Size Value (US$ Million) & Volume (Units) Analysis and Forecast By Application, 2024 to 2034

        6.3.1. Dentistry

        6.3.2. Urology

        6.3.3. Oncology

        6.3.4. Gynecology

        6.3.5. ENT Surgery

        6.3.6. Neurosurgery

        6.3.7. Ophthalmology

        6.3.8. Spine Surgery

        6.3.9. Plastic & Reconstructive Surgery

        6.3.10. Others

    6.4. Y-o-Y Growth Trend Analysis By Application, 2019 to 2023

    6.5. Absolute $ Opportunity Analysis By Application, 2024 to 2034

7. Global Market Analysis 2019 to 2023 and Forecast 2024 to 2034, By End-Use

    7.1. Introduction / Key Findings

    7.2. Historical Market Size Value (US$ Million) & Volume (Units) Analysis By End-Use, 2019 to 2023

    7.3. Current and Future Market Size Value (US$ Million) & Volume (Units) Analysis and Forecast By End-Use, 2024 to 2034

        7.3.1. Hospitals

        7.3.2. Ambulatory Surgical Centers

        7.3.3. Others

    7.4. Y-o-Y Growth Trend Analysis By End-Use, 2019 to 2023

    7.5. Absolute $ Opportunity Analysis By End-Use, 2024 to 2034

8. Global Market Analysis 2019 to 2023 and Forecast 2024 to 2034, By Region

    8.1. Introduction

    8.2. Historical Market Size Value (US$ Million) & Volume (Units) Analysis By Region, 2019 to 2023

    8.3. Current Market Size Value (US$ Million) & Volume (Units) Analysis and Forecast By Region, 2024 to 2034

        8.3.1. North America

        8.3.2. Latin America

        8.3.3. Western Europe

        8.3.4. Eastern Europe

        8.3.5. South Asia and Pacific

        8.3.6. East Asia

        8.3.7. Middle East and Africa

    8.4. Market Attractiveness Analysis By Region

9. North America Market Analysis 2019 to 2023 and Forecast 2024 to 2034, By Country

    9.1. Historical Market Size Value (US$ Million) & Volume (Units) Trend Analysis By Market Taxonomy, 2019 to 2023

    9.2. Market Size Value (US$ Million) & Volume (Units) Forecast By Market Taxonomy, 2024 to 2034

        9.2.1. By Country

            9.2.1.1. USA

            9.2.1.2. Canada

        9.2.2. By Device

        9.2.3. By Application

        9.2.4. By End-Use

    9.3. Market Attractiveness Analysis

        9.3.1. By Country

        9.3.2. By Device

        9.3.3. By Application

        9.3.4. By End-Use

    9.4. Key Takeaways

10. Latin America Market Analysis 2019 to 2023 and Forecast 2024 to 2034, By Country

    10.1. Historical Market Size Value (US$ Million) & Volume (Units) Trend Analysis By Market Taxonomy, 2019 to 2023

    10.2. Market Size Value (US$ Million) & Volume (Units) Forecast By Market Taxonomy, 2024 to 2034

        10.2.1. By Country

            10.2.1.1. Brazil

            10.2.1.2. Mexico

            10.2.1.3. Rest of Latin America

        10.2.2. By Device

        10.2.3. By Application

        10.2.4. By End-Use

    10.3. Market Attractiveness Analysis

        10.3.1. By Country

        10.3.2. By Device

        10.3.3. By Application

        10.3.4. By End-Use

    10.4. Key Takeaways

11. Western Europe Market Analysis 2019 to 2023 and Forecast 2024 to 2034, By Country

    11.1. Historical Market Size Value (US$ Million) & Volume (Units) Trend Analysis By Market Taxonomy, 2019 to 2023

    11.2. Market Size Value (US$ Million) & Volume (Units) Forecast By Market Taxonomy, 2024 to 2034

        11.2.1. By Country

            11.2.1.1. Germany

            11.2.1.2. UK

            11.2.1.3. France

            11.2.1.4. Spain

            11.2.1.5. Italy

            11.2.1.6. Rest of Western Europe

        11.2.2. By Device

        11.2.3. By Application

        11.2.4. By End-Use

    11.3. Market Attractiveness Analysis

        11.3.1. By Country

        11.3.2. By Device

        11.3.3. By Application

        11.3.4. By End-Use

    11.4. Key Takeaways

12. Eastern Europe Market Analysis 2019 to 2023 and Forecast 2024 to 2034, By Country

    12.1. Historical Market Size Value (US$ Million) & Volume (Units) Trend Analysis By Market Taxonomy, 2019 to 2023

    12.2. Market Size Value (US$ Million) & Volume (Units) Forecast By Market Taxonomy, 2024 to 2034

        12.2.1. By Country

            12.2.1.1. Poland

            12.2.1.2. Russia

            12.2.1.3. Czech Republic

            12.2.1.4. Romania

            12.2.1.5. Rest of Eastern Europe

        12.2.2. By Device

        12.2.3. By Application

        12.2.4. By End-Use

    12.3. Market Attractiveness Analysis

        12.3.1. By Country

        12.3.2. By Device

        12.3.3. By Application

        12.3.4. By End-Use

    12.4. Key Takeaways

13. South Asia and Pacific Market Analysis 2019 to 2023 and Forecast 2024 to 2034, By Country

    13.1. Historical Market Size Value (US$ Million) & Volume (Units) Trend Analysis By Market Taxonomy, 2019 to 2023

    13.2. Market Size Value (US$ Million) & Volume (Units) Forecast By Market Taxonomy, 2024 to 2034

        13.2.1. By Country

            13.2.1.1. India

            13.2.1.2. Bangladesh

            13.2.1.3. Australia

            13.2.1.4. New Zealand

            13.2.1.5. Rest of South Asia and Pacific

        13.2.2. By Device

        13.2.3. By Application

        13.2.4. By End-Use

    13.3. Market Attractiveness Analysis

        13.3.1. By Country

        13.3.2. By Device

        13.3.3. By Application

        13.3.4. By End-Use

    13.4. Key Takeaways

14. East Asia Market Analysis 2019 to 2023 and Forecast 2024 to 2034, By Country

    14.1. Historical Market Size Value (US$ Million) & Volume (Units) Trend Analysis By Market Taxonomy, 2019 to 2023

    14.2. Market Size Value (US$ Million) & Volume (Units) Forecast By Market Taxonomy, 2024 to 2034

        14.2.1. By Country

            14.2.1.1. China

            14.2.1.2. Japan

            14.2.1.3. South Korea

        14.2.2. By Device

        14.2.3. By Application

        14.2.4. By End-Use

    14.3. Market Attractiveness Analysis

        14.3.1. By Country

        14.3.2. By Device

        14.3.3. By Application

        14.3.4. By End-Use

    14.4. Key Takeaways

15. Middle East and Africa Market Analysis 2019 to 2023 and Forecast 2024 to 2034, By Country

    15.1. Historical Market Size Value (US$ Million) & Volume (Units) Trend Analysis By Market Taxonomy, 2019 to 2023

    15.2. Market Size Value (US$ Million) & Volume (Units) Forecast By Market Taxonomy, 2024 to 2034

        15.2.1. By Country

            15.2.1.1. GCC Countries

            15.2.1.2. South Africa

            15.2.1.3. Israel

            15.2.1.4. Rest of MEA

        15.2.2. By Device

        15.2.3. By Application

        15.2.4. By End-Use

    15.3. Market Attractiveness Analysis

        15.3.1. By Country

        15.3.2. By Device

        15.3.3. By Application

        15.3.4. By End-Use

    15.4. Key Takeaways

16. Key Countries Market Analysis

    16.1. USA

        16.1.1. Pricing Analysis

        16.1.2. Market Share Analysis, 2023

            16.1.2.1. By Device

            16.1.2.2. By Application

            16.1.2.3. By End-Use

    16.2. Canada

        16.2.1. Pricing Analysis

        16.2.2. Market Share Analysis, 2023

            16.2.2.1. By Device

            16.2.2.2. By Application

            16.2.2.3. By End-Use

    16.3. Brazil

        16.3.1. Pricing Analysis

        16.3.2. Market Share Analysis, 2023

            16.3.2.1. By Device

            16.3.2.2. By Application

            16.3.2.3. By End-Use

    16.4. Mexico

        16.4.1. Pricing Analysis

        16.4.2. Market Share Analysis, 2023

            16.4.2.1. By Device

            16.4.2.2. By Application

            16.4.2.3. By End-Use

    16.5. Germany

        16.5.1. Pricing Analysis

        16.5.2. Market Share Analysis, 2023

            16.5.2.1. By Device

            16.5.2.2. By Application

            16.5.2.3. By End-Use

    16.6. UK

        16.6.1. Pricing Analysis

        16.6.2. Market Share Analysis, 2023

            16.6.2.1. By Device

            16.6.2.2. By Application

            16.6.2.3. By End-Use

    16.7. France

        16.7.1. Pricing Analysis

        16.7.2. Market Share Analysis, 2023

            16.7.2.1. By Device

            16.7.2.2. By Application

            16.7.2.3. By End-Use

    16.8. Spain

        16.8.1. Pricing Analysis

        16.8.2. Market Share Analysis, 2023

            16.8.2.1. By Device

            16.8.2.2. By Application

            16.8.2.3. By End-Use

    16.9. Italy

        16.9.1. Pricing Analysis

        16.9.2. Market Share Analysis, 2023

            16.9.2.1. By Device

            16.9.2.2. By Application

            16.9.2.3. By End-Use

    16.10. Poland

        16.10.1. Pricing Analysis

        16.10.2. Market Share Analysis, 2023

            16.10.2.1. By Device

            16.10.2.2. By Application

            16.10.2.3. By End-Use

    16.11. Russia

        16.11.1. Pricing Analysis

        16.11.2. Market Share Analysis, 2023

            16.11.2.1. By Device

            16.11.2.2. By Application

            16.11.2.3. By End-Use

    16.12. Czech Republic

        16.12.1. Pricing Analysis

        16.12.2. Market Share Analysis, 2023

            16.12.2.1. By Device

            16.12.2.2. By Application

            16.12.2.3. By End-Use

    16.13. Romania

        16.13.1. Pricing Analysis

        16.13.2. Market Share Analysis, 2023

            16.13.2.1. By Device

            16.13.2.2. By Application

            16.13.2.3. By End-Use

    16.14. India

        16.14.1. Pricing Analysis

        16.14.2. Market Share Analysis, 2023

            16.14.2.1. By Device

            16.14.2.2. By Application

            16.14.2.3. By End-Use

    16.15. Bangladesh

        16.15.1. Pricing Analysis

        16.15.2. Market Share Analysis, 2023

            16.15.2.1. By Device

            16.15.2.2. By Application

            16.15.2.3. By End-Use

    16.16. Australia

        16.16.1. Pricing Analysis

        16.16.2. Market Share Analysis, 2023

            16.16.2.1. By Device

            16.16.2.2. By Application

            16.16.2.3. By End-Use

    16.17. New Zealand

        16.17.1. Pricing Analysis

        16.17.2. Market Share Analysis, 2023

            16.17.2.1. By Device

            16.17.2.2. By Application

            16.17.2.3. By End-Use

    16.18. China

        16.18.1. Pricing Analysis

        16.18.2. Market Share Analysis, 2023

            16.18.2.1. By Device

            16.18.2.2. By Application

            16.18.2.3. By End-Use

    16.19. Japan

        16.19.1. Pricing Analysis

        16.19.2. Market Share Analysis, 2023

            16.19.2.1. By Device

            16.19.2.2. By Application

            16.19.2.3. By End-Use

    16.20. South Korea

        16.20.1. Pricing Analysis

        16.20.2. Market Share Analysis, 2023

            16.20.2.1. By Device

            16.20.2.2. By Application

            16.20.2.3. By End-Use

    16.21. GCC Countries

        16.21.1. Pricing Analysis

        16.21.2. Market Share Analysis, 2023

            16.21.2.1. By Device

            16.21.2.2. By Application

            16.21.2.3. By End-Use

    16.22. South Africa

        16.22.1. Pricing Analysis

        16.22.2. Market Share Analysis, 2023

            16.22.2.1. By Device

            16.22.2.2. By Application

            16.22.2.3. By End-Use

    16.23. Israel

        16.23.1. Pricing Analysis

        16.23.2. Market Share Analysis, 2023

            16.23.2.1. By Device

            16.23.2.2. By Application

            16.23.2.3. By End-Use

17. Market Structure Analysis

    17.1. Competition Dashboard

    17.2. Competition Benchmarking

    17.3. Market Share Analysis of Top Players

        17.3.1. By Regional

        17.3.2. By Device

        17.3.3. By Application

        17.3.4. By End-Use

18. Competition Analysis

    18.1. Competition Deep Dive

        18.1.1. Synaptive Medical

            18.1.1.1. Overview

            18.1.1.2. Product Portfolio

            18.1.1.3. Profitability by Market Segments

            18.1.1.4. Sales Footprint

            18.1.1.5. Strategy Overview

                18.1.1.5.1. Marketing Strategy

                18.1.1.5.2. Product Strategy

                18.1.1.5.3. Channel Strategy

        18.1.2. HAAG-STREIT Surgical GmbH

            18.1.2.1. Overview

            18.1.2.2. Product Portfolio

            18.1.2.3. Profitability by Market Segments

            18.1.2.4. Sales Footprint

            18.1.2.5. Strategy Overview

                18.1.2.5.1. Marketing Strategy

                18.1.2.5.2. Product Strategy

                18.1.2.5.3. Channel Strategy

        18.1.3. Topcon Corporation

            18.1.3.1. Overview

            18.1.3.2. Product Portfolio

            18.1.3.3. Profitability by Market Segments

            18.1.3.4. Sales Footprint

            18.1.3.5. Strategy Overview

                18.1.3.5.1. Marketing Strategy

                18.1.3.5.2. Product Strategy

                18.1.3.5.3. Channel Strategy

        18.1.4. Seiler Instrument Inc.

            18.1.4.1. Overview

            18.1.4.2. Product Portfolio

            18.1.4.3. Profitability by Market Segments

            18.1.4.4. Sales Footprint

            18.1.4.5. Strategy Overview

                18.1.4.5.1. Marketing Strategy

                18.1.4.5.2. Product Strategy

                18.1.4.5.3. Channel Strategy

        18.1.5. Leica Microsystems

            18.1.5.1. Overview

            18.1.5.2. Product Portfolio

            18.1.5.3. Profitability by Market Segments

            18.1.5.4. Sales Footprint

            18.1.5.5. Strategy Overview

                18.1.5.5.1. Marketing Strategy

                18.1.5.5.2. Product Strategy

                18.1.5.5.3. Channel Strategy

        18.1.6. TAKAgi Seiko Co., LTD

            18.1.6.1. Overview

            18.1.6.2. Product Portfolio

            18.1.6.3. Profitability by Market Segments

            18.1.6.4. Sales Footprint

            18.1.6.5. Strategy Overview

                18.1.6.5.1. Marketing Strategy

                18.1.6.5.2. Product Strategy

                18.1.6.5.3. Channel Strategy

        18.1.7. Carl Zeiss

            18.1.7.1. Overview

            18.1.7.2. Product Portfolio

            18.1.7.3. Profitability by Market Segments

            18.1.7.4. Sales Footprint

            18.1.7.5. Strategy Overview

                18.1.7.5.1. Marketing Strategy

                18.1.7.5.2. Product Strategy

                18.1.7.5.3. Channel Strategy

        18.1.8. Olympus Corporation

            18.1.8.1. Overview

            18.1.8.2. Product Portfolio

            18.1.8.3. Profitability by Market Segments

            18.1.8.4. Sales Footprint

            18.1.8.5. Strategy Overview

                18.1.8.5.1. Marketing Strategy

                18.1.8.5.2. Product Strategy

                18.1.8.5.3. Channel Strategy

        18.1.9. Topcon Medical Systems, Inc

            18.1.9.1. Overview

            18.1.9.2. Product Portfolio

            18.1.9.3. Profitability by Market Segments

            18.1.9.4. Sales Footprint

            18.1.9.5. Strategy Overview

                18.1.9.5.1. Marketing Strategy

                18.1.9.5.2. Product Strategy

                18.1.9.5.3. Channel Strategy

        18.1.10. Alcon Laboratories, Inc

            18.1.10.1. Overview

            18.1.10.2. Product Portfolio

            18.1.10.3. Profitability by Market Segments

            18.1.10.4. Sales Footprint

            18.1.10.5. Strategy Overview

                18.1.10.5.1. Marketing Strategy

                18.1.10.5.2. Product Strategy

                18.1.10.5.3. Channel Strategy

19. Assumptions & Acronyms Used

20. Research Methodology

Recommendations

Healthcare

3D Surgical Microscope Systems Market

November 2017

REP-GB-5499

July 2023

306 pages

Healthcare

Robot Assisted Surgical Microscope Market

July 2023

REP-GB-17602

250 pages

Explore Healthcare Insights

View Reports
Future Market Insights

Surgical Operating Microscope Market