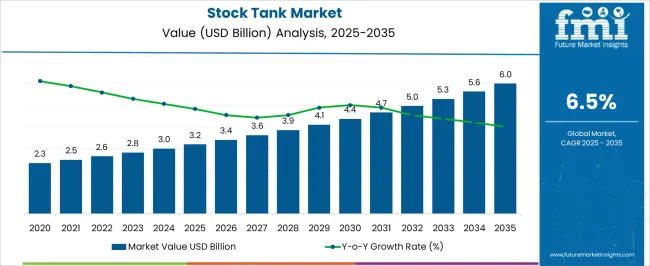
The Stock Tank Market is estimated to be valued at USD 3.2 billion in 2025 and is projected to reach USD 6.0 billion by 2035, registering a compound annual growth rate (CAGR) of 6.5% over the forecast period.
| Metric | Value |
|---|---|
| Stock Tank Market Estimated Value in (2025 E) | USD 3.2 billion |
| Stock Tank Market Forecast Value in (2035 F) | USD 6.0 billion |
| Forecast CAGR (2025 to 2035) | 6.5% |
The stock tank market is witnessing consistent growth as sustainability in water storage, livestock management efficiency, and demand for durable agricultural infrastructure converge. Adoption is being fueled by the rising need for reliable water containment solutions in agriculture and animal husbandry.
Manufacturers are focusing on enhancing product longevity through advanced materials and corrosion-resistant coatings, which is creating differentiation in the market. Growing awareness of water conservation practices and modernization of livestock farming techniques are also driving the uptake of high-quality stock tanks.
Future growth is expected to be supported by continued innovation in design, increasing farm mechanization, and investments in rural infrastructure. The ability of stock tanks to serve multiple purposes while reducing operational downtime is paving the way for broader adoption across diverse end-use scenarios.
The market is segmented by Type and Application and region. By Type, the market is divided into Round, Square, Triangle, and Others. In terms of Application, the market is classified into Agricultural, Household, and Others. Regionally, the market is classified into North America, Latin America, Western Europe, Eastern Europe, Balkan & Baltic Countries, Russia & Belarus, Central Asia, East Asia, South Asia & Pacific, and the Middle East & Africa.
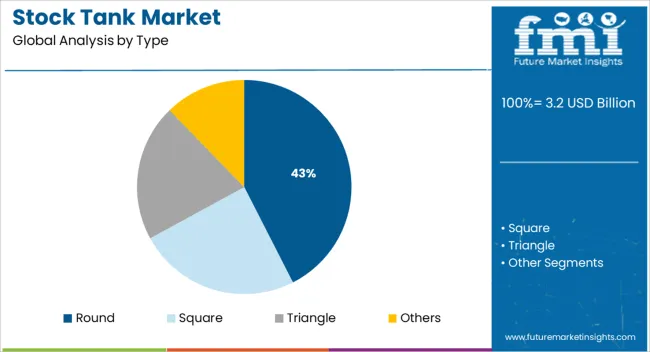
When segmented by type, the round segment is projected to hold 42.50% of the total market revenue in 2025, establishing itself as the leading type. This leadership is attributed to its structural efficiency, which evenly distributes water pressure and minimizes stress on the tank walls, ensuring greater durability.
The round design facilitates easier cleaning and maintenance, which is essential for maintaining water quality in agricultural and livestock applications. Manufacturers have also favored round tanks for their cost-effective production and logistical advantages, further reinforcing their dominance.
Enhanced capacity utilization and improved resistance to deformation under load have positioned round tanks as the preferred choice where longevity and performance are critical, securing their continued prominence in the market.
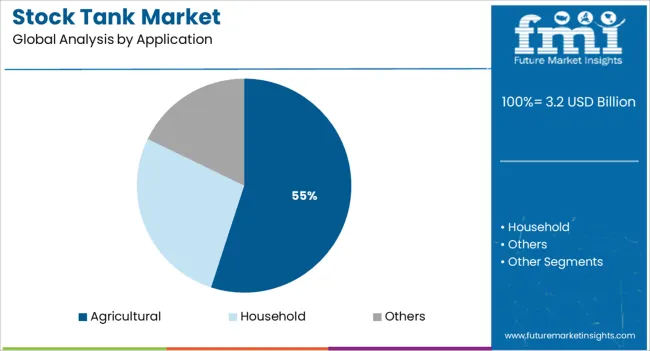
Segmented by application, the agricultural segment is expected to account for 55.00% of the stock tank market revenue in 2025, maintaining its leading position. This dominance has been reinforced by the vital role of stock tanks in supporting livestock hydration, irrigation, and feed storage within modern farming operations.
Agricultural end users have adopted stock tanks extensively due to their versatility, durability, and ability to withstand harsh outdoor conditions, which aligns with the rigorous demands of farming environments. The sector’s growing emphasis on animal welfare, efficient water use, and mechanized farming practices has further accelerated adoption.
Additionally, investments in farm infrastructure and the need for scalable, cost-efficient solutions have consolidated the agricultural segment’s leadership, ensuring its sustained growth in the evolving market landscape.
For dairy cattle, having a sufficient supply of high-quality water is crucial. Cows are generally always given free access to clean water by farmers. The amount of milk produced, the amount of moisture in the diet, and climatic elements like air temperature and humidity all have an impact on lactation cows' water needs.
Stock tanks are large metal buckets designed specifically to provide horses, cattle, and other livestock with drinking water. These are generally man-made water reservoirs. Demand for stock tanks is growing since they can be used in a personalized way for various purposes. A variety of stock tank designs are utilized as watering ponds for cattle, goats, and sheep. Farms prefer using stock tanks as these tanks come in various configurations, including round tanks, poly stock round tanks, and long oval tanks. They prevent the water from getting too hot, buildup, breeding mosquitoes, and algae growth as they move and shift the stock tank water.
Modern dairy farming, which uses up-to-date technology, is replacing traditional dairy farming in the farming industry. These instruments are crucial for improving animal health, increasing productivity, and having a simple farming method. During this forecast period, demand for dairy farming equipment is likely to increase due to an increase in efforts to upsurge product output. This is expected to affect the sales of stock tanks positively.
The necessity for farm mechanization has expanded over the past few years. This has boosted the requirement for various types of farm equipment including stock tanks. In the upcoming years, the demand for dairy products is also anticipated to be fueled by the expanding food and beverage sector. This has been brought on by the growing world population.
Furthermore, the rising government efforts and policies in favor of the usage of farm equipment are projected to drive the stock tank market. These government initiatives are meant to boost the growth of the dairy farming sector. Several governments are offering funds to both small and large farms to assist them to adopt sustainable farming methods. Hence, with these funds, farms would increase output by adopting the latest equipment and technology.
To preserve the well-being of animals and safeguard them from illnesses, society is placing attention on business practices and animal welfare. These laws regulate cattle housing and management practices. Thus, it is anticipated that throughout the forecast period, these factors would hinder the growth of the worldwide stock tank market.
Algae in stock tanks can be hazardous to livestock in addition to being an irritant. Algae of several species can flourish and develop in livestock water tanks. Algae can develop in warm climates, animal saliva, sunlight, and the addition of organic material like manure.
One significant element restricting the market is the increased expenses associated with stock tank maintenance and servicing. This constraint prevents small farm operators from making substantial expenditures in advanced stock tanks. Small and medium-sized farm owners thus adhere to conventional drinking procedures. Therefore, during the forecast period, these factors are anticipated to hamper the worldwide stock tank market.
Massive investment has been drawn to the dairy industry due to the rising demand for dairy products like milk, cream, butter, and cheese. This increases the requirement for the creation of productive and affordable dairy farming equipment, including a stock tank. Industry leaders have shown a strong tendency towards the creation of unique and affordable technologies to take advantage of this opportunity.
Owing to its effectiveness as a cost-effective source of protein, the demand for milk and its products has grown recently. As a result, dairy product consumption is likely to rise over the forecast period. This tendency is expected to lead to a greater uptake of contemporary dairy farming machinery. Farm owners are likely to utilize drinking equipment to keep the well-being of the cattle, especially in summer. This is anticipated to lead to new market opportunities
The stock tank market is estimated to flourish at 6.5% CAGR between 2025 and 2035. Historically, the market value of stock tanks showed sluggish growth from 2020 to 2025, registering a CAGR of 5.8%.
There is a rising demand for milk and dairy products including cream, butter, and cheese. This demand is predicted to rise significantly as the world's population rises. Dairy products are also predicted to see a significant increase in demand since they are an inexpensive source of protein. This calls for more modern infrastructure and facilities for managing animals. The market for stock tanks is expected to increase largely due to innovation and the widespread use of dairy farming equipment.
Since they greatly simplify a farmer's work, stock tanks have become much more prevalent. A stock tank is a simplest and most efficient way to give farm animals access to water when, for example, summer comes and they are in need. For instance, Behlen stock tanks are easily transportable and appropriate for dairy farms. As a result, these factors are anticipated to fuel the growth of the global market for stock tanks over the forecast period.
| Historical CAGR (2020 to 2025) | 5.8% |
|---|---|
| Forecast CAGR (2025 to 2035) | 6.5% |
Short Term (2025 to 2029): High expenditures in technology, increasing demand for high-quality dairy products, optimizing productivity, and reducing carbon footprint are projected to fuel stock tank market expansion.
Medium Term (2029 to 2035): Major industry participants are focusing their efforts on developing front-line equipment and technology to increase output and boost animal health and productivity. This is likely to force market expansion.
Long Term (2035 to 2035): Over the past several years, there has been a substantial increase in the selling of stock tanks via e-commerce websites. E-commerce is anticipated to play a key role in improving access to affordable stock tanks, particularly in the Asia Pacific.
On the back of these factors, the stock tank market is likely to grow 1.8X between 2025 and 2035. As per the analysts, a valuation of USD 60 Billion by 2035 end is estimated for the market.
| Year | Valuation |
|---|---|
| 2020 | USD 1.88 Billion |
| 2024 | USD 2.50 Billion |
| 2025 | USD 2.65 Billion |
| 2025 | USD 2.82 Billion |
| 2035 | USD 60 Billion |
In terms of revenue, North America dominates the stock tank market followed by Europe. North American and European markets are predicted to benefit from rising agricultural equipment imports and exports as well as the presence of major players.
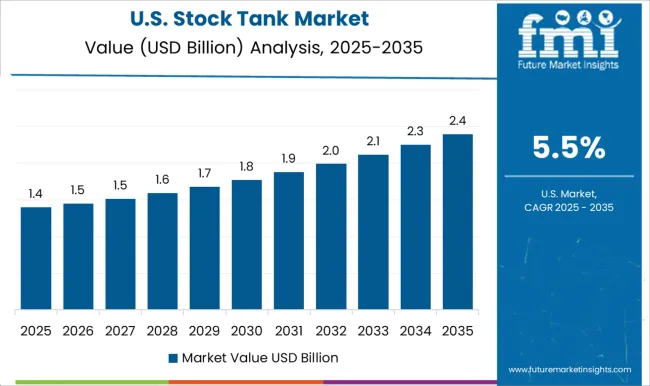
The United States is a significant player in the global dairy sector in addition to being a leader in North America. Several factors are now driving the US organic dairy sector. Due to their growing health consciousness, consumers in the nation are converting to dairy products made organically. Additionally, the growing knowledge of these goods' health advantages has increased demand for them in the US.
| Country | United States |
|---|---|
| Market Share (2025) | 26.50% |
| Market Value (2025) | USD 702 Million |
Demand for organic dairy products requires livestock farmers to emphasize the production quality of milk. In addition to this, growing concerns about the diseases cattle suffer from which can be transmitted to humans creates an adoption window for hygienic stock tanks, As a result, manufacturers ensure that their products are corrosion-resistant, can be cleaned easily, and used for a long time. Hence, the US stock tank market is expected to witness massive growth opportunities.
Nations like the UK and Germany have a growing demand for farm equipment as a result of a manpower shortage in these nations. Hence, Europe is predicted to have considerable expansion in the stock tank industry.
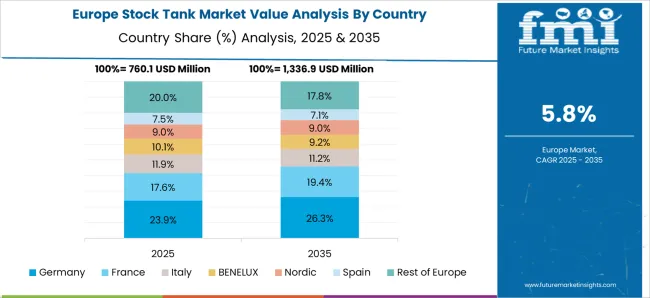
German stock tank market is the largest in Europe owing to the advancements in technology and improvements in the management of cattle. In Germany, cooperatives play a significant role in the sector since individual dairy farmers sometimes struggle to meet the volume requirements set by big-ticket clients.
| Country | Germany |
|---|---|
| Market Share (2025) | 17.50% |
| Market Value (2025) | USD 464.2 Million |
Moreover, a farm could well be exposed to disruptions in the water supply due to extreme weather and temperature fluctuations. This directly increases the adoption of stock tanks to maintain the well-being of cattle. For effective livestock management, it is crucial to provide adequate and high-quality water.
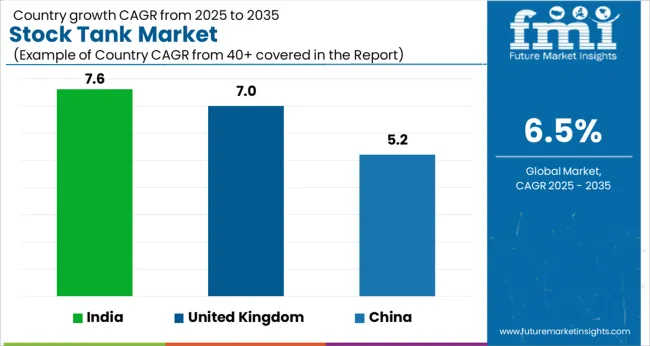
According to UN statistics, the United Kingdom is the thirteenth-largest milk producer in the world. A government briefing paper published in September 2024 states that milk accounted for 16.4% of the nation's overall agricultural production in 2024. Rising health consciousness is anticipated to fuel the industry as well. As a result, dairy farming in the country is anticipated to accelerate over the forecast period. This is expected to increase the adoption of dairy farming equipment including stock tanks.
| Country | United Kingdom |
|---|---|
| CAGR (2025) | 7% |
| Market Share (2025) | 9.60% |
| Market Value (2025) | USD 254.4 Million |
| Market Value (2035) | USD 499.2 Million |
Large galvanized steel water tanks for farming and horticultural sectors are provided by local manufacturers. Farms prefer using these stock tanks as they are designed to survive the unpredictable outside climate and range of chemical ingredients. Although rainwater harvesting has been practiced for a long time, it has only recently gained attention due to the impact of rising costs for municipal water supplies on agriculture and other commercial and industrial uses. This trend is anticipated to positively affect the UK stock tank market.
Over the last three decades, China's livestock sector has seen a significant transformation. It has had a significant impact on both the local and global food supply. China saw a threefold increase in the number of livestock units in less than 30 years. This is mostly due to the development of landless industrial livestock production systems and the rise of monogastric animals. Demand and supply for new kinds of animals, new technologies, and government backing all contributed to changes.
| Country | China |
|---|---|
| CAGR (2025) | 5.20% |
| Market Share (2025) | 10.20% |
| Market Value (2025) | USD 270.64 Million |
| Market Value (2035) | USD 449.8 Million |
In terms of milk production, China secures third place globally. Given the present Chinese trend, it appears that farming businesses will soon grow even larger. Modern farming is paving the path for the business. This is anticipated to speed up the adoption of stock tanks. Since the majority of the nation experiences warm to scorching summers, manufacturers in the Chinese stock tank market are likely to experience growth prospects by creating galvanized steel stock tanks. These are built to resist the most extreme agricultural and ranch environments.
With a consistent increase in the supply of milk and milk derivatives, India has been the world's top producer and consumer of dairy products since 1998. The market is being favorably impacted by several important reasons, including India's expanding population and increased consumption of meat and dairy products.
| Country | India |
|---|---|
| CAGR (2025) | 7.60% |
| Market Share (2025) | 3.60% |
| Market Value (2025) | USD 94.7 Million |
| Market Value (2035) | USD 197.7 Million |
The dairy sector in India not only provides lucrative business opportunities but also promotes socio-economic growth. With this in mind, the Indian government has launched many programs and initiatives targeted at growing the dairy industry in the nation. For instance, the "National Dairy Program (Phase-I)" seeks to raise milk output and boost cow productivity while improving and expanding the infrastructure for rural milk procurement and giving farmers better market access.
Furthermore, the expansion of e-commerce channels and online pharmacies in India is offering lucrative growth opportunities to stock tank market players. Behlen stock tanks, which are preferred by international farms, are widely available on Indian e-commerce websites.
For Japan, agriculture has always been of utmost significance. The Japanese government has been assisting the farming industry with several programs in an attempt to stabilize production and find strategies to guarantee that the industry is expanding healthily and sustainably. The Japanese government has always been a strong advocate for farming.
| Country | Japan |
|---|---|
| Market Share (2025) | 4.80% |
| Market Value (2025) | USD 128.6 Million |
The overall number of dairy cows and calves as of February 2024 has risen by 0.3% annually, according to Livestock Statistics, a publication from the Ministry of Agriculture, Forestry and Fisheries (MAFF). Hence, businesses are likely to encounter a huge potential for trades in the Japanese stock tank market. Companies like Behlen have already identified the opportunity in Japan. Behlen stock tanks are widely available in Japan.
The global market for stock tanks is segmented based on type, application, and region.
For several reasons, round stock tanks are preferable to other tank shapes. The most affordable, sturdy, ergonomic, and hygienic stock tanks are round ones. Given that they offer the highest financial value, the farming sector prefers to purchase them. They can survive harsh winds and flooding and are geometrically sturdier than any other stock tank.
Round stock tanks are easier to maintain than other shaped tanks and distribute heat to keep the water cold during the summer months. Moreover, since less carbon is released during manufacture, stainless steel round stock tanks are not only more durable but also more environmentally friendly.
Stock tanks are essential for the farming industry. The primary function of a stock tank is to supply horses and cattle with clean and fresh water for drinking. Additionally, farmers sometimes also utilize stock tanks as sizable elevated soil-filled containers in which to grow flowers, herbs, and vegetables.
With the help of these stock tanks, a lot of animals can drink water at the same time. Moreover, it takes manpower to supply water for dairy farms in conventional ways. However, stock tanks are huge and do not require regular maintenance. Owing to these factors, the farming sector heavily relies on stock tanks.
Demand for equipment used in dairy farming is anticipated to rise as a result of the preference for dairy products among consumers globally. The market for stock tanks is highly consolidated, with Behlen holding a sizable portion of it. Recent entrants into the stock tank industry contemplate that increasing their competitive edge is necessary to break into this competitive sector. They spend a lot of money on Research and Development and concentrate on new introductions to get traction in the global stock tank industry.
Punchy Cattle Company and Tank Supply - United States
This startup company has created a storage tank with a water trough unlike any other on the market right now. It offers a variety of items that are strong, durable, and constructed from high-quality materials. Its round water trough and storage tank can be made of fiberglass or steel. Wildlife, sheep, goats, calves, and cows can all use this system. The integrated water storage tank is amid the 18"-high water trough. Every tank has an integrated float box, 2 floats, a manhole, a varmint escape ramp, and internal and exterior ladders
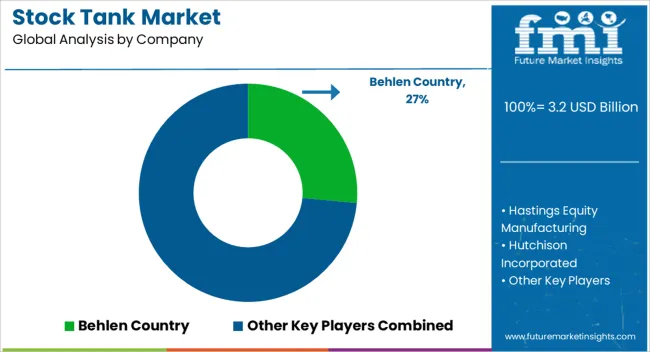
Behlen Mfg. Co. was established in 1936 and is based in Columbus, Nebraska. The company is made up of three distinct business divisions: Behlen Country, a maker of livestock equipment, Behlen Building Systems, a Construction Company, and International and Diversified Products (grain systems, strip joining presses, and custom fabrication). As it has the largest stake in the parent business and offers high-quality steel products all over the world, Behlen Country is the primary subsidiary of Behlen Mfg. Co. It provides a wide range of goods, including gates and panels, tanks/waterers, feeders, cattle handling, horse equipment, small animal/pet equipment, and residential designs.
Other Companies Trying to Get Strong Foothold
Hastings Equity Manufacturing is a company based in Hastings, Nebraska, and was founded in 1910. Steel and polyethylene stock tanks are the company's major product lines. To meet the demands of the agricultural and industrial sectors, it offers other business units such as feeders, accessories, and tertiary confinement. Hastings Equity Manufacturing was obtained by Dutton-Lainson Company in 2011, a significant manufacturing, printing, and distribution business in the Midwest.
Hutchison Incorporated was established in the United States in 1952. There are five divisions within it. The two stock tank divisions are among these five divisions. Manufacturer of steel stock tanks under the HW Brand, Hutchison Western also sells farm supplies and livestock equipment. Steel stock tanks are manufactured in Logan Valley and utilized for containment projects at oil field locations, as well as for rehydrating cattle and chilling beverages. It is active in separate US sites.
What are Competitors in the Stock Tank Market doing at this Moment?
The global stock tank market is estimated to be valued at USD 3.2 billion in 2025.
The market size for the stock tank market is projected to reach USD 6.0 billion by 2035.
The stock tank market is expected to grow at a 6.5% CAGR between 2025 and 2035.
The key product types in stock tank market are round, square, triangle and others.
In terms of application, agricultural segment to command 55.0% share in the stock tank market in 2025.


Our Research Products

The "Full Research Suite" delivers actionable market intel, deep dives on markets or technologies, so clients act faster, cut risk, and unlock growth.

The Leaderboard benchmarks and ranks top vendors, classifying them as Established Leaders, Leading Challengers, or Disruptors & Challengers.

Locates where complements amplify value and substitutes erode it, forecasting net impact by horizon

We deliver granular, decision-grade intel: market sizing, 5-year forecasts, pricing, adoption, usage, revenue, and operational KPIs—plus competitor tracking, regulation, and value chains—across 60 countries broadly.

Spot the shifts before they hit your P&L. We track inflection points, adoption curves, pricing moves, and ecosystem plays to show where demand is heading, why it is changing, and what to do next across high-growth markets and disruptive tech

Real-time reads of user behavior. We track shifting priorities, perceptions of today’s and next-gen services, and provider experience, then pace how fast tech moves from trial to adoption, blending buyer, consumer, and channel inputs with social signals (#WhySwitch, #UX).

Partner with our analyst team to build a custom report designed around your business priorities. From analysing market trends to assessing competitors or crafting bespoke datasets, we tailor insights to your needs.
Supplier Intelligence
Discovery & Profiling
Capacity & Footprint
Performance & Risk
Compliance & Governance
Commercial Readiness
Who Supplies Whom
Scorecards & Shortlists
Playbooks & Docs
Category Intelligence
Definition & Scope
Demand & Use Cases
Cost Drivers
Market Structure
Supply Chain Map
Trade & Policy
Operating Norms
Deliverables
Buyer Intelligence
Account Basics
Spend & Scope
Procurement Model
Vendor Requirements
Terms & Policies
Entry Strategy
Pain Points & Triggers
Outputs
Pricing Analysis
Benchmarks
Trends
Should-Cost
Indexation
Landed Cost
Commercial Terms
Deliverables
Brand Analysis
Positioning & Value Prop
Share & Presence
Customer Evidence
Go-to-Market
Digital & Reputation
Compliance & Trust
KPIs & Gaps
Outputs
Full Research Suite comprises of:
Market outlook & trends analysis
Interviews & case studies
Strategic recommendations
Vendor profiles & capabilities analysis
5-year forecasts
8 regions and 60+ country-level data splits
Market segment data splits
12 months of continuous data updates
DELIVERED AS:
PDF EXCEL ONLINE
Stock Cubes Market Size and Share Forecast Outlook 2025 to 2035
Stock Trading App Market Size and Share Forecast Outlook 2025 to 2035
Tanker Truck Market Size and Share Forecast Outlook 2025 to 2035
Tank Insulation Market Growth – Trends & Forecast 2024-2034
Stock Clamshell Packaging Market
LNG Tank Containers Market Size and Share Forecast Outlook 2025 to 2035
Livestock Panel Gates Market Size and Share Forecast Outlook 2025 to 2035
Livestock Trailer Market Size and Share Forecast Outlook 2025 to 2035
CNG Tanks Cylinders Market Growth - Trends & Forecast 2025 to 2035
ISO Tank Container Market Growth – Trends & Forecast 2024-2034
CIP Tank Market Growth – Trends & Forecast 2024-2034
Ink Tank Printer Market
Livestock Monitoring System Market
Rail Tank Cars Market Size and Share Forecast Outlook 2025 to 2035
Fish Tank Water Additives Market Trends - Growth & Demand Forecast 2025 to 2035
Milk Tank Cooling System Market Growth – Trends & Forecast 2025 to 2035
Global Live Stock Vaccine Market Analysis – Size, Share & Forecast 2024-2034
Brine Tank for Water Softener Market Size and Share Forecast Outlook 2025 to 2035
Water Tanker Truck Market Size and Share Forecast Outlook 2025 to 2035
Surge Tanks Market Growth - Trends & Forecast 2025 to 2035

Thank you!
You will receive an email from our Business Development Manager. Please be sure to check your SPAM/JUNK folder too.
Chat With
MaRIA