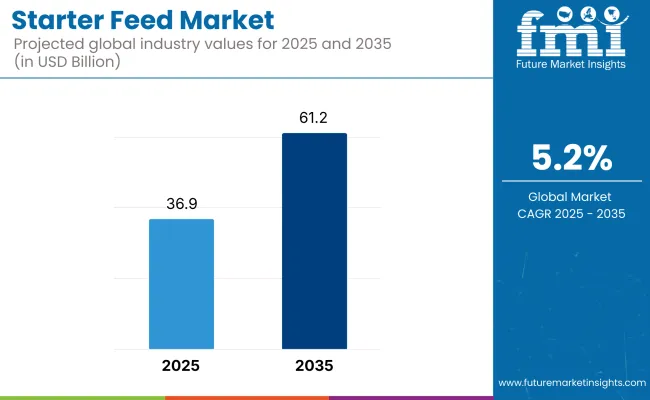
The global starter feed market is estimated to be valued at USD 36.9 billion in 2025. It is projected to reach USD 61.2 billion by 2035, expanding at a CAGR of 5.2% over the assessment period.
The escalated demand for feed formulations that are nutritionally balanced and add value to livestock and poultry at the initial growth stage is driving continuous advancement. Starter feed is the type of feed containing all the necessary elements that young animals need to gain weight and enhance immunity and overall health; thus, it is designed primarily for them. The ascendant need for high-performance feeder solutions is driving the livestock and poultry industry to expand.
One of the principal drivers of growth is the rising focus on improving feed efficiency as well as livestock productivity. Farmers and feed manufacturers are using formulations for various species of animals like poultry chicks, piglets, and calves to ensure the best first-stage nutrition possible. In addition, the quest for antibiotic-free and organic feed is on the rise as manufacturers are adopting sustainable and natural animal nutrition methods.
Intensive farming practices and commercial livestock production are also expanding due to the high demand for premium feed products. Livestock producers are being affected by the increasing global appetite for meat, dairy, and eggs, so they are turning to the application of scientific methods such as tailor-made feeds for fast and healthy growth. Also, the advancements in microbial encapsulation and enzyme supplementation feed technologies are involved in the matter by enhancing the young animals' digestion processes and nutrient absorption rates.
New technologies of feed formulation and ingredient sourcing are improving the quality and efficiency of feed products. The inclusion of probiotics, prebiotics, and essential amino acids further optimizes the gut health and immunity of young livestock and improves their growth rates. Furthermore, the use of precision feeding systems and automated feed management helps simplify livestock nutrition strategies.
Several challenges exist, such as varying raw material costs, regulations imposing limitations on feed additives, and doubts about contamination and feed safety. Additionally, there are concerns that traditional on-farm feed preparation technologies may compete with the adoption of commercial solutions.
The industry is growing strongly due to the increasing demand for high-quality, growth-promoting feeds that nurture young livestock in their formative years. In the poultry industry, where quick growth is a must, high-protein feeds with necessary vitamins and amino acids are creating demand and driving innovation.
Gut health, digestibility, and immune system support are priorities for pigs and ruminants, and probiotic and prebiotic supplements are becoming more popular. For aquaculture, the industry is moving toward sustainable, plant-sourced protein substitutes for conventional fish meal in the feed mix.
Sustainability and feed natural additives are influencing purchase decisions, especially for ruminants and aquaculture, as organic and antibiotic-free lines become increasingly popular. Companies integrating functional ingredients, supporting feed conversion efficacy, and working in support of sustainability concepts will take an important share in the forthcoming industry.
From 2020 to 2024, large animal nutrition and agriculture companies led the development of innovations and sustainability in forage production. Companies like Cargill, ADM, and ForFarmers introduced new-generation forage storage technologies, e.g., high-performance silage inoculants, which promoted fermentation and extended storage life.
Barenbrug and DLF Seeds created climate-resilient forage seeds, such as drought-resistant alfalfa and fast-establishing ryegrass mixes, enabling farmers to cope with fluctuating weather patterns. The Alltech and Lallemand companies invested in yeast-based and microbial inoculant enhancers to enhance fiber digestibility and promote livestock gut health.
AeroFarms and HydroGreen diversified into hydroponic and vertical forage production, facilitating greater year-round availability of forage in water-limited regions. Supply chain disruptions, fluctuating input costs, and competition for land were issues, but low-cost production was the priority. Leaders in the forage industry will encourage more rapid innovation in precision agriculture, biotechnology, and remote sensing from 2025 to 2035.
Trimble and John Deere's AI-driven agronomy offerings will enhance planting and harvest schedules for maximum efficiency. Syngenta and Corteva Agriscience will develop gene-edited forage crops that are more digestible and contain fewer anti-nutritional factors. Kubota and CLAAS autonomous machinery will transform harvesting efficiency, ensuring reduced reliance on manpower.
Forage enhancement by fermentation by Novozymes and BASF will optimize fiber breakdown to ensure higher nutrient absorption. Nestlé and Danone's circular economy initiatives will spur the utilization of agro-industrial waste in sustainable forage options. IBM Food Trust and SAP blockchain traceability systems will facilitate visibility and sustainability compliance and increasingly build trust in the supply chain.
A Comparative Market Shift Analysis (2020 to 2024 vs. 2025 to 2035)
| 2020 to 2024 | 2025 to 2035 |
|---|---|
| Growing demand for high-quality, nutrient-rich feed products. | AI-driven precision nutrition for species-formulated solutions. |
| Transition to antibiotic-free feed formulation. | Government support for natural feed additives replacing antibiotics. |
| Growing application of probiotics, prebiotics, and essential amino acids. | Microencapsulation to enhance stability and targeted delivery of the nutrients. |
| Insect meal and algal proteins are alternative protein sources. | Single-cell and cultured protein as new sustainable animal feed. |
| Raw material price volatility affects feed prices. | Efficiency maximized and waste reduced with smart feed technologies. |
| Increased sustainability initiatives and less dependence on fishmeal and soy are needed. | Circular feed innovations using food waste and crop by-products. |
| Limited real-time monitoring of starter feed intake. | IoT-enabled smart feeders supply real-time data for auto-feeding. |
| Supply chain interferences affecting feeding supply and pricing. | Blockchain technology integration for better traceability and transparency. |
The industry is highly vulnerable to the supply chain risks arising as it depends on readily available high-quality raw materials such as grains, proteins, and essential nutrients. Cyclical changes in agricultural yields, governmental stances on trade, and logistical problems can lead to the lack of some ingredients in the product. To solve the problem, companies need to have a plan in place primarily by securing strategic sourcing agreements, which will also involve investment in inventory management to guarantee continuous supply.
Demand is influenced by the state of the market and the economy. Increased feed costs, inflation, and consumers' polarity shifts, such as preferring organic rather than GMO animal products, will all affect purchasing behavior. To counteract the risks, companies could, for instance, expand their product range, manufacture budget-friendly products, and provide nutritional solutions tailored to the particular needs of livestock breeders.
The lurking threats of illnesses, including bird flu and African swine, might significantly destabilize the market. To deal with this, firms ought to emphasize traceability, hygiene protocol, and collaboration with veterinary authorities.
Sustainability is another question that needs to be addressed. Deforestation is associated with feed production and the carbon footprint problem. Companies can only comply with environmental regulations and consumers' requirements through responsible sourcing, diversification into other protein sources, and the adaptation of eco-friendly production systems.
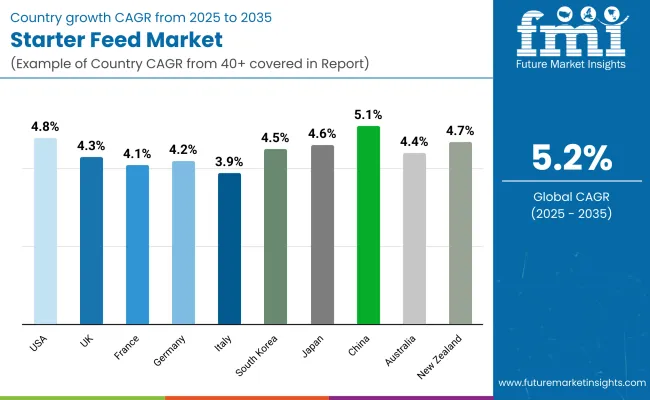
| Countries | CAGR (2025 to 2035) |
|---|---|
| USA | 4.8% |
| UK | 4.3% |
| France | 4.1% |
| Germany | 4.2% |
| Italy | 3.9% |
| South Korea | 4.5% |
| Japan | 4.6% |
| China | 5.1% |
| Australia | 4.4% |
| New Zealand | 4.7% |
The USA will witness a 4.8% CAGR growth from 2025 to 2035, fueled by its sophisticated livestock-rearing practices and need for quality nutrition. The country's highly developed animal feed industry is supported by strong R&D in animal nutrition. Major industry players continue to invest in precision feeding technologies and functional additives to enhance feed efficiency and animal performance.
Growing demand for sustainable livestock production and consumer pressure to deliver antibiotic-free and organic meat fuel the trend. Food safety initiatives and strict food safety regulations also fuel the demand for sustainable, high-performance feed solutions.
The UK is expected to grow at a 4.3% CAGR, thanks to the country's animal welfare policies and quality feed focus. Organic and non-GMO feeds are on the rise and are propelling product innovation within the UK animal feed industry. Increasing traceability and sustainable production of feed are becoming trendy within the livestock industry, and market players are adopting green ingredients.
The country's large poultry and dairy industries are major demand drivers for feed, with a pro-sustainable agriculture policy propelling market growth. The increasing need for superior quality, specialty feeds with improved digestibility is also driving the competitive market.
France will develop at a 4.1% CAGR mainly because of its high focus on livestock genetics and quality feed formulation. The French agricultural industry places high stress on early-stage animal nutrition to improve productivity and growth. Strict dietary rules in the nation lead to the use of high-quality immune systems and gut health-promoting additives in youth stock.
Moreover, increasing demand for organic ingredients and local provenance are influencing purchasing patterns. France's mature cattle and pig farming sectors are some of the fundamental drivers for consistent development.
Germany will show a 4.2% CAGR with growing technology in the production of feed and precision agriculture. The nation's technologically advanced livestock sector is concentrating on sustainable feed choices and precision nutrition. German feed companies are continuously investing in new functional additives, probiotics, and enzyme-fortified products to drive optimal animal growth.
In response to increased demand for antibiotic-free livestock production, firms are creating new nutrition strategies to offer optimal health and performance in animals. Focus on circular economy strategies such as waste minimization and protein alternatives is also driving the industry trend in Germany.
Italy will grow at a 3.9% CAGR due to its highly developed swine and poultry industries. Italy's livestock industry is also witnessing seismic changes with more applications of feed optimization techniques for improved meat quality and higher production efficiency. More emphasis on using Mediterranean feed ingredients based on local grains and natural products is going to be among the top trends in the industry.
Moreover, Italy's robust consumer demand for organic and antibiotic-free meat is leading feed makers to seek alternative protein sources and gut stimulants. Despite modest growth, EU feed safety regulations remain stringent in ruling the forces of the market.
South Korea is expected to grow at a 4.5% CAGR due to growth in livestock and aggressive technology advancement. Sophisticated swine and poultry industries in the country are prime movers of feed consumption, and increasing feed efficiency and animal well-being is imperative.
South Korean players are adopting research-driven feed technologies that include prebiotics, probiotics, and blends of enzymes to optimize digestibility. Government-backed programs for sustainable livestock farming and lower rates of antibiotic use are also driving the market forward. Moreover, the rising penetration of imported high-quality feed products is enhancing consumer options.
Japan is anticipated to grow at a 4.6% CAGR as Japan's advanced animal nutrition technology and highly developed high-tech feed production practices continue to propel it. The domestic animal feed industry places high-performance feed formulas at the top, above everything else, for rapid weight gain and strong immune function in young animals.
The high dependence of Japan on imported feed ingredients is compelling manufacturers to resort to looking for alternative sources of proteins and functional ingredients. Apart from this, the nation's extremely high interest in food safety and traceability is compelling higher investments in precision feeding systems. Japanese premiumization of animal husbandry businesses will drive demand for specialty feed solutions.
China will grow strongly at a 5.1% CAGR as high-density animal farming and increasing demand for high-quality meat products drive growth. Industrialization of Chinese production from small-scale, traditional agriculture is pushing demand for nutritionally sufficient and productive starter feeds. Chinese feed manufacturers are applying newer feed conversion technology to increase animal productivity. Joint ventures between domestic and overseas feed manufacturers are driving product innovation.
Australia will expand at a 4.4% CAGR, driven by Australia's massive beef and dairy industries. Animal production in Australia is more focused on maximizing feed efficiency to achieve the highest level of animal growth on a sustainable basis. The demand for ruminant specialty starter feeds in intensive cattle farming applications is increasing.
Demand for natural and organic supplements and an increased need for non-GMO recipes are changing industry trends. Government initiatives for sustainable agriculture and precision nutrition are also heavily contributing to the industry.
New Zealand will have a 4.7% CAGR due to its strong dairy and sheep-rearing industries. The nation's emphasis on pasture-based animal production is compellingly driving the demand for better starter-feed formulas that favor pasture-based feeding. New Zealand's emphasis on sustainable agriculture and stringent biosecurity arrangements guarantees high-quality feed imports.
The growth in the livestock industry's export orientation is also impacting the demand for high-performance feed technologies. In addition, protein-enriched feed products and natural growth promoters are also increasingly becoming significant differentiators.
| Segment | Value Share (2025) |
|---|---|
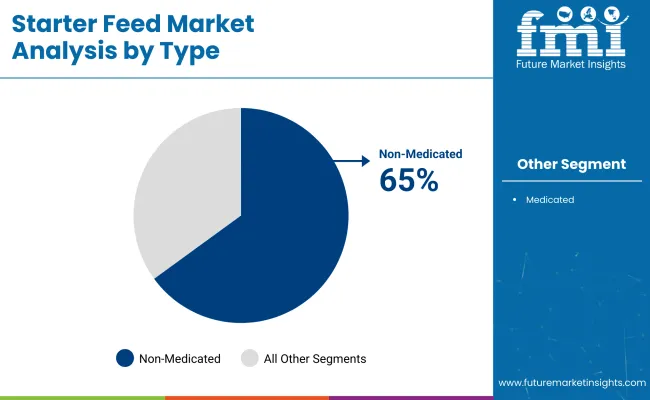
| Non-Medicated (By Type) | 65% |
On the basis of type, starter feed is categorized into non-medicated and medicated; non-medicated starter feed dominates by accounting for 65% of the revenue share in 2025. This segment is witnessing growth on account of the rising preference for antibiotic-free livestock production along with the growing need for organic and natural feed solutions.
Companies such as Cargill, Alltech, and ADM are investing in probiotic- and prebiotic-rich feeds that support gut health and immunity in young livestock without using medications. For example, Purina’s Start & Grow Non-Medicated Chick Feed offers balanced nutrition that includes amino acids for optimal poultry growth and is antibiotic-free.
Conversely, medicated starter feed accounts for 35% of the share, which is targeted at farmers who need disease-preventing solutions at the initial stages of livestock growth. This feed includes ionophores or antibiotics to avoid coccidiosis in chickens and scours in calves.
Medicated feed and controlled dosage tailored by key manufacturers Kent Nutrition Group and Nutreco have proven to improve survival rates and feed efficacy. Kent’s Home Fresh Starter, for instance, contains FDA-approved medications that help support livestock health in those vulnerable early weeks.
In regions where antibiotic usage is heavily regulated (such as Europe and North America), a natural and organic approach to farming is likely to result in increased uptake of non-medicated starter feed. The medicated segment is still critical in high-intensity farming environments where disease outbreaks can curtail productivity, ushering in an era of over-farming.
Because traditional medications do not work in this way, companies are currently looking for alternative health solutions when providing such products, such as essential oils and herbal additives, in order to achieve the same results for growing livestock but without inhibiting maximum livestock development.
| Segment | Value Share (2025) |
|---|---|
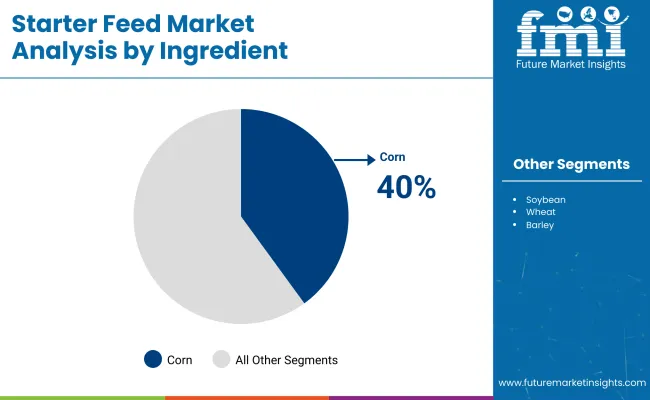
| Corn (By Ingredient) | 40% |
Based on ingredients, corn has been a dominating ingredient and is expected to hold more than 40% of the share in 2025, followed by wheat, rice bran, soybean, and oats. However, corn continues to be the preferred choice among most feed ingredients because of its high energy density, ease of digestion, and worldwide availability, thereby establishing itself as one of the most important feed components in livestock nutrition.
Cargill, Land O’Lakes, and Archer Daniels Midland (ADM) use corn-based formulations to improve growth efficiency in young animals. Purina’s Honor Show Chow Starter Grower for Swine, for example, provides a balanced blend of proteins and carbohydrates to promote optimal development.
However, there is an increasing use of wheat as a feed in many regions, which has contributed to its share of around 20% due to its high protein and fiber content and its suitability for poultry and swine starter feeds. Wheat can be used as a corn alternative since it is more plentiful in Europe.
Nutreco and De Heus are among those that produce wheat-based starter feeds, which are formulated to improve muscle growth, digestion, and growth overall in young livestock. Corn is the main energy source, and wheat is a source of additional protein and fiber in livestock nutrition. Both crops are key to animal growth and efficiency.
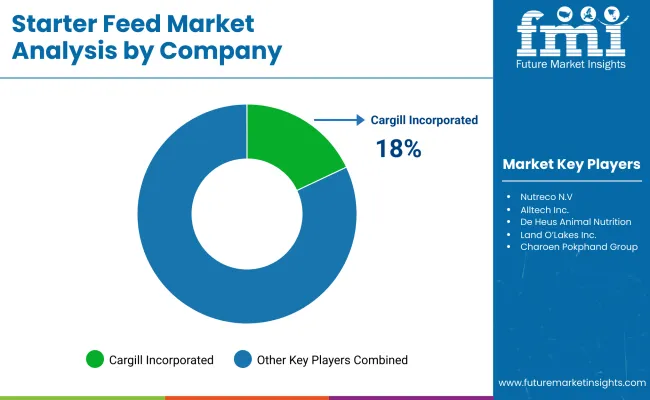
The response of the world starter feed industry is witnessing spectacular growth as there is growing demand for quality livestock feeding and a greater focus on animal health. Companies in this industry are concentrating on innovation, sustainability, and strategic development to stay at the forefront of the competition.
This shift towards natural and antibiotic-free feed has also initiated research and development efforts and, hence, a more evolved starter feed formulation that improves growth, immunity, and overall production of animals. Furthermore, government support for sustainable agriculture is encouraging investments in functional and organic feed additives.
Industry leaders such as Cargill, Archer Daniels Midland (ADM), and Nutreco are investing in emerging feed technologies that optimize nutrient absorption and improve feed conversion rates. These technologies are helping producers save costs while ensuring animal health. Increased adoption of precision feeding techniques and digital cattle management equipment is also reshaping the competitive landscape so that companies can offer species-specific feed solutions according to nutritional requirements.
Strategic partnerships, mergers, and acquisitions have now become core strategies amongst the biggest players to improve industry presence and extend product offerings. Amongst them are a few, such as Nutreco's business within the aquaculture operations and ADM's probiotic-enriched starter feeds, reflecting industry recognition bestowed to cater to emerging industry and consumer needs. The Asia-Pacific and Latin American regional expansions also begin to assume main growth driver roles because more dairy and meat foods are being consumed in these continents.
Sustainability is a broad consumer trend in the marketplace, and leading manufacturers use plant proteins, natural extracts, and essential oils in their products. Consumer demand for animal-derived goods produced ethically, as well as compliance with rigorous environmental regulations, drives the trend.
Market Share Analysis by Company
| Company Name | Estimated Market Share (%) |
|---|---|
| Cargill, Incorporated | 18-22% |
| Archer Daniels Midland (ADM) | 15-19% |
| Nutreco N.V. | 12-16% |
| Alltech, Inc. | 10-14% |
| De Heus Animal Nutrition | 8-12% |
| Other Companies (Combined) | 30-40% |
| Company Name | Key Offerings/Activities |
|---|---|
| Cargill, Incorporated | Introduced essential oil-enriched feed, promoting gut health and antibiotic-free livestock growth. |
| Archer Daniels Midland (ADM) | Developed probiotic-enhanced feed additive to improve digestion and immunity in poultry and swine. |
| Nutreco N.V. | Partnered with aquaculture farms for high-protein, algae-based feed solutions ensuring sustainable nutrition. |
| Alltech, Inc. | Launched enzyme-based feeds aimed at improving nutrient absorption and digestive efficiency. |
| De Heus Animal Nutrition | Expanded precision feeding programs to optimize efficiency and livestock performance. |
Key Company Insights
Cargill, Incorporated (18-22%)
Cargill has focused on antibiotic-free feed solutions by integrating essential oils and natural extracts into its portfolio. This move aligns with industry sustainability trends and increasing regulatory support for alternative growth promoters.
Archer Daniels Midland (ADM) (15-19%)
ADM has expanded its feed additive offerings by developing a probiotic-enhanced feed aimed at improving gut health. The company is leveraging biotechnology advancements to strengthen its presence in the livestock nutrition sector.
Nutreco N.V. (12-16%)
Nutreco has strengthened its position in sustainable feed production by forming partnerships in aquaculture. Its algae-based feed solutions are gaining traction as viable, eco-friendly alternatives to traditional fishmeal-based feeds.
Alltech, Inc. (10-14%)
Alltech is enhancing its industry share through enzyme-based feeds designed to maximize nutrient absorption. These innovations cater to the growing demand for efficient, sustainable, and highly digestible livestock feed.
De Heus Animal Nutrition (8-12%)
De Heus continues to expand its precision nutrition solutions, emphasizing efficiency. The company has developed tailored feeding programs that improve livestock growth rates and farm productivity.
Other Key Players (30-40% Combined)
The segmentation is into medicated and non-medicated starter feeds.
The segmentation is into wheat, corn, soybeans, oats, barley, and other ingredients.
The segmentation is into ruminant, swine, poultry, aquatic, and equine.
The segmentation is into pellets, crumbles, and other forms.
The segmentation is into North America, Latin America, Western Europe, Eastern Europe, South Asia & Pacific, East Asia, Central Asia, Balkan and Baltic Countries, Russia and Belarus, and the Middle East & Africa.
The industry is expected to reach USD 36.9 billion in 2025.
The market is projected to grow to USD 61.2 billion by 2035.
The market is expected to grow at a CAGR of approximately 5.2% from 2025 to 2035.
India is expected to experience the highest growth, with a CAGR of 5.5% during the forecast period.
The Non-Medicated segment is one of the most widely used categories in the market.
Leading companies include Cargill, Incorporated, Archer Daniels Midland (ADM), Nutreco N.V., Alltech, Inc., De Heus Animal Nutrition, Land O’Lakes, Inc., Charoen Pokphand Group, New Hope Group, ForFarmers N.V., and Kent Nutrition Group.


Our Research Products

The "Full Research Suite" delivers actionable market intel, deep dives on markets or technologies, so clients act faster, cut risk, and unlock growth.

The Leaderboard benchmarks and ranks top vendors, classifying them as Established Leaders, Leading Challengers, or Disruptors & Challengers.

Locates where complements amplify value and substitutes erode it, forecasting net impact by horizon

We deliver granular, decision-grade intel: market sizing, 5-year forecasts, pricing, adoption, usage, revenue, and operational KPIs—plus competitor tracking, regulation, and value chains—across 60 countries broadly.

Spot the shifts before they hit your P&L. We track inflection points, adoption curves, pricing moves, and ecosystem plays to show where demand is heading, why it is changing, and what to do next across high-growth markets and disruptive tech

Real-time reads of user behavior. We track shifting priorities, perceptions of today’s and next-gen services, and provider experience, then pace how fast tech moves from trial to adoption, blending buyer, consumer, and channel inputs with social signals (#WhySwitch, #UX).

Partner with our analyst team to build a custom report designed around your business priorities. From analysing market trends to assessing competitors or crafting bespoke datasets, we tailor insights to your needs.
Supplier Intelligence
Discovery & Profiling
Capacity & Footprint
Performance & Risk
Compliance & Governance
Commercial Readiness
Who Supplies Whom
Scorecards & Shortlists
Playbooks & Docs
Category Intelligence
Definition & Scope
Demand & Use Cases
Cost Drivers
Market Structure
Supply Chain Map
Trade & Policy
Operating Norms
Deliverables
Buyer Intelligence
Account Basics
Spend & Scope
Procurement Model
Vendor Requirements
Terms & Policies
Entry Strategy
Pain Points & Triggers
Outputs
Pricing Analysis
Benchmarks
Trends
Should-Cost
Indexation
Landed Cost
Commercial Terms
Deliverables
Brand Analysis
Positioning & Value Prop
Share & Presence
Customer Evidence
Go-to-Market
Digital & Reputation
Compliance & Trust
KPIs & Gaps
Outputs
Full Research Suite comprises of:
Market outlook & trends analysis
Interviews & case studies
Strategic recommendations
Vendor profiles & capabilities analysis
5-year forecasts
8 regions and 60+ country-level data splits
Market segment data splits
12 months of continuous data updates
DELIVERED AS:
PDF EXCEL ONLINE
Organic Starter-Grower Chicken Feed Market
Feed Mixer for Livestock Market Size and Share Forecast Outlook 2025 to 2035
Feed Preparation Machine Market Size and Share Forecast Outlook 2025 to 2035
Feed Additive Nosiheptide Premix Market Size and Share Forecast Outlook 2025 to 2035
Feeder Container Market Size and Share Forecast Outlook 2025 to 2035
Feed Machine Market Forecast Outlook 2025 to 2035
Feed Pigment Market Forecast and Outlook 2025 to 2035
Feed Mixer Market Forecast and Outlook 2025 to 2035
Feed Grade Spray-dried Animal Plasma (SDAP) Market Size and Share Forecast Outlook 2025 to 2035
Feed Electrolytes Market Size and Share Forecast Outlook 2025 to 2035
Starter Fertilizers Market Size and Share Forecast Outlook 2025 to 2035
Feed Micronutrients Market Size and Share Forecast Outlook 2025 to 2035
Feed Acidifier Market Analysis Size Share and Forecast Outlook 2025 to 2035
Feed Flavors Market Size and Share Forecast Outlook 2025 to 2035
Feed Enzymes Market Analysis - Size, Share, and Forecast Outlook 2025 to 2035
Feed Mycotoxin Binders Market Size and Share Forecast Outlook 2025 to 2035
Feed Phytogenics Market Size and Share Forecast Outlook 2025 to 2035
Feed Carbohydrase Market Size and Share Forecast Outlook 2025 to 2035
Feed Grade Oils Market Analysis - Size, Share, and Forecast Outlook 2025 to 2035
Feed Packaging Market Size, Share & Forecast 2025 to 2035

Thank you!
You will receive an email from our Business Development Manager. Please be sure to check your SPAM/JUNK folder too.
Chat With
MaRIA