Spray Dried Food Market Size and Share Forecast Outlook 2025 to 2035

The global spray dried food market is valued at USD 67.6 billion in 2025 and is projected to reach USD 142 billion by 2035, registering a CAGR of 7.7%.
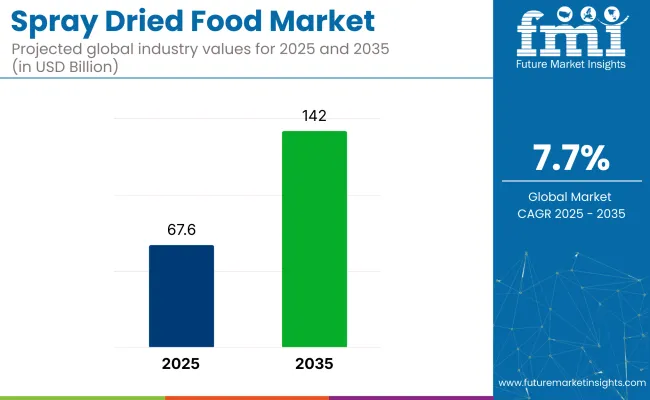
Quick Stats for Spray Dried Food Market

  • Market Value (2025): USD 67.6 billion
  • Forecast Value (2035): USD 142 billion
  • Forecast CAGR: 7.7%
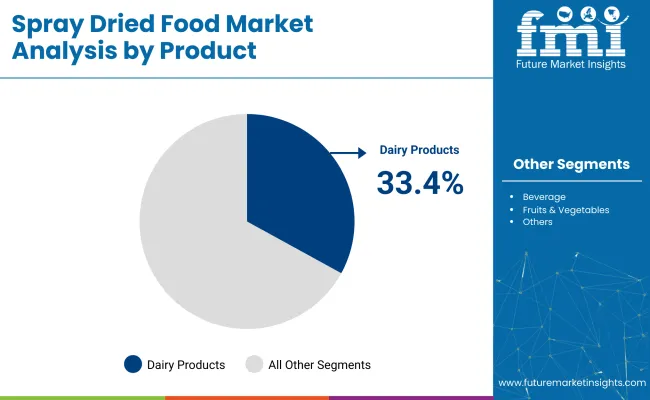
  • Leading Product in 2025: Dairy Products (33.4% Market Share)
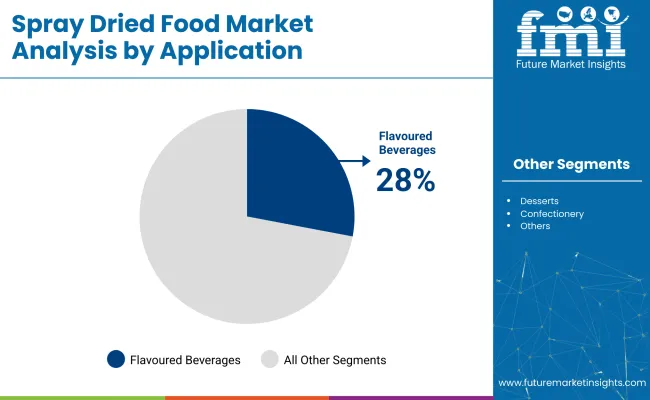
  • Top Application Segment: Flavoured Beverages (28% Market Share)
  • Key Growth Region: North America (USA is the fastest-growing market with a 5.7% CAGR)

Spray Dried Food Market

Metric Value
Estimated Size (2025) USD 67.6 billion
Projected Value (2035) USD 142 billion
CAGR (2025 to 2035) 7.7%

Market expansion is driven by increasing demand for convenient, long-shelf-life, and nutrient-preserving food ingredients in various sectors such as the food and beverage industry, nutraceuticals, and pharmaceuticals. The growth is further supported by advancements in spray drying technologies, which preserve flavors, aroma, and nutritional value of food products while extending their shelf life.

The market holds 5%-8% of the food and beverage industry, where spray-dried ingredients play a key role in convenience foods, beverages, and dairy products. It contributes around 6%-10% of the food processing market, supported by the widespread use of spray drying for preservation and quality enhancement.

Within the nutraceuticals segment, it holds roughly 4%-6%, while in the convenience foods market, it captures a larger share of about 10%-15%, driven by the growing demand for ready-to-eat and shelf-stable products.

Government regulations for the spray-dried food market focus on food safety, labeling, and processing standards to ensure product quality and consumer health. Regulatory bodies such as the FDA (USA), EFSA (EU), and FSSAI (India) mandate compliance with hygiene practices, permissible additive usage, and residual solvent limits in spray drying processes.

These regulations also cover Good Manufacturing Practices (GMP), Hazard Analysis and Critical Control Points (HACCP), and proper declaration of nutritional content. Additionally, export-focused manufacturers must meet international food safety certifications such as ISO 22000 or BRC to access global markets, ensuring transparency and safety across the supply chain.

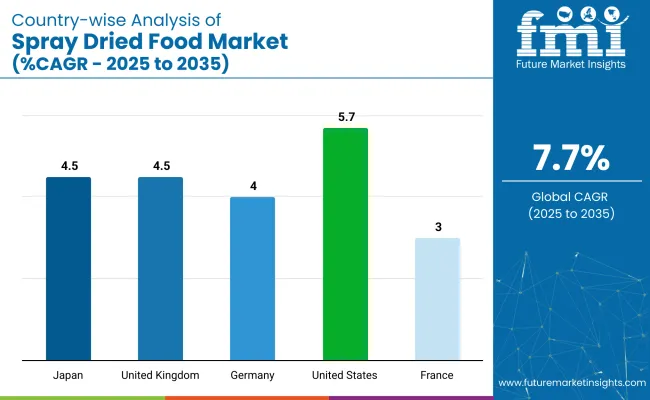
The USA is projected to be the fastest-growing market, expanding at a CAGR of 5.7%. The dairy industry will lead the product type segment, with nearly 33.4% of the market share. Meanwhile, flavoured beverages will be the largest application segment, accounting for 28% of the market share. The UK and Japan closely follow this growth with CAGRs of 4.5%.

Spray Dried Food Market Analysis by Top Investment Segments

The global spray dried food market is segmented into various product types, distribution channels, applications, and regions. By product type,the market includes fruits and vegetables, beverages, dairy products, fish, and others (including nuts, spices, and herbs).

Based on distribution channel, the market is segmented into B2B, food service, and B2C. By application,the market is categorized intodesserts, confectionary, baked goods, flavoured beverages, and baby food. Regionally, the market is classified into North America, Latin America, Europe, East Asia, South Asia, Oceania, and the Middle East and Africa.

Dairy Products to Lead the Product Type Segment with 33.4% Market Share

Dairy products are projected to lead the product segment, accounting for 33.4% of the global market share by 2025. Dairy-based powders are widely used due to their long shelf life, convenience, and nutritional value.
  • Dairy powders are used in convenience foods and beverages.
  • Increasing demand for healthy dairy options is fueling growth.

Spray Dried Food Market By Product

B2C to Dominate the Distribution Channel Segment with 45% Market Share

B2C is expected to lead the distribution channel segment, accounting for 45% share in 2025, driven by the increasing popularity of online retail and direct-to-consumer sales.

  • B2C benefits from the rise in online shopping and home deliveries.
  • Health-conscious consumers are driving direct-to-consumer sales.

Flavoured Beverages will Lead Application Segment with 28% Market Share

Flavored beverages are projected to lead the application segment, accounting for 28% of the global market share in 2025 due to the growing demand for instant beverages, functional drinks, and powdered nutritional beverages.
  • Instant drink powders are highly popular in both ready-to-drink and dietary products.
  • Demand for healthy and fortified beverages is on the rise.

Spray Dried Food Market By Application

Top Spray Dried Food Market Dynamics

Recent Trends in the Spray Dried Food Market

  • Increasing demand for health-conscious, functional, and fortified food products.
  • Growing adoption of eco-friendly and sustainable packaging materials.
  • Rising popularity of e-commerce platforms is driving B2C sales.

Challenges in the Spray Dried Food Market
  • Volatile raw material prices, affecting production costs.
  • Strict government regulations regarding food safety and environmental concerns.
  • Limited awareness and adoption of advanced spray drying technologies in emerging markets.

Top Countries Producingand Supplying Spray Dried Food

Country Wise Analysis Of Spray Dried Food Market

The market is experiencing diverse growth rates across key countries. The United States leads with a CAGR of 5.7%, driven by strong dairy consumption and an increasing focus on nutraceuticals and ready-to-eat products. The United Kingdom follows with a CAGR of 4.5%, fueled by demand for convenience foods and plant-based ingredients.

Germany has a slightly lower CAGR of 4.0%, with growth driven by the demand for organic and sustainable food options. France is growing at a slower CAGR of 3.0%, mainly influenced by dairy and confectionery demand. Japan also has a CAGR of 4.5%, driven by high consumption of dairy powders and functional foods.

The report covers an in-depth analysis of 40+ countries; five top-performing OECD countries are highlighted below.

United States Spray Dried Food Market Analysis

The USA is projected to remain the largest market for spray-dried food products, with the dairy sector, particularly milk powders, driving demand. The spray dried food revenuein the USA is projected to grow at a CAGR of 5.7%, primarily fueled by rising consumer awareness regarding the nutritional value of powdered products and an increasing preference for convenient, ready-to-eat foods. The USA market will continue to thrive, bolstered by a strong food manufacturing base and the adoption of advanced spray-drying technologies.

  • Increasing focus on health-conscious food products and beverages.
  • Strong growth in the demand for nutraceuticals and dietary supplements.
  • High consumption of dairy-based products, including milk powders.

Spray Dried Food Demand Analysis in the United Kingdom

The sales of spray-dried food in the UK are expanding at a CAGR of 4.5%, supported by a shift toward healthier eating habits and increasing demand for functional foods. Government support for sustainability initiatives and reduced food waste is further promoting the adoption of spray-dried food products in both domestic and international markets.

  • Rising demand for dairy-free and plant-based spray-dried products.
  • Increased interest in clean-label and natural food ingredients.
  • Strong demand for instant beverages and functional powders.

Germany Spray Dried Food Sales Analysis

The spray dried food marketinGermany holds a prominent position in the European spray-dried food market, with significant exports of dairy and fruit powders. The salesof spray dried food in Germany are growing at a CAGR of 4.0%, driven by the country’s strong engineering and food processing industries. Consumers' growing preference for nutritious and natural food options is further fueling the demand for spray-dried ingredients across the food, beverage, and nutraceutical industries.

  • High demand for organic and natural spray-dried food products.
  • Expansion of the plant-based food trend in Europe.
  • Strong focus on sustainable manufacturing and packaging.

Spray Dried Food Industry Analysis in France

In France, the spray dried food market is growing at a CAGR of 3.0%, with steady growth in the demand for functional and fortified foods. French manufacturers are focusing on enhancing product offerings with high-quality, functional ingredients, such as fortified powders and dairy alternatives, in response to increased consumer interest in health and wellness.

  • Demand for high-quality dairy-based spray-dried powders.
  • Growth in the demand for fortified and functional foods.
  • Increased consumer preference for clean-label, natural ingredients.

Japan Spray Dried Food Market Analysis

The spray dried food revenue in Japan is growing at a CAGR of 4.5%, supported by strong consumer demand for instant and ready-to-eat foods. With a well-developed food processing industry and high per capita consumption of dairy and beverage powders, Japan stands as a key market in Asia. Innovation in food packaging and nutritional product development is driving new opportunities, especially in the nutraceuticals and dietary supplements sectors.

  • Increasing demand for ready-to-consume beverages and nutritional powders.
  • Strong growth in the functional food sector, including fortified powders.
  • Adoption of sustainable packaging and eco-friendly food manufacturing solutions.

Leading Spray Dried Food Suppliers

The market is moderately consolidated, with several global leaders accounting for a significant share of revenues. Tier-one companies like Nestlé, Unilever, Döhler GmbH, Kerry Group, and Ajinomoto are competing based on product innovation, sustainability initiatives, and strategic partnerships. These companies focus on enhancing product quality, expanding their product portfolios, and improving supply chain efficiencies to maintain a competitive edge.

Top companies in the spray dried food market are competing through a combination of pricing strategies, product innovation, and strategic partnerships. They are investing in research and development to create new products that meet changing consumer preferences, such as plant-based and functional foods.

Additionally, these companies are forming partnerships with local suppliers and distributors to expand their market reach and improve supply chain resilience. Sustainability is also a key focus, with many companies implementing initiatives to reduce their environmental impact and meet consumer demand for eco-friendly products.

Recent Spray Dried Food Industry News

In September 2024, Ajinomoto and Danone inked a deal to decrease greenhouse gas emissions from the dairy sector.

Spray Dried Food Market Report Scope

Report Attributes Details
Current Total Market Size (2025) USD 67.6 billion
Projected Market Size (2035) USD 142 billion
CAGR (2025 to 2035) 7.7%
Base Year for Estimation 2024
Historical Period 2020 to 2024
Projections Period 2025 to 2035
Market Analysis Parameters Revenue in USD billions/Volume in Kilotons
By Product Type Fruits & Vegetables, Dairy Products, Beverage, Fish, and Others (including nuts, spices, and herbs)
By Distribution Channel B2B, B2C, and Food Service
By Application Desserts, Confectionery, Baked Goods, Flavo u red Beverages, Baby Food
Regions Covered North America, Latin America, Europe, East Asia, South Asia, Oceania, the Middle East and Africa
Countries Covered United States, Canada, United Kingdom, Germany, France, China, Japan, South Korea, Brazil, Australia
Key Players Nestlé, Döhler GmbH, Unilever, Kerry Group, Ajinomoto, AZO GmbH & Co. KG, Delecto Foods, Mercer Foods, Foods & Inns, Givaudan SA
Additional Attributes Dollar sales by value, market share analysis by region, country-wise analysis

Key Segments

By Product Type:

As per product type industry has been categorized into Fruits and Vegetables, Beverages, Dairy Products, Fish, and others

By Application:

This segment is further categorized into Desserts, Confectionary, Baked Goods, Flavoured Beverages, Baby food, and others.

By Distribution Channel:

Different distribution channels include B2B, Food Service, B2C(Supermarkets and Hypermarkets, Independent Retailers, Specialist Retailers, Online Stores)

By Region:

Industry analysis has been carried out in key countries of North America, Latin America, Europe, East Asia, South Asia, Oceania, and the Middle East & Africa.

Table of Content

  1. Executive Summary
    • Global Market Outlook
    • Demand-side Trends
    • Supply-side Trends
    • Technology Roadmap Analysis
    • Analysis and Recommendations
  2. Market Overview
    • Market Coverage / Taxonomy
    • Market Definition / Scope / Limitations
  3. Market Background
    • Market Dynamics
      • Drivers
      • Restraints
      • Opportunity
      • Trends
    • Scenario Forecast
      • Demand in Optimistic Scenario
      • Demand in Likely Scenario
      • Demand in Conservative Scenario
    • Opportunity Map Analysis
    • Product Life Cycle Analysis
    • Supply Chain Analysis
      • Supply Side Participants and their Roles
        • Producers
        • Mid-Level Participants (Traders/ Agents/ Brokers)
        • Wholesalers and Distributors
      • Value Added and Value Created at Node in the Supply Chain
      • List of Raw Material Suppliers
      • List of Existing and Potential Buyer’s
    • Investment Feasibility Matrix
    • Value Chain Analysis
      • Profit Margin Analysis
      • Wholesalers and Distributors
      • Retailers
    • PESTLE and Porter’s Analysis
    • Regulatory Landscape
      • By Key Regions
      • By Key Countries
    • Regional Parent Market Outlook
    • Production and Consumption Statistics
    • Import and Export Statistics
  4. Global Market Analysis 2020 to 2024 and Forecast, 2025 to 2035
    • Historical Market Size Value (USD Billion) & Volume (Kilotons) Analysis, 2020 to 2024
    • Current and Future Market Size Value (USD Billion) & Volume (Kilotons) Projections, 2025 to 2035
      • Y-o-Y Growth Trend Analysis
      • Absolute $ Opportunity Analysis
  5. Global Market Pricing Analysis 2020 to 2024 and Forecast 2025 to 2035
  6. Global Market Analysis 2020 to 2024 and Forecast 2025 to 2035, By Product Type
    • Introduction / Key Findings
    • Historical Market Size Value (USD Billion) & Volume (Kilotons) Analysis By Product Type, 2020 to 2024
    • Current and Future Market Size Value (USD Billion) & Volume (Kilotons) Analysis and Forecast By Product Type, 2025 to 2035
      • Fruits and Vegetables
      • Beverage
      • Dairy Products
      • Fish
      • Others
    • Y-o-Y Growth Trend Analysis By Product Type, 2020 to 2024
    • Absolute $ Opportunity Analysis By Product Type, 2025 to 2035
  7. Global Market Analysis 2020 to 2024 and Forecast 2025 to 2035, By Distribution Channel
    • Introduction / Key Findings
    • Historical Market Size Value (USD Billion) & Volume (Kilotons) Analysis By Distribution Channel, 2020 to 2024
    • Current and Future Market Size Value (USD Billion) & Volume (Kilotons) Analysis and Forecast By Distribution Channel, 2025 to 2035
      • B2B
      • Food Service
      • B2C
    • Y-o-Y Growth Trend Analysis By Distribution Channel, 2020 to 2024
    • Absolute $ Opportunity Analysis By Distribution Channel, 2025 to 2035
  8. Global Market Analysis 2020 to 2024 and Forecast 2025 to 2035, By Application
    • Introduction / Key Findings
    • Historical Market Size Value (USD Billion) & Volume (Kilotons) Analysis By Application, 2020 to 2024
    • Current and Future Market Size Value (USD Billion) & Volume (Kilotons) Analysis and Forecast By Application, 2025 to 2035
      • Desserts
      • Confectionary
      • Baked Goods
      • Flavoured Beverages
      • Baby food
    • Y-o-Y Growth Trend Analysis By Application, 2020 to 2024
    • Absolute $ Opportunity Analysis By Application, 2025 to 2035
  9. Global Market Analysis 2020 to 2024 and Forecast 2025 to 2035, By Region
    • Introduction
    • Historical Market Size Value (USD Billion) & Volume (Kilotons) Analysis By Region, 2020 to 2024
    • Current Market Size Value (USD Billion) & Volume (Kilotons) Analysis and Forecast By Region, 2025 to 2035
      • North America
      • Latin America
      • Western Europe
      • Eastern Europe
      • East Asia
      • South Asia & Pacific
      • Middle East and Africa
    • Market Attractiveness Analysis By Region
  10. North America Market Analysis 2020 to 2024 and Forecast 2025 to 2035, By Country
    • Historical Market Size Value (USD Billion) & Volume (Kilotons) Trend Analysis By Market Taxonomy, 2020 to 2024
    • Market Size Value (USD Billion) & Volume (Kilotons) Forecast By Market Taxonomy, 2025 to 2035
      • By Country
        • USA
        • Canada
        • Mexico
      • By Product Type
      • By Distribution Channel
      • By Application
    • Market Attractiveness Analysis
      • By Country
      • By Product Type
      • By Distribution Channel
      • By Application
    • Key Takeaways
  11. Latin America Market Analysis 2020 to 2024 and Forecast 2025 to 2035, By Country
    • Historical Market Size Value (USD Billion) & Volume (Kilotons) Trend Analysis By Market Taxonomy, 2020 to 2024
    • Market Size Value (USD Billion) & Volume (Kilotons) Forecast By Market Taxonomy, 2025 to 2035
      • By Country
        • Brazil
        • Argentina
        • Rest of LATAM
      • By Product Type
      • By Distribution Channel
      • By Application
    • Market Attractiveness Analysis
      • By Country
      • By Product Type
      • By Distribution Channel
      • By Application
    • Key Takeaways
  12. Western Europe Market Analysis 2020 to 2024 and Forecast 2025 to 2035, By Country
    • Historical Market Size Value (USD Billion) & Volume (Kilotons) Trend Analysis By Market Taxonomy, 2020 to 2024
    • Market Size Value (USD Billion) & Volume (Kilotons) Forecast By Market Taxonomy, 2025 to 2035
      • By Country
        • Germany
        • Italy
        • France
        • UK
        • Spain
        • BENELUX
        • Nordic
        • Rest of W.Europe
      • By Product Type
      • By Distribution Channel
      • By Application
    • Market Attractiveness Analysis
      • By Country
      • By Product Type
      • By Distribution Channel
      • By Application
    • Key Takeaways
  13. Eastern Europe Market Analysis 2020 to 2024 and Forecast 2025 to 2035, By Country
    • Historical Market Size Value (USD Billion) & Volume (Kilotons) Trend Analysis By Market Taxonomy, 2020 to 2024
    • Market Size Value (USD Billion) & Volume (Kilotons) Forecast By Market Taxonomy, 2025 to 2035
      • By Country
        • Russia
        • Hungary
        • Poland
        • Balkan & Baltics
        • Rest of E. Europe
      • By Product Type
      • By Distribution Channel
      • By Application
    • Market Attractiveness Analysis
      • By Country
      • By Product Type
      • By Distribution Channel
      • By Application
    • Key Takeaways
  14. East Asia Market Analysis 2020 to 2024 and Forecast 2025 to 2035, By Country
    • Historical Market Size Value (USD Billion) & Volume (Kilotons) Trend Analysis By Market Taxonomy, 2020 to 2024
    • Market Size Value (USD Billion) & Volume (Kilotons) Forecast By Market Taxonomy, 2025 to 2035
      • By Country
        • China
        • Japan
        • South Korea
      • By Product Type
      • By Distribution Channel
      • By Application
    • Market Attractiveness Analysis
      • By Country
      • By Product Type
      • By Distribution Channel
      • By Application
    • Key Takeaways
  15. South Asia & Pacific Market Analysis 2020 to 2024 and Forecast 2025 to 2035, By Country
    • Historical Market Size Value (USD Billion) & Volume (Kilotons) Trend Analysis By Market Taxonomy, 2020 to 2024
    • Market Size Value (USD Billion) & Volume (Kilotons) Forecast By Market Taxonomy, 2025 to 2035
      • By Country
        • India
        • Australia & New Zealand
        • ASEAN
        • Rest of SAP
      • By Product Type
      • By Distribution Channel
      • By Application
    • Market Attractiveness Analysis
      • By Country
      • By Product Type
      • By Distribution Channel
      • By Application
    • Key Takeaways
  16. Middle East and Africa Market Analysis 2020 to 2024 and Forecast 2025 to 2035, By Country
    • Historical Market Size Value (USD Billion) & Volume (Kilotons) Trend Analysis By Market Taxonomy, 2020 to 2024
    • Market Size Value (USD Billion) & Volume (Kilotons) Forecast By Market Taxonomy, 2025 to 2035
      • By Country
        • GCC Countries
        • Northern Africa
        • South Africa
        • Turkiye
        • Rest of MEA
      • By Product Type
      • By Distribution Channel
      • By Application
    • Market Attractiveness Analysis
      • By Country
      • By Product Type
      • By Distribution Channel
      • By Application
    • Key Takeaways
  17. Key Countries Market Analysis
    • USA
      • Pricing Analysis
      • Market Share Analysis, 2024
        • By Product Type
        • By Distribution Channel
        • By Application
    • Canada
      • Pricing Analysis
      • Market Share Analysis, 2024
        • By Product Type
        • By Distribution Channel
        • By Application
    • Brazil
      • Pricing Analysis
      • Market Share Analysis, 2024
        • By Product Type
        • By Distribution Channel
        • By Application
    • Mexico
      • Pricing Analysis
      • Market Share Analysis, 2024
        • By Product Type
        • By Distribution Channel
        • By Application
    • Argentina
      • Pricing Analysis
      • Market Share Analysis, 2024
        • By Product Type
        • By Distribution Channel
        • By Application
  18. Market Structure Analysis
    • Competition Dashboard
    • Competition Benchmarking
    • Market Share Analysis of Top Players
      • By Regional
      • By Product Type
      • By Distribution Channel
      • By Application
  19. Competition Analysis
    • Competition Deep Dive
      • Nestle
        • Overview
        • Product Portfolio
        • Profitability by Market Segments (Product/Age /Sales Channel/Region)
        • Sales Footprint
        • Strategy Overview
          • Marketing Strategy
          • Product Strategy
          • Channel Strategy
      • Döhler GmbH
        • Overview
        • Product Portfolio
        • Profitability by Market Segments (Product/Age /Sales Channel/Region)
        • Sales Footprint
        • Strategy Overview
          • Marketing Strategy
          • Product Strategy
          • Channel Strategy
      • Unilever
        • Overview
        • Product Portfolio
        • Profitability by Market Segments (Product/Age /Sales Channel/Region)
        • Sales Footprint
        • Strategy Overview
          • Marketing Strategy
          • Product Strategy
          • Channel Strategy
      • Kerry Group
        • Overview
        • Product Portfolio
        • Profitability by Market Segments (Product/Age /Sales Channel/Region)
        • Sales Footprint
        • Strategy Overview
          • Marketing Strategy
          • Product Strategy
          • Channel Strategy
      • Ajinomoto
        • Overview
        • Product Portfolio
        • Profitability by Market Segments (Product/Age /Sales Channel/Region)
        • Sales Footprint
        • Strategy Overview
          • Marketing Strategy
          • Product Strategy
          • Channel Strategy
      • AZO GmbH & Co. KG
        • Overview
        • Product Portfolio
        • Profitability by Market Segments (Product/Age /Sales Channel/Region)
        • Sales Footprint
        • Strategy Overview
          • Marketing Strategy
          • Product Strategy
          • Channel Strategy
      • Delecto Foods
        • Overview
        • Product Portfolio
        • Profitability by Market Segments (Product/Age /Sales Channel/Region)
        • Sales Footprint
        • Strategy Overview
          • Marketing Strategy
          • Product Strategy
          • Channel Strategy
      • Mercer Foods
        • Overview
        • Product Portfolio
        • Profitability by Market Segments (Product/Age /Sales Channel/Region)
        • Sales Footprint
        • Strategy Overview
          • Marketing Strategy
          • Product Strategy
          • Channel Strategy
      • Foods & Inns
        • Overview
        • Product Portfolio
        • Profitability by Market Segments (Product/Age /Sales Channel/Region)
        • Sales Footprint
        • Strategy Overview
          • Marketing Strategy
          • Product Strategy
          • Channel Strategy
      • Givaudan SA
        • Overview
        • Product Portfolio
        • Profitability by Market Segments (Product/Age /Sales Channel/Region)
        • Sales Footprint
        • Strategy Overview
          • Marketing Strategy
          • Product Strategy
          • Channel Strategy
  20. Assumptions & Acronyms Used
  21. Research Methodology

List of Tables

  • Table 1: Global Market Value (USD Billion) Forecast by Region, 2020-2035
  • Table 2: Global Market Volume (Kilotons) Forecast by Region, 2020-2035
  • Table 3: Global Market Value (USD Billion) Forecast by Product Type, 2020-2035
  • Table 4: Global Market Volume (Kilotons) Forecast by Product Type, 2020-2035
  • Table 5: Global Market Value (USD Billion) Forecast by Distribution Channel, 2020-2035
  • Table 6: Global Market Volume (Kilotons) Forecast by Distribution Channel, 2020-2035
  • Table 7: Global Market Value (USD Billion) Forecast by Application, 2020-2035
  • Table 8: Global Market Volume (Kilotons) Forecast by Application, 2020-2035
  • Table 9: North America Market Value (USD Billion) Forecast by Country, 2020-2035
  • Table 10: North America Market Volume (Kilotons) Forecast by Country, 2020-2035
  • Table 11: North America Market Value (USD Billion) Forecast by Product Type, 2020-2035
  • Table 12: North America Market Volume (Kilotons) Forecast by Product Type, 2020-2035
  • Table 13: North America Market Value (USD Billion) Forecast by Distribution Channel, 2020-2035
  • Table 14: North America Market Volume (Kilotons) Forecast by Distribution Channel, 2020-2035
  • Table 15: North America Market Value (USD Billion) Forecast by Application, 2020-2035
  • Table 16: North America Market Volume (Kilotons) Forecast by Application, 2020-2035
  • Table 17: Latin America Market Value (USD Billion) Forecast by Country, 2020-2035
  • Table 18: Latin America Market Volume (Kilotons) Forecast by Country, 2020-2035
  • Table 19: Latin America Market Value (USD Billion) Forecast by Product Type, 2020-2035
  • Table 20: Latin America Market Volume (Kilotons) Forecast by Product Type, 2020-2035
  • Table 21: Latin America Market Value (USD Billion) Forecast by Distribution Channel, 2020-2035
  • Table 22: Latin America Market Volume (Kilotons) Forecast by Distribution Channel, 2020-2035
  • Table 23: Latin America Market Value (USD Billion) Forecast by Application, 2020-2035
  • Table 24: Latin America Market Volume (Kilotons) Forecast by Application, 2020-2035
  • Table 25: Western Europe Market Value (USD Billion) Forecast by Country, 2020-2035
  • Table 26: Western Europe Market Volume (Kilotons) Forecast by Country, 2020-2035
  • Table 27: Western Europe Market Value (USD Billion) Forecast by Product Type, 2020-2035
  • Table 28: Western Europe Market Volume (Kilotons) Forecast by Product Type, 2020-2035
  • Table 29: Western Europe Market Value (USD Billion) Forecast by Distribution Channel, 2020-2035
  • Table 30: Western Europe Market Volume (Kilotons) Forecast by Distribution Channel, 2020-2035
  • Table 31: Western Europe Market Value (USD Billion) Forecast by Application, 2020-2035
  • Table 32: Western Europe Market Volume (Kilotons) Forecast by Application, 2020-2035
  • Table 33: Eastern Europe Market Value (USD Billion) Forecast by Country, 2020-2035
  • Table 34: Eastern Europe Market Volume (Kilotons) Forecast by Country, 2020-2035
  • Table 35: Eastern Europe Market Value (USD Billion) Forecast by Product Type, 2020-2035
  • Table 36: Eastern Europe Market Volume (Kilotons) Forecast by Product Type, 2020-2035
  • Table 37: Eastern Europe Market Value (USD Billion) Forecast by Distribution Channel, 2020-2035
  • Table 38: Eastern Europe Market Volume (Kilotons) Forecast by Distribution Channel, 2020-2035
  • Table 39: Eastern Europe Market Value (USD Billion) Forecast by Application, 2020-2035
  • Table 40: Eastern Europe Market Volume (Kilotons) Forecast by Application, 2020-2035
  • Table 41: East Asia Market Value (USD Billion) Forecast by Country, 2020-2035
  • Table 42: East Asia Market Volume (Kilotons) Forecast by Country, 2020-2035
  • Table 43: East Asia Market Value (USD Billion) Forecast by Product Type, 2020-2035
  • Table 44: East Asia Market Volume (Kilotons) Forecast by Product Type, 2020-2035
  • Table 45: East Asia Market Value (USD Billion) Forecast by Distribution Channel, 2020-2035
  • Table 46: East Asia Market Volume (Kilotons) Forecast by Distribution Channel, 2020-2035
  • Table 47: East Asia Market Value (USD Billion) Forecast by Application, 2020-2035
  • Table 48: East Asia Market Volume (Kilotons) Forecast by Application, 2020-2035
  • Table 49: South Asia & Pacific Market Value (USD Billion) Forecast by Country, 2020-2035
  • Table 50: South Asia & Pacific Market Volume (Kilotons) Forecast by Country, 2020-2035
  • Table 51: South Asia & Pacific Market Value (USD Billion) Forecast by Product Type, 2020-2035
  • Table 52: South Asia & Pacific Market Volume (Kilotons) Forecast by Product Type, 2020-2035
  • Table 53: South Asia & Pacific Market Value (USD Billion) Forecast by Distribution Channel, 2020-2035
  • Table 54: South Asia & Pacific Market Volume (Kilotons) Forecast by Distribution Channel, 2020-2035
  • Table 55: South Asia & Pacific Market Value (USD Billion) Forecast by Application, 2020-2035
  • Table 56: South Asia & Pacific Market Volume (Kilotons) Forecast by Application, 2020-2035
  • Table 57: Middle East and Africa Market Value (USD Billion) Forecast by Country, 2020-2035
  • Table 58: Middle East and Africa Market Volume (Kilotons) Forecast by Country, 2020-2035
  • Table 59: Middle East and Africa Market Value (USD Billion) Forecast by Product Type, 2020-2035
  • Table 60: Middle East and Africa Market Volume (Kilotons) Forecast by Product Type, 2020-2035
  • Table 61: Middle East and Africa Market Value (USD Billion) Forecast by Distribution Channel, 2020-2035
  • Table 62: Middle East and Africa Market Volume (Kilotons) Forecast by Distribution Channel, 2020-2035
  • Table 63: Middle East and Africa Market Value (USD Billion) Forecast by Application, 2020-2035
  • Table 64: Middle East and Africa Market Volume (Kilotons) Forecast by Application, 2020-2035

List of Figures

  • Figure 1: Global Market Volume (Kilotons) Forecast 2020-2035
  • Figure 2: Global Market Pricing Analysis
  • Figure 3: Global Market Value (USD Billion) Forecast 2020-2035
  • Figure 4: Global Market Value Share and BPS Analysis by Product Type, 2025 and 2035
  • Figure 5: Global Market Y-o-Y Growth Comparison by Product Type, 2025-2035
  • Figure 6: Global Market Attractiveness Analysis by Product Type
  • Figure 7: Global Market Value Share and BPS Analysis by Distribution Channel, 2025 and 2035
  • Figure 8: Global Market Y-o-Y Growth Comparison by Distribution Channel, 2025-2035
  • Figure 9: Global Market Attractiveness Analysis by Distribution Channel
  • Figure 10: Global Market Value Share and BPS Analysis by Application, 2025 and 2035
  • Figure 11: Global Market Y-o-Y Growth Comparison by Application, 2025-2035
  • Figure 12: Global Market Attractiveness Analysis by Application
  • Figure 13: Global Market Value (USD Billion) Share and BPS Analysis by Region, 2025 and 2035
  • Figure 14: Global Market Y-o-Y Growth Comparison by Region, 2025-2035
  • Figure 15: Global Market Attractiveness Analysis by Region
  • Figure 16: North America Market Incremental $ Opportunity, 2025-2035
  • Figure 17: Latin America Market Incremental $ Opportunity, 2025-2035
  • Figure 18: Western Europe Market Incremental $ Opportunity, 2025-2035
  • Figure 19: Eastern Europe Market Incremental $ Opportunity, 2025-2035
  • Figure 20: East Asia Market Incremental $ Opportunity, 2025-2035
  • Figure 21: South Asia & Pacific Market Incremental $ Opportunity, 2025-2035
  • Figure 22: Middle East and Africa Market Incremental $ Opportunity, 2025-2035
  • Figure 23: North America Market Value Share and BPS Analysis by Country, 2025 and 2035
  • Figure 24: North America Market Value Share and BPS Analysis by Product Type, 2025 and 2035
  • Figure 25: North America Market Y-o-Y Growth Comparison by Product Type, 2025-2035
  • Figure 26: North America Market Attractiveness Analysis by Product Type
  • Figure 27: North America Market Value Share and BPS Analysis by Distribution Channel, 2025 and 2035
  • Figure 28: North America Market Y-o-Y Growth Comparison by Distribution Channel, 2025-2035
  • Figure 29: North America Market Attractiveness Analysis by Distribution Channel
  • Figure 30: North America Market Value Share and BPS Analysis by Application, 2025 and 2035
  • Figure 31: North America Market Y-o-Y Growth Comparison by Application, 2025-2035
  • Figure 32: North America Market Attractiveness Analysis by Application
  • Figure 33: Latin America Market Value Share and BPS Analysis by Country, 2025 and 2035
  • Figure 34: Latin America Market Value Share and BPS Analysis by Product Type, 2025 and 2035
  • Figure 35: Latin America Market Y-o-Y Growth Comparison by Product Type, 2025-2035
  • Figure 36: Latin America Market Attractiveness Analysis by Product Type
  • Figure 37: Latin America Market Value Share and BPS Analysis by Distribution Channel, 2025 and 2035
  • Figure 38: Latin America Market Y-o-Y Growth Comparison by Distribution Channel, 2025-2035
  • Figure 39: Latin America Market Attractiveness Analysis by Distribution Channel
  • Figure 40: Latin America Market Value Share and BPS Analysis by Application, 2025 and 2035
  • Figure 41: Latin America Market Y-o-Y Growth Comparison by Application, 2025-2035
  • Figure 42: Latin America Market Attractiveness Analysis by Application
  • Figure 43: Western Europe Market Value Share and BPS Analysis by Country, 2025 and 2035
  • Figure 44: Western Europe Market Value Share and BPS Analysis by Product Type, 2025 and 2035
  • Figure 45: Western Europe Market Y-o-Y Growth Comparison by Product Type, 2025-2035
  • Figure 46: Western Europe Market Attractiveness Analysis by Product Type
  • Figure 47: Western Europe Market Value Share and BPS Analysis by Distribution Channel, 2025 and 2035
  • Figure 48: Western Europe Market Y-o-Y Growth Comparison by Distribution Channel, 2025-2035
  • Figure 49: Western Europe Market Attractiveness Analysis by Distribution Channel
  • Figure 50: Western Europe Market Value Share and BPS Analysis by Application, 2025 and 2035
  • Figure 51: Western Europe Market Y-o-Y Growth Comparison by Application, 2025-2035
  • Figure 52: Western Europe Market Attractiveness Analysis by Application
  • Figure 53: Eastern Europe Market Value Share and BPS Analysis by Country, 2025 and 2035
  • Figure 54: Eastern Europe Market Value Share and BPS Analysis by Product Type, 2025 and 2035
  • Figure 55: Eastern Europe Market Y-o-Y Growth Comparison by Product Type, 2025-2035
  • Figure 56: Eastern Europe Market Attractiveness Analysis by Product Type
  • Figure 57: Eastern Europe Market Value Share and BPS Analysis by Distribution Channel, 2025 and 2035
  • Figure 58: Eastern Europe Market Y-o-Y Growth Comparison by Distribution Channel, 2025-2035
  • Figure 59: Eastern Europe Market Attractiveness Analysis by Distribution Channel
  • Figure 60: Eastern Europe Market Value Share and BPS Analysis by Application, 2025 and 2035
  • Figure 61: Eastern Europe Market Y-o-Y Growth Comparison by Application, 2025-2035
  • Figure 62: Eastern Europe Market Attractiveness Analysis by Application
  • Figure 63: East Asia Market Value Share and BPS Analysis by Country, 2025 and 2035
  • Figure 64: East Asia Market Value Share and BPS Analysis by Product Type, 2025 and 2035
  • Figure 65: East Asia Market Y-o-Y Growth Comparison by Product Type, 2025-2035
  • Figure 66: East Asia Market Attractiveness Analysis by Product Type
  • Figure 67: East Asia Market Value Share and BPS Analysis by Distribution Channel, 2025 and 2035
  • Figure 68: East Asia Market Y-o-Y Growth Comparison by Distribution Channel, 2025-2035
  • Figure 69: East Asia Market Attractiveness Analysis by Distribution Channel
  • Figure 70: East Asia Market Value Share and BPS Analysis by Application, 2025 and 2035
  • Figure 71: East Asia Market Y-o-Y Growth Comparison by Application, 2025-2035
  • Figure 72: East Asia Market Attractiveness Analysis by Application
  • Figure 73: South Asia & Pacific Market Value Share and BPS Analysis by Country, 2025 and 2035
  • Figure 74: South Asia & Pacific Market Value Share and BPS Analysis by Product Type, 2025 and 2035
  • Figure 75: South Asia & Pacific Market Y-o-Y Growth Comparison by Product Type, 2025-2035
  • Figure 76: South Asia & Pacific Market Attractiveness Analysis by Product Type
  • Figure 77: South Asia & Pacific Market Value Share and BPS Analysis by Distribution Channel, 2025 and 2035
  • Figure 78: South Asia & Pacific Market Y-o-Y Growth Comparison by Distribution Channel, 2025-2035
  • Figure 79: South Asia & Pacific Market Attractiveness Analysis by Distribution Channel
  • Figure 80: South Asia & Pacific Market Value Share and BPS Analysis by Application, 2025 and 2035
  • Figure 81: South Asia & Pacific Market Y-o-Y Growth Comparison by Application, 2025-2035
  • Figure 82: South Asia & Pacific Market Attractiveness Analysis by Application
  • Figure 83: Middle East and Africa Market Value Share and BPS Analysis by Country, 2025 and 2035
  • Figure 84: Middle East and Africa Market Value Share and BPS Analysis by Product Type, 2025 and 2035
  • Figure 85: Middle East and Africa Market Y-o-Y Growth Comparison by Product Type, 2025-2035
  • Figure 86: Middle East and Africa Market Attractiveness Analysis by Product Type
  • Figure 87: Middle East and Africa Market Value Share and BPS Analysis by Distribution Channel, 2025 and 2035
  • Figure 88: Middle East and Africa Market Y-o-Y Growth Comparison by Distribution Channel, 2025-2035
  • Figure 89: Middle East and Africa Market Attractiveness Analysis by Distribution Channel
  • Figure 90: Middle East and Africa Market Value Share and BPS Analysis by Application, 2025 and 2035
  • Figure 91: Middle East and Africa Market Y-o-Y Growth Comparison by Application, 2025-2035
  • Figure 92: Middle East and Africa Market Attractiveness Analysis by Application
  • Figure 93: Global Market - Tier Structure Analysis
  • Figure 94: Global Market - Company Share Analysis

Frequently Asked Questions

What is the projected size of the spray dried food market in 2025?

The market is valued at USD 67.6 billion in 2025.

What is the outlook on spray dried food demand by 2035?

The market is forecasted to reach USD 142 billion by 2035, reflecting a CAGR of 7.7%.

Which segment leads the spray dried food market by product type in 2025?

The dairy products segment is expected to hold approximately 33.4% of the global market share in 2025.

What is the top application sector for the spray dried food market in 2025?

Flavoured beverages will dominate the application segment with a 28% share in 2025.

Which country is projected to have the fastest-growing spray dried food market?

The USA is anticipated to be the fastest-growing country with a CAGR of 5.7% from 2025 to 2035.

Explore Similar Insights

Future Market Insights

Spray Dried Food Market