The global splicing tape market is valued at USD 1,847 million in 2025 and is projected to reach USD 3,215.3 million by 2035, exhibiting a CAGR of 5.7%. As reported in Future Market Insights (FMI)’s verified packaging intelligence series, covering sustainability and material lifecycle trends, the market stands at the forefront of a transformative decade that promises to redefine manufacturing continuity and production efficiency across converting industries, web processing operations, and specialty applications. The market's journey from USD 1,847 million in 2025 to USD 3,215.3 million by 2035 represents substantial growth, demonstrating the accelerating adoption of advanced adhesive solutions and automated splicing systems across paper mills, film converting facilities, textile manufacturing, and packaging production sectors.
The first half of the decade (2025-2030) will witness the market climbing from USD 1,847 million to approximately USD 2,387 million, adding USD 540 million in value, which constitutes 39% of the total forecast growth period. This phase will be characterized by the rapid adoption of automated splicing systems, driven by increasing demand for production efficiency materials and enhanced web handling capabilities worldwide. Superior adhesive performance and reliable bond strength will become standard expectations rather than premium options.
The latter half (2030-2035) will witness sustained growth from USD 2,387 million to USD 3,215.3 million, representing an addition of USD 827 million or 61% of the decade's expansion. This period will be defined by mass market penetration of specialized splicing systems, integration with comprehensive automation platforms, and seamless compatibility with existing manufacturing infrastructure. The market trajectory signals fundamental shifts in how converting operations and web processing facilities approach production continuity solutions, with participants positioned to benefit from sustained demand across multiple application segments.
As e-commerce continues to expand globally, the need for efficient and reliable packaging solutions is increasing, which boosts the demand for splicing tapes used in packaging production lines. These tapes help streamline the packaging process by securely joining materials, such as paper and plastic, while maintaining the integrity of the packaging. Furthermore, the rise in demand for tamper-evident packaging and secure sealing in industries like food and beverages and pharmaceuticals is increasing the demand for splicing tapes as an effective solution.
Advancements in tape manufacturing technology have also played a significant role in the growth of the splicing tape market. Innovations in adhesive formulations and tape materials have improved the performance of splicing tapes, making them more efficient, durable, and versatile across different applications. Newer versions of splicing tapes are now available that offer enhanced properties such as improved temperature resistance, moisture resistance, and UV stability, making them ideal for use in challenging environments. As manufacturers continue to innovate and improve the performance of these tapes, the market will continue to expand, offering more options for industries looking to enhance their production processes.
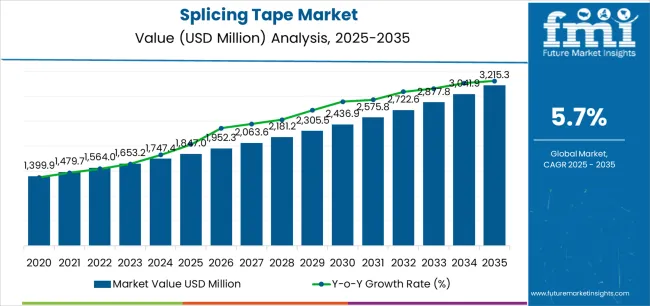
The splicing tape market demonstrates distinct growth phases with varying market characteristics and competitive dynamics. Between 2025 and 2030, the market progresses through its manufacturing automation phase, expanding from USD 1,847 million to USD 2,387 million with steady annual increments averaging 5.3% growth. This period showcases the transition from manual splicing operations to automated systems with enhanced adhesive formulations and integrated web handling becoming mainstream features.
The 2025-2030 phase adds USD 540 million to market value, representing 39% of total decade expansion. Market maturation factors include standardization of automated splicing protocols, declining component costs for specialty adhesives, and increasing manufacturing awareness of splicing tape benefits reaching 75-80% effectiveness in converting operations. Competitive landscape evolution during this period features established manufacturers like 3M Company and tesa SE expanding their industrial adhesive portfolios while new entrants focus on specialized formulations and enhanced application systems.
From 2030 to 2035, market dynamics shift toward advanced automation and multi-substrate compatibility, with growth accelerating from USD 2,387 million to USD 3,215.3 million, adding USD 827 million or 61% of total expansion. This phase transition logic centers on universal splicing systems, integration with Industry 4.0 platforms, and deployment across diverse manufacturing scenarios, becoming standard rather than specialized applications. The competitive environment matures with focus shifting from basic adhesive performance to comprehensive production efficiency systems and integration with digital manufacturing platforms.
At-a-Glance Metrics
| Metric | Value |
|---|---|
| Market Value (2025) | USD 1,847 million |
| Market Forecast (2035) | USD 3,215.3 million |
| Growth Rate | 5.70% CAGR |
| Leading Technology | Double-Sided Tape |
| Primary Application | Paper & Printing Segment |
The market demonstrates strong fundamentals with double-sided tape systems capturing a dominant share through superior bonding capabilities and reliable adhesive performance. Paper and printing applications drive primary demand, supported by increasing manufacturing investment in production efficiency systems and web handling optimization solutions. Geographic expansion remains concentrated in Asia Pacific with established converting infrastructure, while developed markets show steady adoption rates driven by automation upgrades and quality improvement initiatives.
The splicing tape market represents a compelling intersection of adhesive technology innovation, manufacturing automation, and production efficiency management. With robust growth projected from USD 1,847 million in 2025 to USD 3,215.3 million by 2035 at a 5.70% CAGR, this market is driven by increasing production continuity requirements, automated web handling expansion, and manufacturing demand for zero-downtime operations.
The market's expansion reflects a fundamental shift in how converting operations and web processing facilities approach production efficiency infrastructure. Strong growth opportunities exist across diverse applications, from paper operations requiring continuous production to film facilities demanding maximum bond reliability and minimal contamination. Geographic expansion is particularly pronounced in Asia-Pacific markets, led by China (6.8% CAGR) and India (6.5% CAGR), while established markets in North America and Europe drive innovation and specialty formulation development.
The dominance of double-sided tape systems and paper applications underscores the importance of proven adhesive technology and manufacturing reliability in driving adoption. Substrate compatibility and application complexity remain key challenges, creating opportunities for companies that can deliver superior performance while maintaining operational simplicity.
Market expansion rests on three fundamental shifts driving adoption across converting and manufacturing sectors. 1. Production efficiency demand creates compelling operational advantages through splicing tape systems that provide continuous web processing with minimal downtime, enabling manufacturers to maximize throughput while maintaining product quality and reducing material waste. 2. Manufacturing automation accelerates as converting facilities worldwide seek reliable joining systems that integrate seamlessly with automated web handling equipment, enabling production continuity that aligns with efficiency goals and quality control requirements. 3. Quality improvement focus drives adoption from paper mills and film converters requiring dependable splicing solutions that minimize web breaks while maintaining consistent bond strength during high-speed processing and tension-critical operations.
However, growth faces headwinds from substrate compatibility challenges that vary across manufacturing segments regarding adhesive selection and application requirements, potentially limiting deployment flexibility in specialty film and coated material categories. Application complexity also persists regarding surface preparation and environmental conditions that may increase operational demands in facilities with variable temperature and humidity standards.
Primary Classification: The market segments by product type into double-sided tape, single-sided tape, and repulpable tape categories, representing the evolution from basic adhesive joining to advanced specialty formulations for comprehensive web splicing operations.
Secondary Breakdown: Application segmentation divides the market into paper & printing, packaging films, textile manufacturing, label production, industrial films, and others sectors, reflecting distinct requirements for adhesive strength, substrate compatibility, and production speed integration.
Regional Classification: Geographic distribution covers Asia Pacific, North America, Europe, Latin America, and the Middle East & Africa, with emerging markets leading volume growth while developed economies drive innovation and specialty formulation adoption programs.
The segmentation structure reveals technology progression from standard double-sided constructions toward integrated multi-layer platforms with enhanced adhesive chemistry and application-specific capabilities, while application diversity spans from paper operations to specialty film facilities requiring precise bonding and clean release solutions.
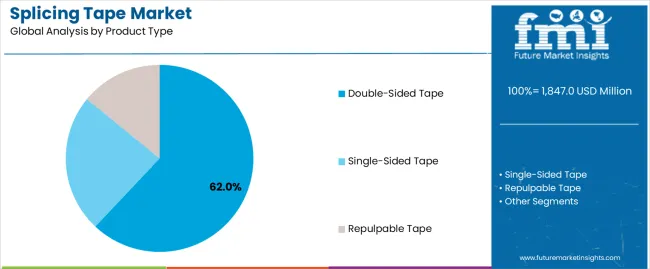
Double-sided tape segment is estimated to account for 62% of the splicing tape market share in 2025. The segment's leading position stems from its fundamental role as a critical component in automated web processing applications and its extensive use across multiple converting industry sectors. Double-sided tape's dominance is attributed to its superior bonding strength, including permanent adhesion capabilities, multi-substrate compatibility, and instant tack properties that make it indispensable for continuous production operations.
Market Position: Double-sided tape systems command the leading position in the splicing tape market through advanced adhesive features, including comprehensive substrate bonding options, automated application compatibility, and reliable performance that enable manufacturers to deploy efficient splicing solutions across diverse converting environments.
Value Drivers: The segment benefits from manufacturing preference for proven bonding technology that provides exceptional joint strength without requiring complex surface preparation. Reliable adhesive formulations enable deployment in paper converting, film processing, and textile applications where production continuity and bond integrity represent critical operational requirements.
Competitive Advantages: Double-sided tape systems differentiate through excellent adhesion properties, proven performance reliability, and compatibility with automated splicing equipment that enhance production efficiency while maintaining cost-effective operational profiles suitable for diverse manufacturing applications.
Key market characteristics:
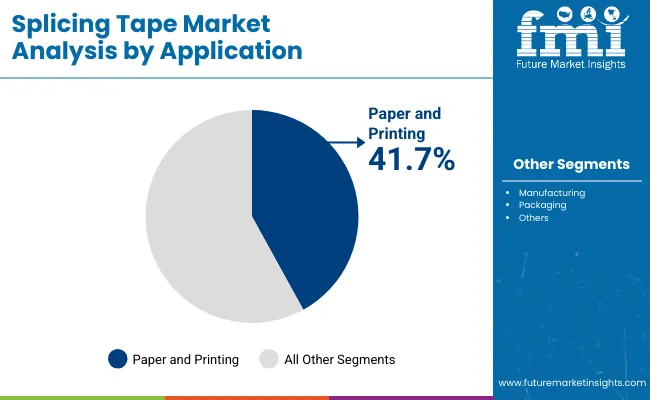
Paper & printing segment is projected to hold 41% of the splicing tape market share in 2025. The segment's market leadership is driven by the extensive use of splicing tapes in continuous paper production, roll changing operations, web offset printing, and commercial printing facilities, where splice reliability serves as both a production necessity and quality assurance requirement. The paper industry's consistent investment in production efficiency materials supports the segment's dominant position.
Market Context: Paper applications dominate the market due to widespread adoption of automated splicing systems and increasing focus on production continuity management, waste reduction, and manufacturing efficiency applications that enhance throughput while maintaining web integrity.
Appeal Factors: Paper mills prioritize splice strength, bond consistency, and integration with web handling equipment that enable coordinated deployment across multiple production lines. The segment benefits from substantial efficiency investments and continuous operation requirements that emphasize reliable splicing for paper converting and printing operations.
Growth Drivers: Mill modernization programs incorporate automated splicing systems as standard equipment for continuous paper production and roll changing applications. At the same time, printing industry initiatives are increasing demand for dependable tapes that comply with production standards and enhance operational efficiency.
Market Challenges: Substrate variability and moisture sensitivity may limit deployment flexibility in uncoated paper grades or high-humidity scenarios.
Application dynamics include:
Growth Accelerators: Manufacturing automation drives primary adoption as splicing tape systems provide exceptional continuity capabilities that enable production efficiency without excessive downtime costs, supporting operational excellence and throughput optimization that require reliable web joining solutions. Converting industry expansion accelerates market growth as paper mills and film processors seek dependable joining systems that maintain product quality during web changes while enhancing material utilization through reduced waste generation. Efficiency investment increases worldwide, creating sustained demand for advanced splicing systems that improve production economics and provide competitive advantages in cost-sensitive manufacturing environments.
Growth Inhibitors: Application complexity challenges vary across substrate types regarding adhesive selection and surface preparation requirements, which may limit market penetration and operational flexibility in specialty film categories with demanding bonding specifications. Substrate compatibility persists regarding coated materials and release-treated surfaces that may increase technical demands in applications with critical adhesion standards. Market fragmentation across multiple adhesive chemistries and application methods creates specification concerns between different tape suppliers and existing manufacturing infrastructure.
Market Evolution Patterns: Adoption accelerates in paper and packaging sectors where production continuity justifies adhesive costs, with geographic concentration in Asia Pacific transitioning toward mainstream adoption in developed markets driven by automation upgrades and efficiency improvement programs. Technology development focuses on enhanced adhesive formulations, improved application systems, and integration with manufacturing execution platforms that optimize splice quality and production monitoring. The market could face disruption if alternative joining methods or mechanical fastening innovations significantly challenge tape advantages in converting applications.
The splicing tape market demonstrates varied regional dynamics with Growth Leaders including China (6.8% CAGR) and India (6.5% CAGR) driving expansion through paper industry growth and converting facility development. Steady Performers encompass the USA (5.9% CAGR), Germany (5.4% CAGR), and Japan (5.1% CAGR), benefiting from established manufacturing sectors and automation adoption.
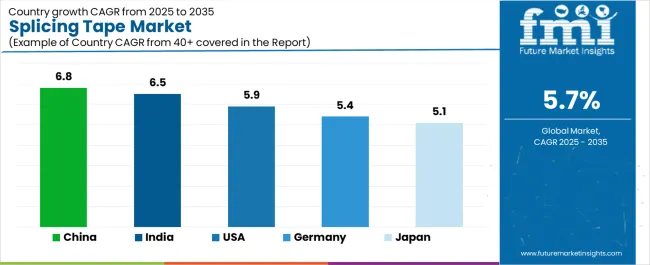
| Country | CAGR (2025-2035) |
|---|---|
| China | 6.8% |
| India | 6.5% |
| USA | 5.9% |
| Germany | 5.4% |
| Japan | 5.1% |
Regional synthesis reveals Asia-Pacific markets leading growth through paper production expansion and converting industry development, while European countries maintain steady expansion supported by manufacturing automation and efficiency improvement requirements. North American markets show strong growth driven by packaging applications and production optimization investments.
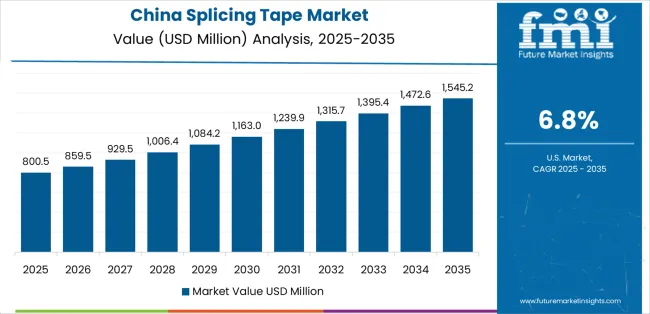
China establishes regional leadership through extensive paper industry capacity and comprehensive converting facility development, integrating advanced splicing tape systems as standard components in continuous production and automated web handling applications. The country's 6.8% CAGR through 2035 reflects government initiatives promoting manufacturing efficiency and industrial modernization that mandate the use of reliable joining systems in paper production operations. Growth concentrates in major manufacturing clusters, including Guangdong, Zhejiang, and Jiangsu, where paper mill expansion showcases integrated automated splicing systems that appeal to domestic converters seeking enhanced production continuity and international efficiency standards.
Chinese manufacturers are developing innovative splicing tape solutions that combine cost-effective production with advanced adhesive performance, including multi-substrate compatibility systems and automated application capabilities.
Strategic Market Indicators:
The Indian market emphasizes paper production growth, including rapid converting facility development and comprehensive manufacturing efficiency initiatives that increasingly incorporate splicing tapes for continuous production and web handling applications. The country is projected to show a 6.5% CAGR through 2035, driven by massive paper consumption growth under economic development programs and commercial demand for reliable, cost-effective joining systems. Indian paper facilities prioritize production continuity with splicing tapes delivering enhanced efficiency through reduced downtime and automated application capabilities.
Technology deployment channels include major paper mills, packaging converters, and industrial distributors that support standardized solutions for manufacturing applications.
Performance Metrics:
The USA market emphasizes advanced splicing tape features, including specialized adhesive formulations and integration with comprehensive automation platforms that manage web handling, splice detection, and quality monitoring applications through unified manufacturing systems. The country is projected to show a 5.9% CAGR through 2035, driven by mill modernization under efficiency improvement programs and commercial demand for reliable, high-performance joining systems. American manufacturers prioritize production continuity with splicing tapes delivering exceptional bond strength through advanced adhesive chemistry and automated application integration.
Technology deployment channels include major adhesive suppliers, specialized converting equipment providers, and manufacturing procurement programs that support custom formulations for critical production operations.
Performance Metrics:
In Bavaria, North Rhine-Westphalia, and Baden-Württemberg, German paper mills and packaging converters are implementing advanced splicing tape systems to enhance production reliability capabilities and support manufacturing excellence that aligns with quality requirements and efficiency protocols. The German market demonstrates sustained growth with a 5.4% CAGR through 2035, driven by Industry 4.0 modernization programs and converting efficiency investments that emphasize advanced joining systems for paper and packaging applications. German manufacturing facilities are prioritizing splicing tape systems that provide exceptional bond reliability while maintaining compliance with production standards and minimizing quality variations, particularly important in specialty paper and high-speed converting operations.
Market expansion benefits from manufacturing excellence programs that mandate reliable splicing in production specifications, creating sustained demand across Germany's paper and packaging sectors, where efficiency and consistency represent critical requirements.
Strategic Market Indicators:
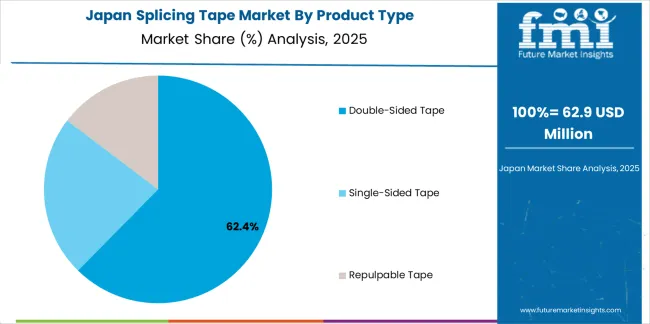
Japan's sophisticated manufacturing market demonstrates meticulous splicing tape deployment, growing at 5.1% CAGR, with documented operational excellence in paper production and packaging applications through integration with existing automation systems and quality control infrastructure. The country leverages engineering expertise in precision manufacturing and process optimization to maintain market leadership. Manufacturing centers, including Shizuoka, Aichi, and Osaka, showcase advanced installations where splicing tape systems integrate with comprehensive production platforms and monitoring systems to optimize web handling and operational efficiency.
Japanese paper mills prioritize splice perfection and production continuity in converting operations, creating demand for flawless splicing tape systems with advanced features, including precise adhesive application and integration with automated roll handling protocols. The market benefits from established manufacturing infrastructure and willingness to invest in premium joining technologies that provide superior production reliability and process consistency.
Market Intelligence Brief:
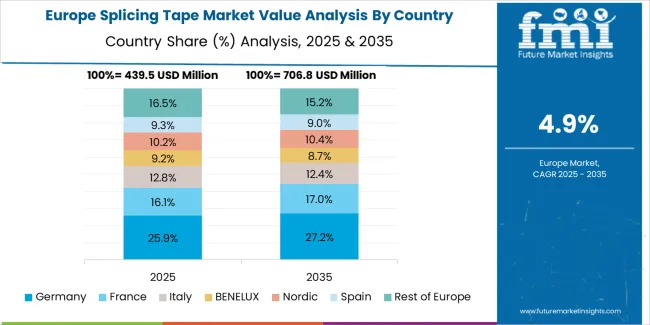
The splicing tape market in Europe is projected to grow from USD 463 million in 2025 to USD 748 million by 2035, registering a CAGR of 4.9% over the forecast period. Germany is expected to maintain its leadership position with a 38.2% market share in 2025, declining slightly to 37.8% by 2035, supported by its extensive paper industry and major converting centers, including Bavaria and North Rhine-Westphalia.
Italy follows with a 21.4% share in 2025, projected to reach 21.7% by 2035, driven by comprehensive packaging converting and specialty paper initiatives. The United Kingdom holds a 16.9% share in 2025, expected to maintain 17.1% by 2035 through established printing sectors and packaging production adoption. France commands a 14.3% share, while Spain accounts for 7.2% in 2025. The Rest of Europe region is anticipated to gain momentum, expanding its collective share from 1.0% to 1.4% by 2035, attributed to increasing converting adoption in Nordic countries and emerging Eastern European paper facilities implementing automated splicing programs.
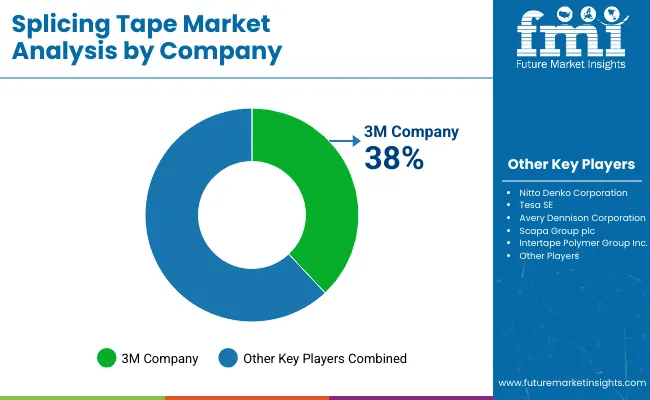
The splicing tape market features 10–15 players with moderate concentration, where the top three companies collectively hold around 45–52% of global market share, driven by advanced adhesive technologies, diverse product offerings, and strong relationships with industries such as manufacturing, logistics, and automotive. The leading company, 3M Company, commands 6% of the market share, supported by its extensive portfolio of high-performance splicing tapes and strong brand reputation across various industrial sectors. Competition focuses on tape adhesion strength, durability, temperature resistance, and precision performance rather than simple price competition.
Market leaders such as 3M Company, tesa SE, and Nitto Denko Corporation maintain their competitive positions by offering high-quality splicing tapes designed for diverse applications, including paper and film splicing, wire and cable splicing, and more. These companies differentiate by providing specialized tapes that ensure smooth, reliable, and efficient splicing while minimizing downtime in production environments.
Challenger companies like Scapa Group plc, Intertape Polymer Group, and Shurtape Technologies, LLC focus on producing customized splicing tapes for specific market needs, including those with enhanced adhesion for heavy-duty applications or extreme environmental conditions.
Additional competitive pressure comes from regional players such as Avery Dennison Corporation, Saint-Gobain Performance Plastics, and Henkel AG & Co. KGaA, which strengthen their positions by offering cost-effective, locally tailored solutions and robust customer service.
| Item | Value |
|---|---|
| Quantitative Units | USD 1,847 million |
| Product Type | Double-Sided Tape, Single-Sided Tape, Repulpable Tape |
| Application | Paper & Printing, Packaging Films, Textile Manufacturing, Label Production, Industrial Films, Others |
| Regions Covered | Asia Pacific, North America, Europe, Latin America, Middle East & Africa |
| Countries Covered | China, India, USA, Germany, Japan, and 25+ additional countries |
| Key Companies Profiled | 3M Company, tesa SE, Nitto Denko Corporation, Scapa Group plc, Intertape Polymer Group, Shurtape Technologies, LLC, Avery Dennison Corporation, Saint-Gobain Performance Plastics, Henkel AG & Co. KGaA, ORAFOL Europe GmbH |
| Additional Attributes | Dollar sales by product type and application categories, regional adoption trends across Asia Pacific, North America, and Europe, competitive landscape with adhesive manufacturers and specialty suppliers, manufacturing preferences for adhesive performance and application reliability, integration with automated splicing systems and web handling equipment, innovations in adhesive chemistry and application technology, and development of specialty formulations with enhanced bonding and substrate compatibility capabilities |
The global splicing tape market is estimated to be valued at USD 1,847.0 million in 2025.
The market size for the splicing tape market is projected to reach USD 3,215.3 million by 2035.
The splicing tape market is expected to grow at a 5.7% CAGR between 2025 and 2035.
The key product types in splicing tape market are double-sided tape, single-sided tape and repulpable tape.
In terms of application, paper & printing segment to command 41.0% share in the splicing tape market in 2025.


Our Research Products

The "Full Research Suite" delivers actionable market intel, deep dives on markets or technologies, so clients act faster, cut risk, and unlock growth.

The Leaderboard benchmarks and ranks top vendors, classifying them as Established Leaders, Leading Challengers, or Disruptors & Challengers.

Locates where complements amplify value and substitutes erode it, forecasting net impact by horizon

We deliver granular, decision-grade intel: market sizing, 5-year forecasts, pricing, adoption, usage, revenue, and operational KPIs—plus competitor tracking, regulation, and value chains—across 60 countries broadly.

Spot the shifts before they hit your P&L. We track inflection points, adoption curves, pricing moves, and ecosystem plays to show where demand is heading, why it is changing, and what to do next across high-growth markets and disruptive tech

Real-time reads of user behavior. We track shifting priorities, perceptions of today’s and next-gen services, and provider experience, then pace how fast tech moves from trial to adoption, blending buyer, consumer, and channel inputs with social signals (#WhySwitch, #UX).

Partner with our analyst team to build a custom report designed around your business priorities. From analysing market trends to assessing competitors or crafting bespoke datasets, we tailor insights to your needs.
Supplier Intelligence
Discovery & Profiling
Capacity & Footprint
Performance & Risk
Compliance & Governance
Commercial Readiness
Who Supplies Whom
Scorecards & Shortlists
Playbooks & Docs
Category Intelligence
Definition & Scope
Demand & Use Cases
Cost Drivers
Market Structure
Supply Chain Map
Trade & Policy
Operating Norms
Deliverables
Buyer Intelligence
Account Basics
Spend & Scope
Procurement Model
Vendor Requirements
Terms & Policies
Entry Strategy
Pain Points & Triggers
Outputs
Pricing Analysis
Benchmarks
Trends
Should-Cost
Indexation
Landed Cost
Commercial Terms
Deliverables
Brand Analysis
Positioning & Value Prop
Share & Presence
Customer Evidence
Go-to-Market
Digital & Reputation
Compliance & Trust
KPIs & Gaps
Outputs
Full Research Suite comprises of:
Market outlook & trends analysis
Interviews & case studies
Strategic recommendations
Vendor profiles & capabilities analysis
5-year forecasts
8 regions and 60+ country-level data splits
Market segment data splits
12 months of continuous data updates
DELIVERED AS:
PDF EXCEL ONLINE
Market Share Breakdown of Splicing Tape Solutions
Tape Unwinder Market Size and Share Forecast Outlook 2025 to 2035
Tape Dispenser Market Size and Share Forecast Outlook 2025 to 2035
Tape Dispenser Industry Analysis in Japan Size and Share Forecast Outlook 2025 to 2035
Tape Dispenser Industry Analysis in Western Europe Size and Share Forecast Outlook 2025 to 2035
Tape Measure Market Size and Share Forecast Outlook 2025 to 2035
Tape Backing Materials Market Analysis by Material Type, Application, and Region through 2025 to 2035
Tape Stretching Line Market Analysis – Growth & Trends 2025 to 2035
Tapes Market Insights – Growth & Demand 2025 to 2035
Tape Banding Machine Market Overview - Demand & Growth Forecast 2025 to 2035
Competitive Overview of Tape Dispenser Companies
Competitive Overview of Tape Backing Materials Companies
Tape & Label Adhesives Market
Tape Applicator Machines Market
UV Tapes Market Growth - Trends & Forecast 2025 to 2035
PVC Tapes Market Size and Share Forecast Outlook 2025 to 2035
Leading Providers & Market Share in PVC Tapes Industry
ESD Tapes and Labels Market from 2025 to 2035
USA Tapes Market Analysis – Growth & Forecast 2024-2034
Duct Tape Market Size and Share Forecast Outlook 2025 to 2035

Thank you!
You will receive an email from our Business Development Manager. Please be sure to check your SPAM/JUNK folder too.
Chat With
MaRIA