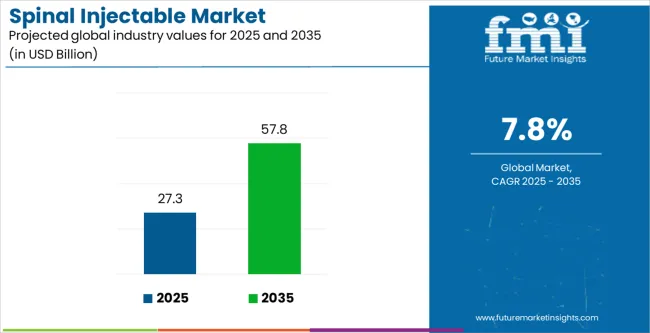
The Spinal Injectable Market is estimated to be valued at USD 27.3 billion in 2025 and is projected to reach USD 57.8 billion by 2035, registering a compound annual growth rate (CAGR) of 7.8% over the forecast period.
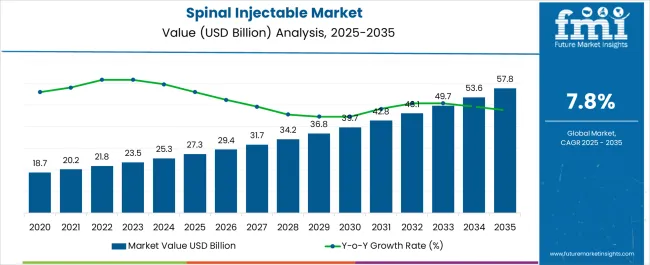
| Metric | Value |
|---|---|
| Spinal Injectable Market Estimated Value in (2025 E) | USD 27.3 billion |
| Spinal Injectable Market Forecast Value in (2035 F) | USD 57.8 billion |
| Forecast CAGR (2025 to 2035) | 7.8% |
The spinal injectable market is experiencing strong momentum owing to the rising prevalence of chronic back pain, degenerative disc disorders, and spinal injuries that require minimally invasive treatment approaches. Increasing patient preference for procedures that provide targeted pain relief with reduced recovery times is driving demand for spinal injectables across diagnostic and therapeutic settings.
Advancements in imaging guidance, such as fluoroscopy and ultrasound, have improved accuracy in spinal injections, reducing complications and enhancing clinical outcomes. Growing geriatric populations worldwide, combined with the rising incidence of lifestyle-related spinal conditions, are further accelerating adoption.
Regulatory approvals for newer formulations and expanding reimbursement support in developed healthcare systems are reinforcing market growth. With ongoing innovation and expanding clinical applications, the market outlook remains highly favorable, particularly in regions emphasizing non-surgical pain management and precision-based diagnostics.
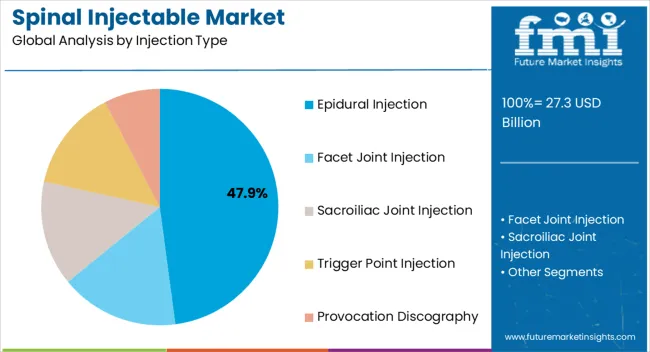
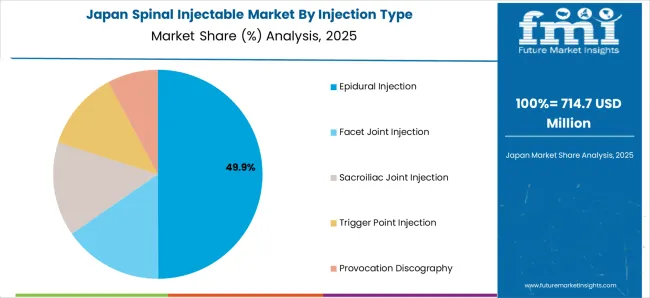
The epidural injection segment is projected to account for 47.90% of total revenue by 2025 within the injection type category, positioning it as the leading segment. This dominance is driven by its effectiveness in delivering targeted pain relief for conditions such as herniated discs, spinal stenosis, and sciatica.
The ability to administer medication directly into the epidural space ensures rapid therapeutic impact while minimizing systemic side effects. Widespread clinical use in both diagnostic confirmation and therapeutic pain management has solidified its adoption.
The growing reliance on epidural injections as a first-line interventional approach to avoid surgical procedures continues to strengthen its position in the market.
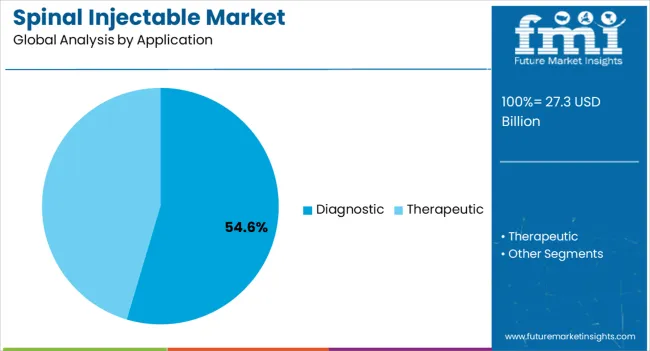
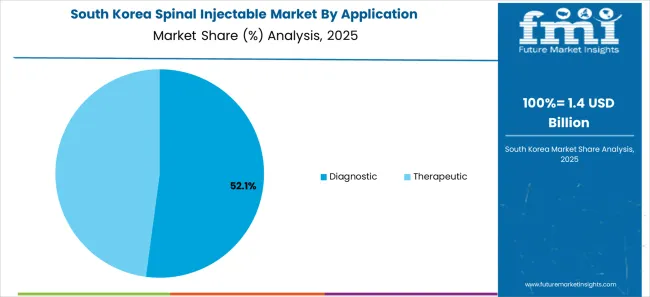
The diagnostic segment is expected to contribute 54.60% of total revenue by 2025 under the application category, making it the most significant segment. This growth is attributed to the increasing use of spinal injectables in confirming the source of pain before proceeding with invasive surgical treatments.
Diagnostic injections help clinicians isolate specific pain generators, thereby improving treatment precision and patient outcomes. The rising clinical importance of accurate diagnosis in managing complex spinal disorders has fueled demand for diagnostic applications.
Integration of imaging guidance technologies has further increased procedural reliability, ensuring consistent results and strengthening this segment’s leadership.
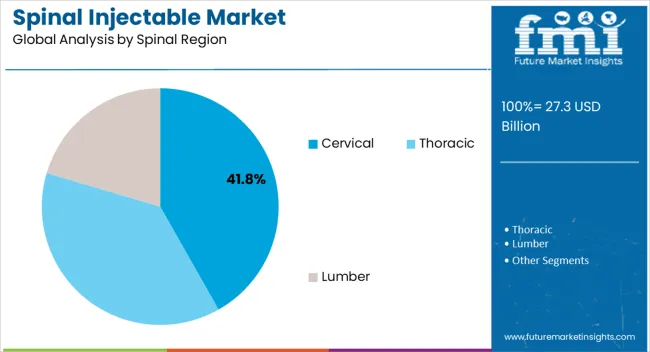
The cervical region segment is projected to hold 41.80% of total market revenue by 2025 within the spinal region category, positioning it as the dominant area of focus. This is driven by the high prevalence of neck pain and cervical spine disorders resulting from sedentary lifestyles, poor posture, and age-related degeneration.
The cervical spine is particularly susceptible to stress due to its mobility and structural complexity, creating consistent demand for targeted injections. Rising awareness of minimally invasive treatments and the growing incidence of cervical radiculopathy have further supported the uptake of spinal injectables in this region.
As patients and healthcare providers increasingly seek non-surgical interventions, the cervical segment remains at the forefront of spinal injectable applications.
From 2012 to 2025, the global spinal injectable market experienced a CAGR of 8.0%, reaching a market size of USD 27.3 billion in 2025.
From 2012 to 2025, the global spinal injectable industry witnessed steady growth due to the rising spinal disorders. The prevalence of spinal illnesses such as herniated discs, spinal stenosis, and degenerative disc diseases has increased significantly during the last decade. As a result, demand for spinal injectables as a non-surgical treatment option has increased, adding to market growth. Furthermore, patients are increasingly looking for minimally invasive treatment options in order to avoid the dangers and difficulties that come with open operations. Spinal injectables provide a less intrusive alternative for treating spinal diseases, which is increasing their popularity and demand.
Future Forecast for Spinal Injectable Industry:
Looking ahead, the global spinal injectable industry is expected to rise at a CAGR of 8.2% from 2025 to 2035. During the forecast period, the market size is expected to reach USD 57.8 billion in 2035.
The spinal injectable market is anticipated to expand between 2025 and 2035, driven by technological development in the injectables for better treatment outcomes. The introduction of biologic therapies such as platelet-rich plasma (PRP) and stem cell injections is projected to have an effect on the spinal injectables market. Biologics have the ability to regenerate tissue and promote recovery, opening up new therapy options for spinal diseases.
Further developments in drug delivery technologies for spinal injectables are possible in the future. This includes the creation of sustained-release formulations, tailored delivery systems, and implanted devices that can improve therapy efficacy and duration.
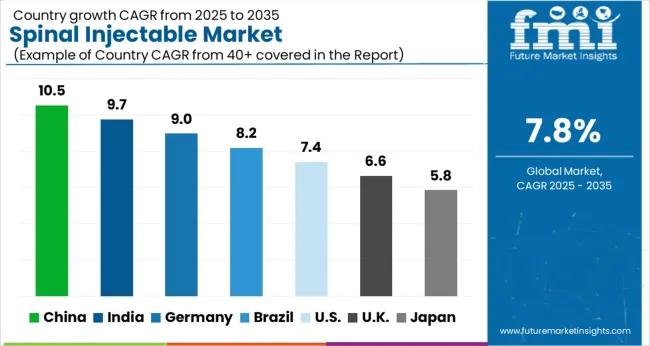
| Country | The United States |
|---|---|
| Market Size (USD billion) by End of Forecast Period (2035) | USD 57.8 billion |
| CAGR % 2025 to End of Forecast (2035) | 7.7% |
The spinal injectable industry in the United States is expected to reach a market value of USD 57.8 billion by 2035, expanding at a CAGR of 7.7%. Due to the high prevalence of spinal illnesses and a well-developed healthcare system, the United States has a large need for spine injectables.
For instance, according to the Centers for Disease Control and Prevention's 2024 report, 39.0% of American adults in 2020 reported having back pain, 36.5% had lower limb pain, and 30.7% had upper limb pain. Furthermore, the growing emphasis on less invasive treatments and a preference for non-opioid alternatives for pain management have increased demand for spinal injectables. The market is distinguished by the presence of major pharmaceutical businesses as well as a strong regulatory environment.
| Country | The United Kingdom |
|---|---|
| Market Size (USD billion) by End of Forecast Period (2035) | USD 2.4 Billion |
| CAGR % 2025 to End of Forecast (2035) | 7.2% |
The spinal injectable industry in the United Kingdom is expected to reach a market value of USD 2.4 Billion by 2035, expanding at a CAGR of 7.2% during the forecast period. The market in the United Kingdom is expected to grow due to the increased focus on non-opioid pain management. The opioid issue is being actively addressed in the UK, which is also actively marketing non-opioid painkiller alternatives.
Because they provide effective non-opioid alternatives, spinal injectables like corticosteroids and local anesthetics are becoming more popular and their market is expanding.
| Country | China |
|---|---|
| Market Size (USD billion) by End of Forecast Period (2035) | USD 3.3 billion |
| CAGR % 2025 to End of Forecast (2035) | 9.0% |
The spinal injectable industry in China is anticipated to reach a market value of USD 3.3 billion in 2035, moving at a CAGR of 9.0% during the forecast period. The spinal injectable industry in China is expected to grow prominently. To increase access to high-quality healthcare, the Chinese government has been adopting healthcare reforms.
Market expansion is fueled by investments in cutting-edge therapies, such as spinal injectables, and a focus on enhancing the infrastructure for spine care.
| Country | Japan |
|---|---|
| Market Size (USD billion) by End of Forecast Period (2035) | USD 2.4 billion |
| CAGR % 2025 to End of Forecast (2035) | 8.9% |
The spinal injectable industry in Japan is estimated to reach a market value of USD 2.4 billion by 2035, thriving at a CAGR of 8.9%. It is anticipated that the Japanese market would expand due to an ageing population. The regulatory environment for digital therapeutics is evolving in Japan.
With one of the oldest populations in the world, Japan is more likely to experience spinal illnesses such spinal stenosis and degenerative disc degeneration. The need for spinal injectables as a non-surgical therapy option is driven by this demographic trend.
| Country | South Korea |
|---|---|
| Market Size (USD billion) by End of Forecast Period (2035) | USD 1.9 Billion |
| CAGR % 2025 to End of Forecast (2035) | 9.4% |
The spinal injectable industry in South Korea is expected to reach a market value of USD 1.9 billion by 2035, expanding at a CAGR of 9.4% during the forecast period. South Korea has a highly developed healthcare system and offers high-quality medical services. This makes it easier for the nation to adopt cutting-edge tools and therapies, such spinal injectables.
The epidural injection is expected to dominate the spinal injectable industry with a CAGR of 8.3% from 2025 to 2035. This segment captures a significant market share in 2025 due to its non-surgical treatment and effective pain management.
Back discomfort caused by a herniated disc (slipped disc), cervical or lumbar radiculopathy, sciatica or spinal stenosis, is routinely treated with epidural steroid injections. Corticosteroids are powerful anti-inflammatory drugs. When administered into the epidural space, they can considerably decrease inflammation surrounding an irritated nerve that is causing pain and suffering in the back and legs.
Therapeutic is expected to dominate the spinal injectable industry with a CAGR of 8.0% from 2025 to 2035. Due to the long-term relief from neck or low back discomfort this sector will hold a sizable market share in 2025. Prolonged sitting or a lack of physical activity can weaken the muscles that support the lumber spine, leading to increased vulnerability to injuries and disorders. Moreover, as people grow older, the spine undergoes natural degenerative changes, making them more susceptible to various lumbar spine conditions. Thus, the mentioned factors are supporting to dominate the market.
Thoracic is expected to dominate the spinal injectable industry with a CAGR of 8.2% from 2025 to 2035. Due to the sedentary lifestyle and aging population, the incidences are thoracic injury and disorders are in high number.
In most cases, therapeutic injections are used to relieve neck or back discomfort caused by a facet joint, spinal nerve, or intervertebral disc. A steroid medicine is often used in a therapeutic injection, with the purpose of giving extended pain relief.
The hospital is expected to dominate the spinal injectable industry with a CAGR of 7.8% from 2025 to 2035. This segment captures a significant market share in 2025 due to the suitable infrastructure and availability of equipment.
Spine injections require a high level of precision and expertise to ensure accurate needle placement and minimize potential risks. Hospitals have the necessary infrastructure, equipment, and trained medical professionals to perform these procedures safely. Moreover, the availability of necessary facilities and staff to provide post-procedure care and address the immediate concerns, the hospital segment is dominating the market
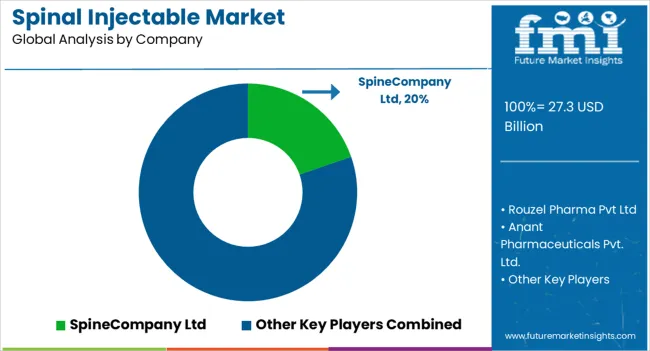
The spinal injectable industry is highly competitive, with numerous players vying for market share. In such a scenario, key players are adopting effective strategies to stay ahead of the competition.
Key Strategies Adopted by the Players
Product Innovation
Key players focus on developing and introducing innovative products to address unmet needs in the market. They invest in research and development to improve existing formulations, delivery systems, and enhance the efficacy and safety of the products
Strategic Partnerships and Collaborations
Key players often form strategic partnerships and collaborations with other companies, research institutes, or healthcare organizations, these partnerships allow for knowledge sharing, joint research and development efforts, and access to complementary technologies or expertise.
Expansion into Emerging Markets
Key players strive to expand their presence in different geographic regions to tap into new markets and reach a wider customer base. They may establish subsidiaries, distribution networks. Or strategic alliances in various countries to strengthen their market position.
Mergers and Acquisitions
Companies in the market may engage in mergers or acquisitions to consolidate their product portfolio, acquire new technologies, these strategic moves allow companies to enter new market segments, gain access to novel products or intellectual property, and achieve synergies in terms of research, manufacturing, or distributions.
Key Developments in the Spinal Injectable Market:
The global spinal injectable market is estimated to be valued at USD 27.3 billion in 2025.
The market size for the spinal injectable market is projected to reach USD 57.8 billion by 2035.
The spinal injectable market is expected to grow at a 7.8% CAGR between 2025 and 2035.
The key product types in spinal injectable market are epidural injection, facet joint injection, sacroiliac joint injection, trigger point injection and provocation discography.
In terms of application, diagnostic segment to command 54.6% share in the spinal injectable market in 2025.


Full Research Suite comprises of:
Market outlook & trends analysis
Interviews & case studies
Strategic recommendations
Vendor profiles & capabilities analysis
5-year forecasts
8 regions and 60+ country-level data splits
Market segment data splits
12 months of continuous data updates
DELIVERED AS:
PDF EXCEL ONLINE
Spinal Access Systems Market Size and Share Forecast Outlook 2025 to 2035
Spinal Pumps Market Size and Share Forecast Outlook 2025 to 2035
Spinal Implants and Devices Market Size and Share Forecast Outlook 2025 to 2035
Spinal Devices Market Size and Share Forecast Outlook 2025 to 2035
Spinal Cord Stimulators Market Growth - Trends & Forecast 2025 to 2035
Spinal Osteosynthesis Units Market Trends – Industry Forecast 2025 to 2035
Spinal Stenosis Market – Growth & Demand 2025 to 2035
The Spinal Fusion Market is segmented by Product, Procedure and End User from 2025 to 2035
Spinal Imaging Market Trends – Growth, Demand & Forecast 2022-2032
Spinal Motion-Preservation Devices Market
Spinal Thoracolumbar Implants Market
China Spinal Fusion Market Analysis - Trends, Demand & Forecast 2025 to 2035
Dynamic Spinal Tethering Systems Market Size and Share Forecast Outlook 2025 to 2035
Robotic Spinal Surgery Market
Disposable Spinal Instruments Market Analysis - Size, Share, and Forecast 2025 to 2035
Non-Fusion Spinal Devices Market Growth - Trends & Forecast 2025 to 2035
Injectable Anti-Wrinkle Treatment Market Size and Share Forecast Outlook 2025 to 2035
Injectable Thyroid Drug Market Size and Share Forecast Outlook 2025 to 2035
Injectable Nanomedicines Market Size and Share Forecast Outlook 2025 to 2035
Injectable Liquid Filling Machines Market Size and Share Forecast Outlook 2025 to 2035

Thank you!
You will receive an email from our Business Development Manager. Please be sure to check your SPAM/JUNK folder too.
Chat With
MaRIA