Spice Oils and Oleoresins Market Size and Share Forecast Outlook 2025 to 2035

The global spice oils and oleoresins market is projected to grow from USD 35.9 billion in 2025 to approximately USD 76.9 billion by 2035, recording an absolute increase of USD 41 billion over the forecast period. This translates into a total growth of 114%, with the market forecast to expand at a compound annual growth rate (CAGR) of 7.9% between 2025 and 2035. The overall market size is expected to grow by nearly 2.14X during the same period, supported by increasing demand for natural flavor ingredients, rising health consciousness driving clean-label product adoption, and growing applications across food processing, nutraceutical, and personal care industries.
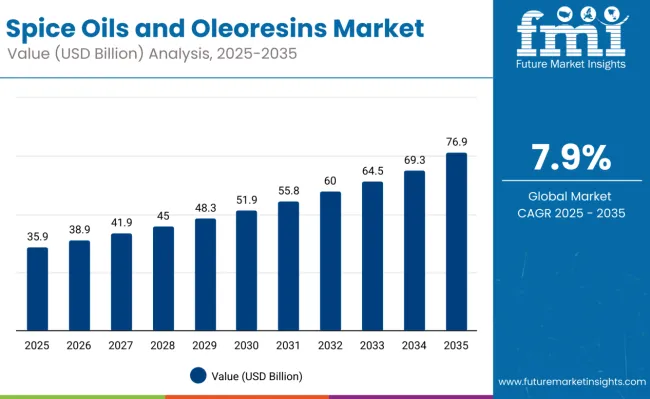
Quick Stats for Spice Oils and Oleoresins Market

  • Spice Oils and Oleoresins Market Value (2025): USD 35.9 billion
  • Spice Oils and Oleoresins Market Forecast Value (2035): USD 76.9 billion
  • Spice Oils and Oleoresins Market Forecast CAGR: 7.9%
  • Leading Segment in Spice Oils and Oleoresins Market: Oleoresins (57.0%)
  • Key Growth Regions in Spice Oils and Oleoresins Market: Asia Pacific, North America, and Europe
  • Top Key Players in Spice Oils and Oleoresins Market: Synthite Industries Ltd., Young Living Essential Oils Ltd., Symrise AG, Givaudan AG, McCormick & Company

Spice Oils And Oleoresins Market Value Analysis

Spice Oils and Oleoresins Market Key Takeaways

Metric Value
Estimated Value in (2025E) USD 35.9 billion
Forecast Value in (2035F) USD 76.9 billion
Forecast CAGR (2025 to 2035) 7.9%

Between 2020 and 2025, the spice oils and oleoresins market experienced robust expansion driven by increasing health consciousness, growing demand for natural flavoring alternatives, and rising applications in pharmaceutical and cosmetic formulations. The market benefited from technological advances in extraction processes and expanded regulatory approvals for natural ingredient applications. Food manufacturers increasingly adopted spice oils and oleoresins as replacements for synthetic additives to meet consumer preferences for clean-label products.

Between 2025 and 2030, the spice oils and oleoresins market is projected to expand from USD 35.9 billion to USD 55 billion, resulting in a value increase of USD 19 billion, which represents 46% of the total forecast growth for the decade. This phase of growth will be shaped by increasing consumer preference for natural and organic ingredients, expanding applications in dietary supplements and functional foods, and growing adoption of clean-label formulations. Manufacturers are focusing on developing advanced extraction technologies and sustainable sourcing practices to enhance product quality and environmental compatibility.

From 2030 to 2035, the market is forecast to grow from USD 55 billion to USD 76.9 billion, adding another USD 22.2 billion, which constitutes 54.1% of the overall ten-year expansion. This period is expected to be characterized by widespread adoption in nutraceutical applications, expansion of organic and premium product segments, and development of specialized formulations for emerging markets. The growing emphasis on health and wellness will drive demand for functional spice extracts with proven bioactive properties and therapeutic benefits.

Why is the Spice Oils and Oleoresins Market Growing?

Market expansion is being supported by the increasing global consumer preference for natural and clean-label food products, driving manufacturers to replace synthetic additives with natural spice-derived ingredients that provide authentic flavors and functional benefits. Modern food processing industries require concentrated flavor solutions that maintain consistency, extend shelf-life, and provide cost-effective alternatives to whole spices while meeting regulatory requirements for natural ingredient labeling. The rising awareness of health benefits associated with bioactive compounds in spices has created substantial market opportunities for functional food and nutraceutical applications.

The growing adoption of spice oils and oleoresins across pharmaceutical, cosmetic, and personal care industries is expanding market applications beyond traditional food uses into therapeutic and wellness product categories. Healthcare and wellness sectors require standardized, concentrated extracts that provide consistent potency and bioavailability for therapeutic applications while meeting stringent quality and purity standards. The development of advanced extraction technologies has improved product quality, yield efficiency, and environmental sustainability while enabling new applications in emerging market segments.

Segmental Analysis

The market is segmented by product type, distribution channel, nature, application, and region. By product type, the market is divided into spice oils and oleoresins. In terms of distribution channel, the market is bifurcated into B2B/direct and B2C/indirect. By nature, the market is categorized into organic and conventional. In terms of application, the market is segmented into food and beverages, bakery and confectionery, beverages, dressings and condiments, cosmetics and personal care, pharmaceuticals, dietary supplements, and others including processed meat products, ready-to-eat meals, savory snacks, and canned foods. Regionally, the market is divided into North America, Latin America, Europe, Asia Pacific, and Middle East & Africa.
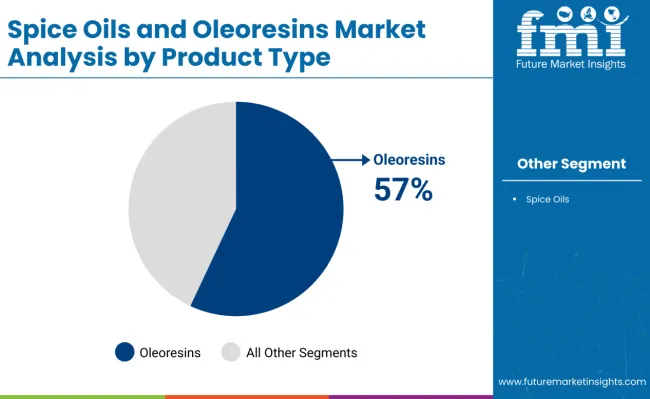
By Product Type, Oleoresins Segment Accounts for 57% Market Share

Spice Oils And Oleoresins Market By Product Type

Oleoresins are projected to account for 57% of the spice oils and oleoresins market in 2025. This leading share is supported by superior concentration levels, extended shelf-life characteristics, and excellent solubility properties that make them ideal for industrial food processing applications. Oleoresins provide 5-20 times the flavor intensity of corresponding whole spices while offering better stability and handling convenience for large-scale manufacturing operations. The segment benefits from growing demand in processed foods, beverages, and nutraceutical applications where consistent flavor delivery and extended product shelf-life are critical requirements.
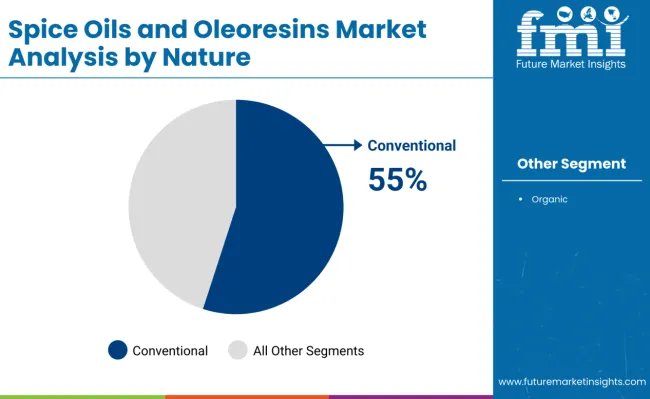
By Nature, Conventional Segment Accounts for 55% Market Share

Spice Oils And Oleoresins Market By Nature

Conventional spice oils and oleoresins are expected to represent 55% of market demand in 2025. This dominant share reflects cost advantages, widespread availability, and established supply chains that support large-scale food processing and manufacturing operations. Conventional products provide reliable quality and performance characteristics while maintaining competitive pricing for price-sensitive applications. The segment benefits from extensive cultivation networks and processing infrastructure that ensure consistent supply availability across diverse geographic markets.

What are the Drivers, Restraints, and Key Trends of the Spice Oils and Oleoresins Market?

The spice oils and oleoresins market is advancing rapidly due to increasing consumer preference for natural ingredients and growing regulatory support for clean-label food formulations. However, the market faces challenges including raw material price volatility, seasonal availability constraints, and complex supply chain requirements for maintaining product quality and traceability. Climate variability affecting spice crop yields and evolving regulatory standards for organic certification continue to influence market development patterns.

Clean-Label Trend Drives Natural Ingredient Adoption

The increasing consumer demand for recognizable, natural ingredients is driving widespread adoption of spice oils and oleoresins as replacements for synthetic flavorings, colorings, and preservatives across food and beverage applications. Regulatory agencies supporting natural ingredient usage and health claim validations are creating favorable market conditions while consumer education about synthetic additive risks builds awareness of natural alternatives. Food manufacturers require authentic flavor solutions that maintain product quality while meeting clean-label requirements and consumer expectations for ingredient transparency.

Advanced Extraction Technologies Enable Product Innovation

The development of supercritical CO2 extraction, solvent-free processing, and other advanced technologies is improving product quality, yield efficiency, and environmental sustainability while enabling new applications in premium market segments. Innovative extraction methods preserve bioactive compounds and enhance product purity while reducing processing costs and environmental impact. Technology advancement enables standardization of extract potency and consistency while supporting development of specialized formulations for targeted health applications and regulatory compliance requirements.
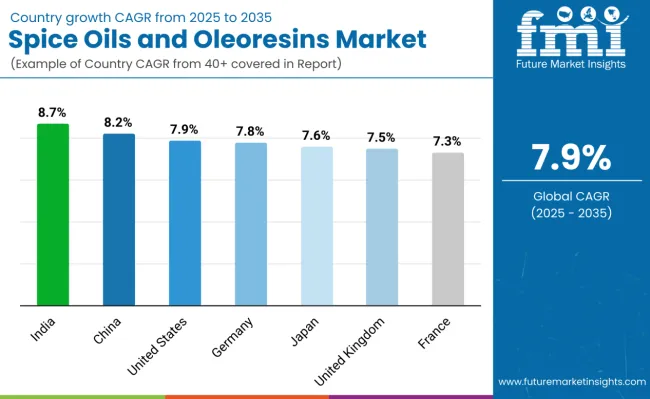
Analysis of Spice Oils and Oleoresins Market by Key Country

Spice Oils And Oleoresins Market By Country

Country CAGR (2025 to 2035)
India 8.7%
United States 7.9%
Germany 7.8%
Japan 7.6%
United Kingdom 7.5%
France 7.3%
China 8.2%

The spice oils and oleoresins market demonstrates diverse growth patterns across key countries, with India leading at 8.7% CAGR through 2035, driven by expanding production capabilities, growing domestic consumption, and increasing export opportunities. China follows at 8.2%, supported by large-scale manufacturing development and rising health-conscious consumer trends. The United States shows robust expansion at 7.9%, emphasizing premium applications and clean-label product innovation. Germany maintains strong growth at 7.8%, leveraging advanced processing technologies and quality standards. Japan records 7.6% growth with focus on functional applications and aging demographics. The United Kingdom demonstrates 7.5% expansion, driven by natural ingredient preferences and regulatory support. France shows 7.3% growth, emphasizing artisanal and organic product development.

The report covers an in-depth analysis of 40+ countries; seven top-performing countries are highlighted below

India Leads Global Growth with Production Excellence

Revenue from spice oils and oleoresins in India is projected to exhibit the highest growth rate with a CAGR of 8.7% through 2035, driven by the country's position as the world's largest spice producer and processor, combined with expanding domestic consumption and growing export capabilities. India's abundant raw material availability, traditional processing expertise, and competitive manufacturing costs provide substantial advantages in global markets. Government initiatives supporting spice industry development, export promotion programs, and quality improvement initiatives are facilitating market expansion.

  • Expanding processing infrastructure and adoption of advanced extraction technologies are improving product quality and yield efficiency while enabling development of premium organic and specialty products that meet international market requirements and certification standards.
  • Growing export opportunities and increasing global recognition of Indian spice quality are driving investment in quality assurance systems, traceability programs, and sustainable sourcing practices that enhance market competitiveness and customer confidence in international markets.

China Demonstrates Strong Expansion with Manufacturing Development

Revenue from spice oils and oleoresins in China is projected to grow at a CAGR of 8.2%, supported by rapid industrialization of food processing, expanding health consciousness among urban consumers, and government support for agricultural modernization and food safety initiatives. The country's large domestic market and growing middle-class purchasing power create substantial demand for natural flavor ingredients and functional food products. Increasing adoption of Western dietary patterns and processed food consumption drives market growth while expanding pharmaceutical and cosmetic industries create new application opportunities.

  • Large-scale manufacturing capabilities and investment in processing technology are enabling cost-competitive production while improving product quality and consistency to meet both domestic and export market requirements for natural ingredient applications.
  • Rising health consciousness and government nutrition programs promoting natural ingredients are driving consumer demand for spice-based health products while creating opportunities for premium organic and functional product development in urban markets.

United States Emphasizes Premium Innovation and Clean-Label Applications

Demand for spice oils and oleoresins in the United States is projected to grow at a CAGR of 7.9%, supported by strong consumer preference for natural and organic ingredients, advanced food processing industries, and comprehensive regulatory frameworks supporting clean-label formulations. The country's sophisticated consumer base demonstrates willingness to pay premium prices for high-quality natural products while established distribution channels provide market access for specialty applications. Growing dietary supplement markets and functional food categories create opportunities for spice-derived bioactive compounds with proven health benefits.

  • Advanced research capabilities and innovation in extraction technologies are supporting development of specialized products for pharmaceutical, nutraceutical, and cosmetic applications while maintaining leadership in product quality and regulatory compliance standards.
  • Consumer education about health benefits of natural spice compounds and growing awareness of synthetic additive risks are driving market demand while supporting premium positioning for organic and sustainably sourced products across diverse application segments.

Germany Maintains Growth with Technology and Quality Leadership

Revenue from spice oils and oleoresins in Germany is projected to expand at a CAGR of 7.8%, driven by advanced processing technologies, stringent quality standards, and strong emphasis on sustainable and organic product development. The country's leadership in food technology innovation and comprehensive regulatory frameworks create demand for premium natural ingredients that meet environmental and safety requirements. German consumers demonstrate strong preference for organic and sustainably produced products while industrial applications require high-quality, consistent ingredients for export-oriented food manufacturing.

  • Advanced extraction technology development and comprehensive quality control systems are supporting innovation in premium product formulations while maintaining competitive advantages in high-value application segments including pharmaceuticals and cosmetics.
  • Strong environmental regulations and consumer preferences for sustainable products are driving development of organic and eco-friendly extraction processes while supporting market positioning for premium applications that emphasize quality and environmental responsibility.

Japan Focuses on Functional Applications and Aging Demographics

Revenue from spice oils and oleoresins in Japan is projected to grow at a CAGR of 7.6%, supported by aging demographics seeking natural health solutions, sophisticated consumer understanding of functional ingredients, and established preferences for high-quality natural products. The country's advanced food technology capabilities and emphasis on health and wellness create demand for spice extracts with proven bioactive properties and therapeutic benefits. Japanese consumers demonstrate strong willingness to pay premium prices for products with scientific validation and superior quality characteristics.

  • Advanced research capabilities and collaboration between industry and academic institutions are driving innovation in functional applications while developing specialized products that address specific health concerns of aging populations including cognitive health and immune support.
  • Sophisticated consumer preferences and emphasis on product quality and authenticity are creating market opportunities for premium spice extracts with traditional processing methods and traceable sourcing while supporting development of specialized applications for health and wellness markets.

United Kingdom Drives Natural Ingredient Adoption

Revenue from spice oils and oleoresins in the United Kingdom is projected to expand at a CAGR of 7.5%, driven by increasing consumer preference for natural and clean-label products, comprehensive regulatory support for organic ingredients, and growing awareness of health benefits associated with natural spice compounds. The country's diverse multicultural population creates demand for authentic ethnic flavors while established organic food markets provide opportunities for premium product positioning. Food safety regulations and consumer protection standards favor natural ingredients over synthetic alternatives.

  • Advanced food processing industries and established supply chain relationships are supporting adoption of natural spice extracts while regulatory frameworks promoting ingredient transparency create favorable conditions for clean-label product development across food and beverage categories.
  • Consumer education about synthetic additive risks and growing preference for sustainable and ethically sourced products are driving market demand while supporting premium positioning for organic and fairly traded spice extracts that meet social responsibility requirements.

France Emphasizes Artisanal and Organic Development

Revenue from spice oils and oleoresins in France is projected to grow at a CAGR of 7.3%, supported by the country's culinary heritage emphasizing natural flavors, strong organic food markets, and comprehensive regulatory frameworks promoting sustainable agriculture and natural ingredient usage. French consumers demonstrate strong preference for authentic, artisanal products while established gourmet food industries create demand for premium spice extracts with superior flavor profiles and traceability. Growing export markets for French specialty foods drive demand for high-quality natural ingredients.
  • Emphasis on traditional processing methods and artisanal quality standards is supporting development of premium product segments while maintaining competitive advantages in high-value applications that emphasize authenticity and traditional flavor profiles.
  • Strong organic farming sector development and government support for sustainable agriculture practices are creating opportunities for organic spice extract production while building consumer confidence through comprehensive certification and traceability programs that ensure product quality and environmental responsibility.

Europe Market Split by Country

Europe Spice Oils And Oleoresins Market

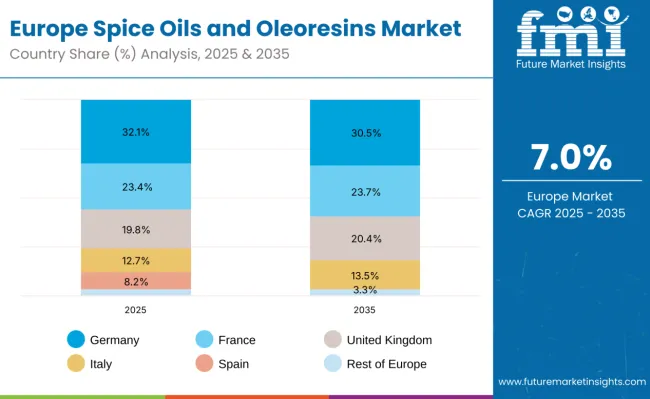
The spice oils and oleoresins market in Europe is projected to grow at a CAGR of 7.0% from 2025 to 2035, driven by rising demand for natural flavoring agents in food, beverages, and nutraceutical applications. Germany is expected to lead with a 32.1% share in 2025, moderating slightly to 30.5% by 2035, supported by its robust flavoring and food processing industries.

France follows with 23.4% in 2025, rising marginally to 23.7% by 2035, reflecting strong consumer preference for natural and clean-label products. The United Kingdom holds 19.8% in 2025, projected to grow to 20.4% by 2035, supported by diversified applications across foodservice and nutraceutical industries. Italy commands 12.7%, expanding to 13.5% by 2035, while Spain contributes 8.2% in 2025, increasing slightly to 8.6% by 2035. The Rest of Europe accounts for 3.8% in 2025, expected to contract to 3.3% by 2035, as larger Western European markets consolidate their dominance in the regional supply chain.
Competitive Landscape of Spice Oils and Oleoresins Market

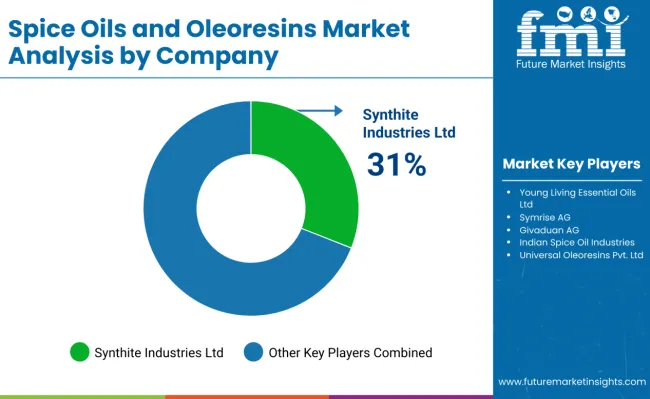
Spice Oils And Oleoresins Market By Company

The spice oils and oleoresins market is characterized by competition among multinational flavor companies, specialized extraction processors, and regional spice suppliers. Companies are investing in advanced extraction technologies, sustainable sourcing practices, organic certification programs, and quality assurance systems to deliver high-quality, consistent, and environmentally responsible natural ingredient solutions. Strategic partnerships, vertical integration, and geographic expansion are central to strengthening supply chains and market presence.

Synthite Industries Ltd., India, provides comprehensive spice extract solutions with focus on sustainable sourcing, advanced processing technologies, and global market leadership across food, pharmaceutical, and cosmetic applications. Young Living Essential Oils Ltd., United States, offers premium essential oil products with emphasis on quality assurance, therapeutic applications, and direct-to-consumer marketing strategies. Symrise AG, Germany, delivers integrated flavor and fragrance solutions including natural spice extracts for industrial applications.

Givaudan AG, Switzerland, emphasizes innovation in natural flavor creation and sustainable ingredient sourcing with focus on premium applications and technical support services. McCormick & Company, United States, leverages extensive spice expertise and global supply chain capabilities to provide integrated flavor solutions across diverse market segments. Other key players including Indian Spice Oil Industries, Universal Oleoresins, and Greenleaf Extractions provide specialized regional expertise and customized solutions across diverse application categories.

Global Spice Oils & Oleoresins Market - Stakeholder Contribution Framework

The spice oils & oleoresins market intersects flavor & fragrance innovation, natural product demand, and sustainable agriculture. Rising consumer preference for clean-label foods, premium culinary experiences, and natural additives make spice-derived oils & oleoresins increasingly important. Scaling this market requires collaboration among governments, industry bodies, manufacturers/OEMs, suppliers, and investors. Together, they can move spice oils & oleoresins from niche flavoring agents to mainstream ingredients in foods, cosmetics, nutraceuticals, and perfumery.

How Governments Could Spur Local Production and Adoption?

  • Regulatory Clarity & Harmonization: Clarify definitions of “natural oils,” “oleoresins,” food-grade vs. fragrance-grade, allowable solvent residues, and harmonize maximum residue limits (MRLs) across key importing markets (EU, USA, Japan).
  • Agricultural Subsidies & MSPs: Incentivize spice farmers (e.g., pepper, turmeric, ginger, cardamom) to cultivate for oil/oleoresin extraction via MSPs or premiums, especially for high-value spice varieties.
  • Processing Infrastructure Support: Fund extraction & distillation facilities, shared cold-press / solvent extraction plants, and drying/curing facilities to ensure raw material quality and reduce losses.
  • Export Facilitation & Trade Policy: Offer export incentives, streamline phytosanitary certification, and reduce tariffs/harmonize trade rules for natural flavor and fragrance raw materials.
  • Standards & Safety Oversight: Ensure chemical safety (solvent residues, pesticide residues, contaminants), labeling regulations, and support for organic/spice origin certifications to build global trust.

How Industry Bodies Could Support Market Development?

  • Quality Standards & Testing Protocols: Create and propagate standard methods for assessing purity, assay of active compounds, aroma/flavor profiles, solvent residues, moisture content, and stability under heat/light.
  • Certification Schemes: Promote certifications (organic, Fairtrade, non-GMO, clean-label, sustainable sourcing) specifically for spice oil / oleoresin supply chains.
  • Research & Knowledge Sharing: Facilitate R&D on novel extraction technologies (supercritical CO₂, cold-press, green solvents), refining aroma consistency, encapsulation, and shelf-life.
  • Branding & Market Positioning: Position spice oils/oleoresins as premium, natural, high-impact flavor/aroma ingredients; educate consumers/brands about their advantages over synthetic flavoring.
  • Trade & Market Access Facilitation: Industry bodies can organize trade shows, buyer-supplier matchmaking, and training to help small producers reach international buyers in food, cosmetics, and perfumery sectors.

How Manufacturers / OEMs / Food-Tech Players Could Strengthen the Ecosystem?

  • Product Innovation & Diversification: Develop more refined / fractionated oleoresins (e.g., specific pungency, aroma segments), differentiated oils (cold-pressed, steam-distilled), and flavored blends or encapsulated versions for convenience.
  • Formulation Support: Work with downstream users (food & beverage, sauces, cosmetics) to develop stable flavor systems (resistant to heat, light, oxygen) and help in adapting oleoresins into various product matrices.
  • Scalable, Green Extraction Technologies: Adopt sustainable extraction and distillation methods (e.g., green solvents, CO₂ extraction, membrane separation) to reduce environmental impact and improve yield.
  • Supply Chain Integration: Build upstream linkages with spice growers/cooperatives to ensure consistent raw input quality (correct variety, post-harvest handling, drying).
  • Packaging & Stability Solutions: Offer packaging innovations (e.g. light/oxygen barrier, inert atmospheres) to preserve volatile compounds during transport/storage.

How Suppliers Could Navigate the Shift?

  • Raw Material Quality & Traceability: Assist spice producers in best post-harvest practices (drying, curing, storage) to reduce degradation of essential oils; maintain traceability to origins for labeling and certification.
  • Tailored Product Portfolios: Supply both broad-spectrum oleoresins and narrow/fractionated flavor/aroma constituents; custom oil blends catering to specific heat, pH, or flavor profile requirements.
  • R&D into Stability & Efficacy: Work on microencapsulation, encapsulated versions, controlled release flavor/aroma, stability under processing/storage, masking unwanted off-notes.
  • Sustainability & Ethical Sourcing: Implement sustainable farming, fair trade / payments to farmers; reduce environmental footprint in extraction operations (waste solvent recovery, energy efficiency).
  • Scale & Logistics: Build logistics capability for handling volatile/oily products safely (temperature control, inert gas packaging), ensure efficient export readiness (compliance with customs, phytosanitary, and residue standards).

How Investors and Financial Enablers Could Unlock Value?

  • Fund Extraction & Processing Infrastructure: Provide capital for modern extraction plants, solvent recovery systems, fractional distillation, and downstream refining to enable higher margins and greater quality.
  • Support SMEs & Cooperative Models: Give growth capital or concessional financing for small-to-mid sized oleoresin producers/cooperatives to upgrade facilities, secure better supply chains, and reach international markets.
  • Technology & Innovation Investment: Back innovations in green extraction, fractionation, bio-engineering (enzyme or microbial derivation of flavor compounds), and encapsulation technologies.
  • ESG and Sustainability Investment: Invest in projects with sustainable farming, reduced chemical use, traceable origins, and low environmental impact extraction to meet growing buyer demand for sustainable natural ingredients.
  • M&A & Strategic Partnerships: Encourage consolidation of fragmented suppliers/manufacturers, strategic alliances between spice farmers, processors, and global flavor houses to streamline supply and maximize value capture.

Key Players in the Spice Oils and Oleoresins Market

  • Synthite Industries Ltd.
  • Young Living Essential Oils Ltd.
  • Symrise AG
  • Givaudan AG
  • McCormick & Company
  • Reckitt Benckiser Group Plc
  • Indian Spice Oil Industries
  • Universal Oleoresins Pvt. Ltd.
  • Greenleaf Extractions Pvt. Ltd.
  • Kalsec Inc.

Scope of the Report

Items Values
Quantitative Units (2025) USD 35.9 Billion
Product Type Spice Oils, Oleoresins
Distribution Channel B2B/Direct and B2C/Indirect
Nature Organic, Conventional
Application Food & Beverages, Bakery & Confectionery, Beverages, Dressings & Condiments, Cosmetics and Personal Care, Pharmaceuticals, Dietary Supplements, Others
Regions Covered North America, Latin America, Europe, Asia Pacific, Middle East & Africa
Countries Covered United States, Canada, United Kingdom, Germany, France, China, Japan, South Korea, India, Brazil, Australia and 40+ countries
Key Companies Profiled Synthite Industries Ltd., Young Living Essential Oils Ltd., Symrise AG, Givaudan AG, McCormick & Company, Reckitt Benckiser Group Plc, Indian Spice Oil Industries, Universal Oleoresins Pvt. Ltd., Greenleaf Extractions Pvt. Ltd., Kalsec Inc.
Additional Attributes Dollar sales by type/nature/application, regional demand (NA, Europe, APAC), competition (established vs emerging), consumer preference (organic vs conventional), clean-label/functional integration, extraction/sourcing innovations, and certification/traceability adoption for premium/export markets

Spice Oils and Oleoresins Market by Segments

Product Type:

  • Spice Oils
  • Oleoresins

Distribution Channel:

  • B2B/Direct
  • B2C/Indirect

Nature:

  • Organic
  • Conventional

Application:

  • Food & Beverages
  • Bakery & Confectionery
  • Beverages
  • Dressings & Condiments
  • Cosmetics and Personal Care
  • Pharmaceuticals
  • Dietary Supplements
  • Others

Region:

  • North America
    • United States
    • Canada
    • Mexico
  • Latin America
    • Brazil
    • Argentina
    • Rest of Latin America
  • Europe
    • Germany
    • United Kingdom
    • France
    • Italy
    • Spain
    • Netherlands
    • Rest of Europe
  • Asia Pacific
    • India
    • China
    • Japan
    • South Korea
    • Australia
    • Rest of Asia Pacific
  • Middle East & Africa
    • Saudi Arabia
    • UAE
    • South Africa
    • Rest of Middle East & Africa

Table of Content

  • 1. Executive Summary
  • 2. Market Overview
  • 3. Market Background
  • 4. Global Market Analysis 2020 to 2024 and Forecast, 2025 to 2035
  • 5. Global Market Analysis 2020 to 2024 and Forecast 2025 to 2035, By Product Type
    • 5.1. Spice Oils
    • 5.2. Oleoresins
  • 6. Global Market Analysis 2020 to 2024 and Forecast 2025 to 2035, By Nature
    • 6.1. Organic
    • 6.2. Conventional
  • 7. Global Market Analysis 2020 to 2024 and Forecast 2025 to 2035, By Application
    • 7.1. Food & Beverages
    • 7.2. Bakery & Confectionery
    • 7.3. Beverages
    • 7.4. Dressings & Condiments
    • 7.5. Cosmetics and Personal Care
    • 7.6. Pharmaceuticals
    • 7.7. Dietary Supplements
    • 7.8. Others
  • 8. Global Market Analysis 2020 to 2024 and Forecast 2025 to 2035, By Region
    • 8.1. North America
    • 8.2. Latin America
    • 8.3. Europe
    • 8.4. Asia Pacific
    • 8.5. MEA
  • 9. North America Market Analysis 2020 to 2024 and Forecast 2025 to 2035, By Country
  • 10. Latin America Market Analysis 2020 to 2024 and Forecast 2025 to 2035, By Country
  • 11. Europe Market Analysis 2020 to 2024 and Forecast 2025 to 2035, By Country
  • 12. Asia Pacific Market Analysis 2020 to 2024 and Forecast 2025 to 2035, By Country
  • 13. MEA Market Analysis 2020 to 2024 and Forecast 2025 to 2035, By Country
  • 14. Key Countries Market Analysis
  • 15. Market Structure Analysis
  • 16. Competition Analysis
    • 16.1. Young Living Essential Oils Ltd.
    • 16.2. Reckitt Benckiser Group Plc
    • 16.3. Symrise AG
    • 16.4. Givaduan AG
    • 16.5. Greenleaf Extractions Pvt. Ltd.
    • 16.6. Indian Spice Oil Industries
    • 16.7. Synthite Industries Ltd.
    • 16.8. Universal Oleoresins Pvt. Ltd.
    • 16.9. Chenguang Biotech Group Co. Ltd.
    • 16.10. Kancor Ingredients Ltd.
    • 16.11. Kalsec Inc.
  • 17. Assumptions & Acronyms Used
  • 18. Research Methodology

List of Tables

  • Table 1: Global Market Value (USD Billion) Forecast by Region, 2020-2035
  • Table 2: Global Market Volume (Units) Forecast by Region, 2020-2035
  • Table 3: Global Market Value (USD Billion) Forecast by Product Type, 2020-2035
  • Table 4: Global Market Volume (Units) Forecast by Product Type, 2020-2035
  • Table 5: Global Market Value (USD Billion) Forecast by Distribution Channel, 2020-2035
  • Table 6: Global Market Volume (Units) Forecast by Distribution Channel, 2020-2035
  • Table 7: Global Market Value (USD Billion) Forecast by Nature, 2020-2035
  • Table 8: Global Market Volume (Units) Forecast by Nature, 2020-2035
  • Table 9: Global Market Value (USD Billion) Forecast by Application, 2020-2035
  • Table 10: Global Market Volume (Units) Forecast by Application, 2020-2035
  • Table 11: North America Market Value (USD Billion) Forecast by Country, 2020-2035
  • Table 12: North America Market Volume (Units) Forecast by Country, 2020-2035
  • Table 13: North America Market Value (USD Billion) Forecast by Product Type, 2020-2035
  • Table 14: North America Market Volume (Units) Forecast by Product Type, 2020-2035
  • Table 15: North America Market Value (USD Billion) Forecast by Distribution Channel, 2020-2035
  • Table 16: North America Market Volume (Units) Forecast by Distribution Channel, 2020-2035
  • Table 17: North America Market Value (USD Billion) Forecast by Nature, 2020-2035
  • Table 18: North America Market Volume (Units) Forecast by Nature, 2020-2035
  • Table 19: North America Market Value (USD Billion) Forecast by Application, 2020-2035
  • Table 20: North America Market Volume (Units) Forecast by Application, 2020-2035
  • Table 21: Latin America Market Value (USD Billion) Forecast by Country, 2020-2035
  • Table 22: Latin America Market Volume (Units) Forecast by Country, 2020-2035
  • Table 23: Latin America Market Value (USD Billion) Forecast by Product Type, 2020-2035
  • Table 24: Latin America Market Volume (Units) Forecast by Product Type, 2020-2035
  • Table 25: Latin America Market Value (USD Billion) Forecast by Distribution Channel, 2020-2035
  • Table 26: Latin America Market Volume (Units) Forecast by Distribution Channel, 2020-2035
  • Table 27: Latin America Market Value (USD Billion) Forecast by Nature, 2020-2035
  • Table 28: Latin America Market Volume (Units) Forecast by Nature, 2020-2035
  • Table 29: Latin America Market Value (USD Billion) Forecast by Application, 2020-2035
  • Table 30: Latin America Market Volume (Units) Forecast by Application, 2020-2035
  • Table 31: Europe Market Value (USD Billion) Forecast by Country, 2020-2035
  • Table 32: Europe Market Volume (Units) Forecast by Country, 2020-2035
  • Table 33: Europe Market Value (USD Billion) Forecast by Product Type, 2020-2035
  • Table 34: Europe Market Volume (Units) Forecast by Product Type, 2020-2035
  • Table 35: Europe Market Value (USD Billion) Forecast by Distribution Channel, 2020-2035
  • Table 36: Europe Market Volume (Units) Forecast by Distribution Channel, 2020-2035
  • Table 37: Europe Market Value (USD Billion) Forecast by Nature, 2020-2035
  • Table 38: Europe Market Volume (Units) Forecast by Nature, 2020-2035
  • Table 39: Europe Market Value (USD Billion) Forecast by Application, 2020-2035
  • Table 40: Europe Market Volume (Units) Forecast by Application, 2020-2035
  • Table 41: Asia Pacific Market Value (USD Billion) Forecast by Country, 2020-2035
  • Table 42: Asia Pacific Market Volume (Units) Forecast by Country, 2020-2035
  • Table 43: Asia Pacific Market Value (USD Billion) Forecast by Product Type, 2020-2035
  • Table 44: Asia Pacific Market Volume (Units) Forecast by Product Type, 2020-2035
  • Table 45: Asia Pacific Market Value (USD Billion) Forecast by Distribution Channel, 2020-2035
  • Table 46: Asia Pacific Market Volume (Units) Forecast by Distribution Channel, 2020-2035
  • Table 47: Asia Pacific Market Value (USD Billion) Forecast by Nature, 2020-2035
  • Table 48: Asia Pacific Market Volume (Units) Forecast by Nature, 2020-2035
  • Table 49: Asia Pacific Market Value (USD Billion) Forecast by Application, 2020-2035
  • Table 50: Asia Pacific Market Volume (Units) Forecast by Application, 2020-2035
  • Table 51: Middle East & Africa Market Value (USD Billion) Forecast by Country, 2020-2035
  • Table 52: Middle East & Africa Market Volume (Units) Forecast by Country, 2020-2035
  • Table 53: Middle East & Africa Market Value (USD Billion) Forecast by Product Type, 2020-2035
  • Table 54: Middle East & Africa Market Volume (Units) Forecast by Product Type, 2020-2035
  • Table 55: Middle East & Africa Market Value (USD Billion) Forecast by Distribution Channel, 2020-2035
  • Table 56: Middle East & Africa Market Volume (Units) Forecast by Distribution Channel, 2020-2035
  • Table 57: Middle East & Africa Market Value (USD Billion) Forecast by Nature, 2020-2035
  • Table 58: Middle East & Africa Market Volume (Units) Forecast by Nature, 2020-2035
  • Table 59: Middle East & Africa Market Value (USD Billion) Forecast by Application, 2020-2035
  • Table 60: Middle East & Africa Market Volume (Units) Forecast by Application, 2020-2035
  • Table 61: Global Market Pricing Analysis by Product Type, 2020-2035
  • Table 62: Global Market Y-o-Y Growth Projections by Region, 2020-2035
  • Table 63: Global Market BPS Analysis by Product Type, 2025-2035
  • Table 64: Global Market Share Analysis by Distribution Channel, 2020-2035
  • Table 65: Global Market Absolute Dollar Opportunity by Nature, 2025-2035
  • Table 66: United States Market Value (USD Billion) by Product Type, 2020-2035
  • Table 67: United States Market Volume (Units) by Product Type, 2020-2035
  • Table 68: United States Market Value (USD Billion) by Application, 2020-2035
  • Table 69: United States Market Volume (Units) by Application, 2020-2035
  • Table 70: Canada Market Value (USD Billion) by Product Type, 2020-2035
  • Table 71: Canada Market Volume (Units) by Product Type, 2020-2035
  • Table 72: Mexico Market Value (USD Billion) by Product Type, 2020-2035
  • Table 73: Mexico Market Volume (Units) by Product Type, 2020-2035
  • Table 74: Brazil Market Value (USD Billion) by Product Type, 2020-2035
  • Table 75: Brazil Market Volume (Units) by Product Type, 2020-2035
  • Table 76: Argentina Market Value (USD Billion) by Product Type, 2020-2035
  • Table 77: Argentina Market Volume (Units) by Product Type, 2020-2035
  • Table 78: Germany Market Value (USD Billion) by Product Type, 2020-2035
  • Table 79: Germany Market Volume (Units) by Product Type, 2020-2035
  • Table 80: United Kingdom Market Value (USD Billion) by Product Type, 2020-2035
  • Table 81: United Kingdom Market Volume (Units) by Product Type, 2020-2035
  • Table 82: France Market Value (USD Billion) by Product Type, 2020-2035
  • Table 83: France Market Volume (Units) by Product Type, 2020-2035
  • Table 84: Italy Market Value (USD Billion) by Product Type, 2020-2035
  • Table 85: Italy Market Volume (Units) by Product Type, 2020-2035
  • Table 86: Spain Market Value (USD Billion) by Product Type, 2020-2035
  • Table 87: Spain Market Volume (Units) by Product Type, 2020-2035
  • Table 88: India Market Value (USD Billion) by Product Type, 2020-2035
  • Table 89: India Market Volume (Units) by Product Type, 2020-2035
  • Table 90: China Market Value (USD Billion) by Product Type, 2020-2035
  • Table 91: China Market Volume (Units) by Product Type, 2020-2035
  • Table 92: Japan Market Value (USD Billion) by Product Type, 2020-2035
  • Table 93: Japan Market Volume (Units) by Product Type, 2020-2035
  • Table 94: South Korea Market Value (USD Billion) by Product Type, 2020-2035
  • Table 95: South Korea Market Volume (Units) by Product Type, 2020-2035
  • Table 96: Australia Market Value (USD Billion) by Product Type, 2020-2035
  • Table 97: Australia Market Volume (Units) by Product Type, 2020-2035
  • Table 98: Saudi Arabia Market Value (USD Billion) by Product Type, 2020-2035
  • Table 99: Saudi Arabia Market Volume (Units) by Product Type, 2020-2035
  • Table 100: UAE Market Value (USD Billion) by Product Type, 2020-2035
  • Table 101: UAE Market Volume (Units) by Product Type, 2020-2035
  • Table 102: South Africa Market Value (USD Billion) by Product Type, 2020-2035
  • Table 103: South Africa Market Volume (Units) by Product Type, 2020-2035
  • Table 104: Global Spice Oils Market Share Analysis by Top 10 Companies, 2024
  • Table 105: Global Oleoresins Market Share Analysis by Top 10 Companies, 2024
  • Table 106: Global Market Competitive Landscape Matrix, 2024
  • Table 107: Global Market New Product Launches by Key Players, 2020-2024
  • Table 108: Global Market M&A Activities by Key Players, 2020-2024
  • Table 109: Global Market Investment Analysis by Region, 2020-2024
  • Table 110: Global Market Supply Chain Analysis by Stage, 2024
  • Table 111: Global Market Raw Material Price Analysis, 2020-2035
  • Table 112: Global Market Cost Structure Analysis by Component, 2024
  • Table 113: Global Market Import-Export Analysis by Region, 2020-2024
  • Table 114: Global Market Trade Balance Analysis by Country, 2020-2024
  • Table 115: Global Market Regulatory Analysis by Region, 2024
  • Table 116: Global Market Quality Standards Analysis by Product Type, 2024
  • Table 117: Global Market Certification Requirements by Application, 2024
  • Table 118: Global Market Technology Analysis by Extraction Method, 2024
  • Table 119: Global Market R&D Investment Analysis by Company, 2020-2024
  • Table 120: Global Market Patent Analysis by Technology, 2020-2024
  • Table 121: Global Market Consumer Preference Analysis by Region, 2024
  • Table 122: Global Market Distribution Channel Performance Analysis, 2024
  • Table 123: Global Market B2B vs B2C Sales Analysis by Region, 2024
  • Table 124: Global Market Online vs Offline Sales Analysis, 2024
  • Table 125: Global Market Seasonal Demand Analysis by Product Type, 2024
  • Table 126: Global Market End-User Industry Analysis by Application, 2024
  • Table 127: Global Market Food & Beverages Segment Analysis by Sub-Application, 2024
  • Table 128: Global Market Cosmetics & Personal Care Segment Analysis, 2024
  • Table 129: Global Market Pharmaceutical Segment Analysis by Therapeutic Area, 2024
  • Table 130: Global Market Organic vs Conventional Demand Analysis, 2024
  • Table 131: Global Market Premium vs Standard Product Analysis, 2024
  • Table 132: Global Market Private Label vs Branded Product Analysis, 2024
  • Table 133: Global Market Sustainability Index by Company, 2024
  • Table 134: Global Market Carbon Footprint Analysis by Product Type, 2024
  • Table 135: Global Market Packaging Analysis by Material Type, 2024
  • Table 136: Global Market Shelf Life Analysis by Product Type, 2024
  • Table 137: Global Market Storage Requirements Analysis, 2024
  • Table 138: Global Market Transportation Cost Analysis by Region, 2024
  • Table 139: Global Market Inventory Management Analysis by Distribution Channel, 2024
  • Table 140: Global Market Customer Satisfaction Analysis by Product Type, 2024
  • Table 141: Global Market Brand Loyalty Analysis by Region, 2024
  • Table 142: Global Market Price Sensitivity Analysis by Application, 2024
  • Table 143: Global Market Innovation Pipeline Analysis by Company, 2025-2030
  • Table 144: Global Market Future Technology Trends Analysis, 2025-2035
  • Table 145: Global Market Emerging Market Opportunities Analysis, 2025-2035
  • Table 146: Global Market Risk Assessment Matrix by Factor, 2024
  • Table 147: Global Market SWOT Analysis by Key Players, 2024
  • Table 148: Global Market Strategic Recommendations by Segment, 2025-2030
  • Table 149: Global Market Investment Opportunities Analysis by Region, 2025-2035
  • Table 150: Global Market Future Growth Scenarios Comparison, 2025-2035

List of Figures

  • Figure 1: Global Market Value (USD Billion) by Product Type, 2025-2035
  • Figure 2: Global Market Value (USD Billion) by Distribution Channel, 2025-2035
  • Figure 3: Global Market Value (USD Billion) by Nature, 2025-2035
  • Figure 4: Global Market Value (USD Billion) by Application, 2025-2035
  • Figure 5: Global Market Value (USD Billion) by Region, 2025-2035
  • Figure 6: Global Market Value (USD Billion) Analysis by Region, 2020-2035
  • Figure 7: Global Market Volume (Units) Analysis by Region, 2020-2035
  • Figure 8: Global Market Value Share (%) and BPS Analysis by Region, 2025-2035
  • Figure 9: Global Market Y-o-Y Growth (%) Projections by Region, 2025-2035
  • Figure 10: Global Market Value (USD Billion) Analysis by Product Type, 2020-2035
  • Figure 11: Global Market Volume (Units) Analysis by Product Type, 2020-2035
  • Figure 12: Global Market Value Share (%) and BPS Analysis by Product Type, 2025-2035
  • Figure 13: Global Market Y-o-Y Growth (%) Projections by Product Type, 2025-2035
  • Figure 14: Global Market Value (USD Billion) Analysis by Distribution Channel, 2020-2035
  • Figure 15: Global Market Volume (Units) Analysis by Distribution Channel, 2020-2035
  • Figure 16: Global Market Value Share (%) and BPS Analysis by Distribution Channel, 2025-2035
  • Figure 17: Global Market Y-o-Y Growth (%) Projections by Distribution Channel, 2025-2035
  • Figure 18: Global Market Value (USD Billion) Analysis by Nature, 2020-2035
  • Figure 19: Global Market Volume (Units) Analysis by Nature, 2020-2035
  • Figure 20: Global Market Value Share (%) and BPS Analysis by Nature, 2025-2035
  • Figure 21: Global Market Y-o-Y Growth (%) Projections by Nature, 2025-2035
  • Figure 22: Global Market Value (USD Billion) Analysis by Application, 2020-2035
  • Figure 23: Global Market Volume (Units) Analysis by Application, 2020-2035
  • Figure 24: Global Market Value Share (%) and BPS Analysis by Application, 2025-2035
  • Figure 25: Global Market Y-o-Y Growth (%) Projections by Application, 2025-2035
  • Figure 26: Global Market Attractiveness by Product Type, 2025-2035
  • Figure 27: Global Market Attractiveness by Distribution Channel, 2025-2035
  • Figure 28: Global Market Attractiveness by Nature, 2025-2035
  • Figure 29: Global Market Attractiveness by Application, 2025-2035
  • Figure 30: Global Market Attractiveness by Region, 2025-2035
  • Figure 31: North America Market Value (USD Billion) by Product Type, 2025-2035
  • Figure 32: North America Market Value (USD Billion) by Distribution Channel, 2025-2035
  • Figure 33: North America Market Value (USD Billion) by Nature, 2025-2035
  • Figure 34: North America Market Value (USD Billion) by Application, 2025-2035
  • Figure 35: North America Market Value (USD Billion) by Country, 2025-2035
  • Figure 36: North America Market Value (USD Billion) Analysis by Country, 2020-2035
  • Figure 37: North America Market Volume (Units) Analysis by Country, 2020-2035
  • Figure 38: North America Market Value Share (%) and BPS Analysis by Country, 2025-2035
  • Figure 39: North America Market Y-o-Y Growth (%) Projections by Country, 2025-2035
  • Figure 40: North America Market Value (USD Billion) Analysis by Product Type, 2020-2035
  • Figure 41: North America Market Volume (Units) Analysis by Product Type, 2020-2035
  • Figure 42: North America Market Value Share (%) and BPS Analysis by Product Type, 2025-2035
  • Figure 43: North America Market Y-o-Y Growth (%) Projections by Product Type, 2025-2035
  • Figure 44: North America Market Value (USD Billion) Analysis by Distribution Channel, 2020-2035
  • Figure 45: North America Market Volume (Units) Analysis by Distribution Channel, 2020-2035
  • Figure 46: North America Market Value Share (%) and BPS Analysis by Distribution Channel, 2025-2035
  • Figure 47: North America Market Y-o-Y Growth (%) Projections by Distribution Channel, 2025-2035
  • Figure 48: North America Market Value (USD Billion) Analysis by Nature, 2020-2035
  • Figure 49: North America Market Volume (Units) Analysis by Nature, 2020-2035
  • Figure 50: North America Market Value Share (%) and BPS Analysis by Nature, 2025-2035
  • Figure 51: North America Market Y-o-Y Growth (%) Projections by Nature, 2025-2035
  • Figure 52: North America Market Value (USD Billion) Analysis by Application, 2020-2035
  • Figure 53: North America Market Volume (Units) Analysis by Application, 2020-2035
  • Figure 54: North America Market Value Share (%) and BPS Analysis by Application, 2025-2035
  • Figure 55: North America Market Y-o-Y Growth (%) Projections by Application, 2025-2035
  • Figure 56: North America Market Attractiveness by Product Type, 2025-2035
  • Figure 57: North America Market Attractiveness by Distribution Channel, 2025-2035
  • Figure 58: North America Market Attractiveness by Nature, 2025-2035
  • Figure 59: North America Market Attractiveness by Application, 2025-2035
  • Figure 60: North America Market Attractiveness by Country, 2025-2035
  • Figure 61: Latin America Market Value (USD Billion) by Product Type, 2025-2035
  • Figure 62: Latin America Market Value (USD Billion) by Distribution Channel, 2025-2035
  • Figure 63: Latin America Market Value (USD Billion) by Nature, 2025-2035
  • Figure 64: Latin America Market Value (USD Billion) by Application, 2025-2035
  • Figure 65: Latin America Market Value (USD Billion) by Country, 2025-2035
  • Figure 66: Latin America Market Value (USD Billion) Analysis by Country, 2020-2035
  • Figure 67: Latin America Market Volume (Units) Analysis by Country, 2020-2035
  • Figure 68: Latin America Market Value Share (%) and BPS Analysis by Country, 2025-2035
  • Figure 69: Latin America Market Y-o-Y Growth (%) Projections by Country, 2025-2035
  • Figure 70: Latin America Market Value (USD Billion) Analysis by Product Type, 2020-2035
  • Figure 71: Latin America Market Volume (Units) Analysis by Product Type, 2020-2035
  • Figure 72: Latin America Market Value Share (%) and BPS Analysis by Product Type, 2025-2035
  • Figure 73: Latin America Market Y-o-Y Growth (%) Projections by Product Type, 2025-2035
  • Figure 74: Latin America Market Value (USD Billion) Analysis by Distribution Channel, 2020-2035
  • Figure 75: Latin America Market Volume (Units) Analysis by Distribution Channel, 2020-2035
  • Figure 76: Latin America Market Value Share (%) and BPS Analysis by Distribution Channel, 2025-2035
  • Figure 77: Latin America Market Y-o-Y Growth (%) Projections by Distribution Channel, 2025-2035
  • Figure 78: Latin America Market Value (USD Billion) Analysis by Nature, 2020-2035
  • Figure 79: Latin America Market Volume (Units) Analysis by Nature, 2020-2035
  • Figure 80: Latin America Market Value Share (%) and BPS Analysis by Nature, 2025-2035
  • Figure 81: Latin America Market Y-o-Y Growth (%) Projections by Nature, 2025-2035
  • Figure 82: Latin America Market Value (USD Billion) Analysis by Application, 2020-2035
  • Figure 83: Latin America Market Volume (Units) Analysis by Application, 2020-2035
  • Figure 84: Latin America Market Value Share (%) and BPS Analysis by Application, 2025-2035
  • Figure 85: Latin America Market Y-o-Y Growth (%) Projections by Application, 2025-2035
  • Figure 86: Latin America Market Attractiveness by Product Type, 2025-2035
  • Figure 87: Latin America Market Attractiveness by Distribution Channel, 2025-2035
  • Figure 88: Latin America Market Attractiveness by Nature, 2025-2035
  • Figure 89: Latin America Market Attractiveness by Application, 2025-2035
  • Figure 90: Latin America Market Attractiveness by Country, 2025-2035
  • Figure 91: Europe Market Value (USD Billion) by Product Type, 2025-2035
  • Figure 92: Europe Market Value (USD Billion) by Distribution Channel, 2025-2035
  • Figure 93: Europe Market Value (USD Billion) by Nature, 2025-2035
  • Figure 94: Europe Market Value (USD Billion) by Application, 2025-2035
  • Figure 95: Europe Market Value (USD Billion) by Country, 2025-2035
  • Figure 96: Europe Market Value (USD Billion) Analysis by Country, 2020-2035
  • Figure 97: Europe Market Volume (Units) Analysis by Country, 2020-2035
  • Figure 98: Europe Market Value Share (%) and BPS Analysis by Country, 2025-2035
  • Figure 99: Europe Market Y-o-Y Growth (%) Projections by Country, 2025-2035
  • Figure 100: Europe Market Value (USD Billion) Analysis by Product Type, 2020-2035
  • Figure 101: Europe Market Volume (Units) Analysis by Product Type, 2020-2035
  • Figure 102: Europe Market Value Share (%) and BPS Analysis by Product Type, 2025-2035
  • Figure 103: Europe Market Y-o-Y Growth (%) Projections by Product Type, 2025-2035
  • Figure 104: Europe Market Value (USD Billion) Analysis by Distribution Channel, 2020-2035
  • Figure 105: Europe Market Volume (Units) Analysis by Distribution Channel, 2020-2035
  • Figure 106: Europe Market Value Share (%) and BPS Analysis by Distribution Channel, 2025-2035
  • Figure 107: Europe Market Y-o-Y Growth (%) Projections by Distribution Channel, 2025-2035
  • Figure 108: Europe Market Value (USD Billion) Analysis by Nature, 2020-2035
  • Figure 109: Europe Market Volume (Units) Analysis by Nature, 2020-2035
  • Figure 110: Europe Market Value Share (%) and BPS Analysis by Nature, 2025-2035
  • Figure 111: Europe Market Y-o-Y Growth (%) Projections by Nature, 2025-2035
  • Figure 112: Europe Market Value (USD Billion) Analysis by Application, 2020-2035
  • Figure 113: Europe Market Volume (Units) Analysis by Application, 2020-2035
  • Figure 114: Europe Market Value Share (%) and BPS Analysis by Application, 2025-2035
  • Figure 115: Europe Market Y-o-Y Growth (%) Projections by Application, 2025-2035
  • Figure 116: Europe Market Attractiveness by Product Type, 2025-2035
  • Figure 117: Europe Market Attractiveness by Distribution Channel, 2025-2035
  • Figure 118: Europe Market Attractiveness by Nature, 2025-2035
  • Figure 119: Europe Market Attractiveness by Application, 2025-2035
  • Figure 120: Europe Market Attractiveness by Country, 2025-2035
  • Figure 121: Asia Pacific Market Value (USD Billion) by Product Type, 2025-2035
  • Figure 122: Asia Pacific Market Value (USD Billion) by Distribution Channel, 2025-2035
  • Figure 123: Asia Pacific Market Value (USD Billion) by Nature, 2025-2035
  • Figure 124: Asia Pacific Market Value (USD Billion) by Application, 2025-2035
  • Figure 125: Asia Pacific Market Value (USD Billion) by Country, 2025-2035
  • Figure 126: Asia Pacific Market Value (USD Billion) Analysis by Country, 2020-2035
  • Figure 127: Asia Pacific Market Volume (Units) Analysis by Country, 2020-2035
  • Figure 128: Asia Pacific Market Value Share (%) and BPS Analysis by Country, 2025-2035
  • Figure 129: Asia Pacific Market Y-o-Y Growth (%) Projections by Country, 2025-2035
  • Figure 130: Asia Pacific Market Value (USD Billion) Analysis by Product Type, 2020-2035
  • Figure 131: Asia Pacific Market Volume (Units) Analysis by Product Type, 2020-2035
  • Figure 132: Asia Pacific Market Value Share (%) and BPS Analysis by Product Type, 2025-2035
  • Figure 133: Asia Pacific Market Y-o-Y Growth (%) Projections by Product Type, 2025-2035
  • Figure 134: Asia Pacific Market Value (USD Billion) Analysis by Distribution Channel, 2020-2035
  • Figure 135: Asia Pacific Market Volume (Units) Analysis by Distribution Channel, 2020-2035
  • Figure 136: Asia Pacific Market Value Share (%) and BPS Analysis by Distribution Channel, 2025-2035
  • Figure 137: Asia Pacific Market Y-o-Y Growth (%) Projections by Distribution Channel, 2025-2035
  • Figure 138: Asia Pacific Market Value (USD Billion) Analysis by Nature, 2020-2035
  • Figure 139: Asia Pacific Market Volume (Units) Analysis by Nature, 2020-2035
  • Figure 140: Asia Pacific Market Value Share (%) and BPS Analysis by Nature, 2025-2035
  • Figure 141: Asia Pacific Market Y-o-Y Growth (%) Projections by Nature, 2025-2035
  • Figure 142: Asia Pacific Market Value (USD Billion) Analysis by Application, 2020-2035
  • Figure 143: Asia Pacific Market Volume (Units) Analysis by Application, 2020-2035
  • Figure 144: Asia Pacific Market Value Share (%) and BPS Analysis by Application, 2025-2035
  • Figure 145: Asia Pacific Market Y-o-Y Growth (%) Projections by Application, 2025-2035
  • Figure 146: Asia Pacific Market Attractiveness by Product Type, 2025-2035
  • Figure 147: Asia Pacific Market Attractiveness by Distribution Channel, 2025-2035
  • Figure 148: Asia Pacific Market Attractiveness by Nature, 2025-2035
  • Figure 149: Asia Pacific Market Attractiveness by Application, 2025-2035
  • Figure 150: Asia Pacific Market Attractiveness by Country, 2025-2035

Frequently Asked Questions

What is the projected size of the spice oils and oleoresins market by 2035?

The global spice oils and oleoresins market is expected to reach USD 76.95 billion by 2035, growing from USD 35.98 billion in 2025, at a CAGR of 7.9% during the forecast period.

Which product segment is growing the fastest in the spice oils and oleoresins market?

The oleoresins segment is projected to grow at the fastest pace, driven by high solubility, extended shelf life, and increasing demand in industrial food processing and nutraceutical applications.

Which application segment contributes most to the growth of the spice oils and oleoresins market?

The dietary supplements segment is expected to grow the fastest, driven by the rising consumer demand for wellness products, particularly in vitamins, minerals, and plant-based compounds.

What are the major factors driving demand for spice oils and oleoresins globally?

Key drivers include rising consumer demand for natural flavors, clean-label formulations, and functional food ingredients, as well as growing awareness of health and wellness.

Who are the leading players in the global spice oils and oleoresins market?

Top companies include Synthite Industries Ltd., Kalsec Inc., McCormick & Company, Ozone Naturals Pvt. Ltd., and AVT Natural Products Ltd., offering premium spice oils and oleoresins solutions globally.

Explore Similar Insights

Future Market Insights

Spice Oils and Oleoresins Market

Chat With MaRIA

Chat With

MaRIA

Hi There, I am MaRIA, Your Market Research Intelligence Assistant. How may I help you?