Spectrophotometers Market Overview (2022-2032)

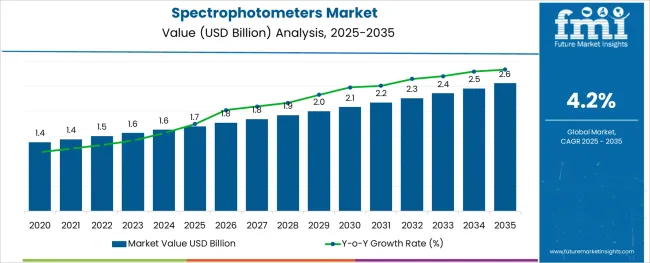
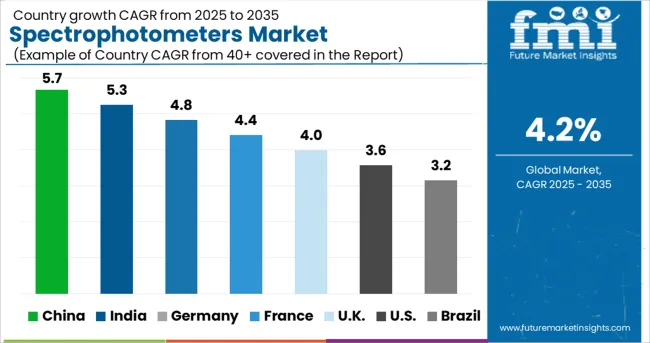
[250 Pages Report] The spectrophotometers market is predicted to witness a CAGR of 4.2% during the forecast period 2022-2032.

Sales of spectrophotometers are expected to witness a huge surge as spectrometry plays a crucial role in the chemical analytical industry and life sciences, which is the need of the hour.

In addition, the demand for spectrophotometers is also on the surge as it has a wide range of applications such as pharmaceutical applications, Food and beverages testing, Biotechnological Testing.

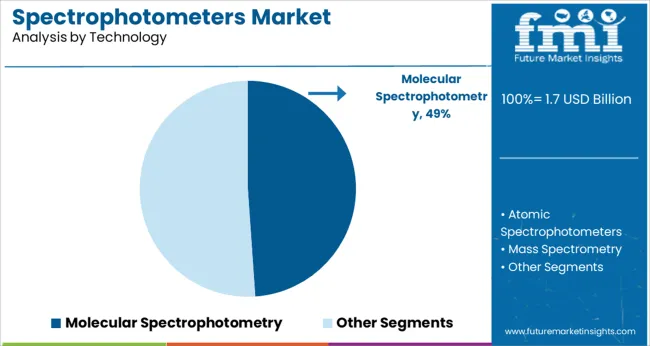
Mass spectrometry plays a pivotal role in the drug discovery and determining unknown compounds isotopic composition of elements in a molecule. The same is anticipated to surge the sales of spectrophotometers.

Advances in spectroscopy, disease markers, toxicology, and an increase in the number of chronic diseases are expected to aid the demand for spectrophotometers.

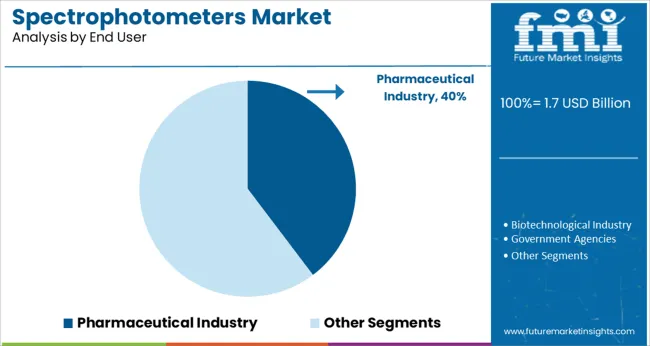
R&D in the pharmaceutical and biotechnological sectors is also a significant catalyst to the sales of spectrophotometers and the demand for spectrophotometers.

Development in spectrometry applications such as environmental and space applications such as understanding the solar system and assisting in the safe landing of a man in space is propelling the sales of spectrophotometers.

Demand for spectrophotometers peaks as many clinical chemistry procedures have been designed with a color end product in mind. A photometer can detect and measure this type of light accurately.

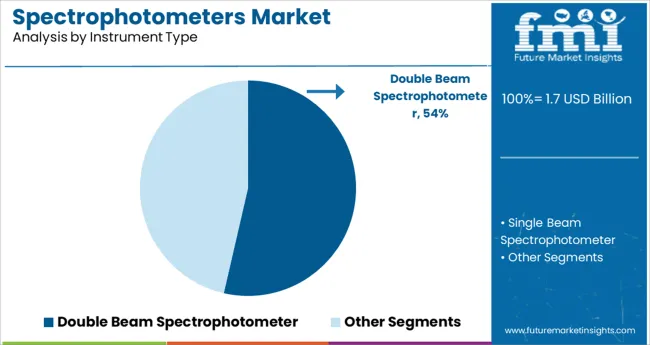
Higher sales of spectrophotometers can also be attributed to the growing popularity of double-beam spectrometers. It employs two light beams, one as a reference beam and a sampling beam that traverses the sample.

The main advantage associated with the double beam spectrometer is that they are highly stable since the reference and sample are measured simultaneously, and the same spikes the demand for spectrophotometers.

Don't pay for what you don't need

Customize your report by selecting specific countries or regions and save 30%!

What are the Key Dynamics in the Spectrophotometers Market?

Spectrophotometry has been used in the majority of laboratories for the detection of chemicals. Hence, fuelling the demand for spectrophotometers.

Sales of spectrophotometers are being boosted by increasing demand for drug discovery and development and biomolecular analysis from the life science industry.

Increasing applications of spectrometry devices in toxicology, proteomics, and disease marker contribute to the growing demand for spectrophotometers around the globe.

Demand for spectrophotometers dwindles as they are costly, and the lack of skilled professionals is the restraint of the spectrophotometers market.

Concerns about the proper usage of sphere spectrophotometers are one of the elements predicted to act as a barrier to sales of spectrophotometers in the near future.
Sabyasachi Ghosh
Sabyasachi Ghosh

Principal Consultant

Talk to Analyst

Find your sweet spots for generating winning opportunities in this market.

Which Region is Leading the Spectrophotometers Market?

Advanced regions like North America and Europe hold a high spectrophotometers market share due to significant spending power.

North America is expected to maintain its dominant position in demand for spectrophotometers. It exhibits significant growth in the spectrometers market, owing to the increased launch of novel products in the region by key players.

Technological advancement and widening applications in various segments will also contribute to the higher demand for spectrophotometers in the region.

According to a survey conducted by the European Union (EU) R&D scoreboard, investments in overall R&D in Europe, including the healthcare sector, increased significantly, which is expected to spike the sales of spectrophotometers.

Asia Pacific countries are anticipated to witness a huge growth in the sales of spectrophotometers rate in the spectrophotometers market.
Who are a Few Key Players in the Spectrophotometers Market?

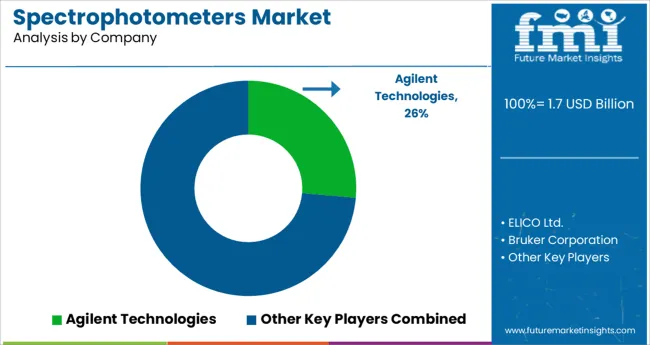
Some of the key players in the spectrophotometers market are Agilent Technologies, Bruker Corporation, Perkin Elmer, Inc., ThermoFisher Scientific, Inc., Danher, Inc. Water Corporation, Shimadzu Corporation, Bio-Rad Corporation, and others.

Key players have been adopting various strategies such as mergers & acquisitions, collaborations, partnerships, and product launches to consolidate their position in the market by enlarging their spectrophotometers market share.

  • Based in the United States, Thermo Fisher Scientific has introduced the TSQ 9000 Triple Quadrupole GC-MS/MS System. This system increases productivity while reducing maintenance-related downtime by 98 percent.
  • Jenway, a company based in the UK, introduced the new Genova bio life science spectrophotometer. It is used in life science applications such as determining the concentration and purity of DNA, RNA, etc.

Get the data you need at a Fraction of the cost

Personalize your report by choosing insights you need
and save 40%!

Scope of Report

Report Attributes Details
Growth rate CAGR of 4.2% from 2022 to 2032
Base year for estimation 2021
Historical data 2015 to 2020
Forecast period 2022 to 2032
Quantitative units Revenue in US$ million, volume in kilotons, and CAGR from 2022 to 2032
Report coverage Revenue forecast, volume forecast, company ranking, competitive landscape, growth factors, and trends, Pricing Analysis,
Segments covered Type, Application, Region
Regional scope North America; Western Europe; Eastern Europe; Middle East; Africa; ASEAN; South Asia; Rest of Asia
Country scope USA, Canada, Mexico, Germany, UK, France, Italy, Spain, Russia, Belgium, Poland, Czech Republic, China, India, Japan, Australia, Brazil, Argentina, Colombia, Saudi Arabia, UAE, Iran, South Africa
Key companies profiled Agilent Technologies; Bruker Corporation; Perkin Elmer, Inc.; ThermoFisher Scientific, Inc.; Danher, Inc. Water Corporation; Shimadzu Corporation; Bio Rad Corporation; others
Customization scope Free report customization (equivalent to up to 8 analysts working days) with purchase. Addition or alteration to country, regional & segment scope.
Pricing and purchase options Avail customized purchase options to meet your exact research needs.?

Key Segments

By Type:

  • UV-Visible Spectrometry
  • IR- Spectrometry
  • Nuclear Magnetic Resonance (NMR)
  • Near Infrared Spectrometry
  • Raman Spectrometry

By Application:

  • Pharmaceutical Application
  • Biotechnological Applications
  • Industrial Applications
  • Space Applications
  • Environmental Applications

By Region:

  • North America
  • Latin America
  • Asia Pacific
  • MEA
  • Europe

Frequently Asked Questions

What is the Growth Outlook of the Spectrophotometers Market?

The spectrophotometers market is anticipated to register a CAGR of 4.2% during the forecast period.

What is the Main Growth Propeller of the Spectrophotometers Market?

Increasing the range of new product launches is a key propeller of the spectrophotometers market growth.

Which Segment Holds the Highest Spectrophotometers Market Share?

In the spectrophotometers market, the life science segment is expected to hold the largest market share.

Table of Content

1. Executive Summary

    1.1. Global Market Outlook

    1.2. Demand-side Trends

    1.3. Supply-side Trends

    1.4. Technology Roadmap Analysis

    1.5. Analysis and Recommendations

2. Market Overview

    2.1. Market Coverage / Taxonomy

    2.2. Market Definition / Scope / Limitations

3. Market Background

    3.1. Market Dynamics

        3.1.1. Drivers

        3.1.2. Restraints

        3.1.3. Opportunity

        3.1.4. Trends

    3.2. Scenario Forecast

        3.2.1. Demand in Optimistic Scenario

        3.2.2. Demand in Likely Scenario

        3.2.3. Demand in Conservative Scenario

    3.3. Opportunity Map Analysis

    3.4. Product Life Cycle Analysis

    3.5. Supply Chain Analysis

        3.5.1. Supply Side Participants and their Roles

            3.5.1.1. Producers

            3.5.1.2. Mid-Level Participants (Traders/ Agents/ Brokers)

            3.5.1.3. Wholesalers and Distributors

        3.5.2. Value Added and Value Created at Node in the Supply Chain

        3.5.3. List of Raw Material Suppliers

        3.5.4. List of Existing and Potential Buyer’s

    3.6. Investment Feasibility Matrix

    3.7. Value Chain Analysis

        3.7.1. Profit Margin Analysis

        3.7.2. Wholesalers and Distributors

        3.7.3. Retailers

    3.8. PESTLE and Porter’s Analysis

    3.9. Regulatory Landscape

        3.9.1. By Key Regions

        3.9.2. By Key Countries

    3.10. Regional Parent Market Outlook

    3.11. Production and Consumption Statistics

    3.12. Import and Export Statistics

4. Global Spectrophotometers Market Analysis 2017-2021 and Forecast, 2022-2032

    4.1. Historical Market Size Value (US$ Mn) & Volume (Units) Analysis, 2017-2021

    4.2. Current and Future Market Size Value (US$ Mn) & Volume (Units) Projections, 2022-2032

        4.2.1. Y-o-Y Growth Trend Analysis

        4.2.2. Absolute $ Opportunity Analysis

5. Global Spectrophotometers Market Analysis 2017-2021 and Forecast 2022-2032, By Instrument Type

    5.1. Introduction / Key Findings

    5.2. Historical Market Size Value (US$ Mn) & Volume (Units) Analysis By Instrument Type, 2017-2021

    5.3. Current and Future Market Size Value (US$ Mn) & Volume (Units) Analysis and Forecast By Instrument Type, 2022-2032

        5.3.1. Single Beam Spectrophotometer

        5.3.2. Double Beam Spectrophotometer

    5.4. Y-o-Y Growth Trend Analysis By Instrument Type, 2017-2021

    5.5. Absolute $ Opportunity Analysis By Instrument Type, 2022-2032

Deep-dive segmentation will be available in the sample on request

6. Global Spectrophotometers Market Analysis 2017-2021 and Forecast 2022-2032, By Technology

    6.1. Introduction / Key Findings

    6.2. Historical Market Size Value (US$ Mn) & Volume (Units) Analysis By Technology, 2017-2021

    6.3. Current and Future Market Size Value (US$ Mn) & Volume (Units) Analysis and Forecast By Technology, 2022-2032

        6.3.1. Molecular Spectrophotometry

        6.3.2. Atomic Spectrophotometers

        6.3.3. Mass Spectrometry

    6.4. Y-o-Y Growth Trend Analysis By Technology, 2017-2021

    6.5. Absolute $ Opportunity Analysis By Technology, 2022-2032

Deep-dive segmentation will be available in the sample on request

7. Global Spectrophotometers Market Analysis 2017-2021 and Forecast 2022-2032, By End User

    7.1. Introduction / Key Findings

    7.2. Historical Market Size Value (US$ Mn) & Volume (Units) Analysis By End User, 2017-2021

    7.3. Current and Future Market Size Value (US$ Mn) & Volume (Units) Analysis and Forecast By End User, 2022-2032

        7.3.1. Pharmaceutical Industry

        7.3.2. Biotechnological Industry

        7.3.3. Government Agencies

        7.3.4. Academic & Research Institutes

        7.3.5. Healthcare Industry

        7.3.6. Chemical & Petrochemical Industry

        7.3.7. Others

    7.4. Y-o-Y Growth Trend Analysis By End User, 2017-2021

    7.5. Absolute $ Opportunity Analysis By End User, 2022-2032

Deep-dive segmentation will be available in the sample on request

8. Global Spectrophotometers Market Analysis 2017-2021 and Forecast 2022-2032, By Region

    8.1. Introduction

    8.2. Historical Market Size Value (US$ Mn) & Volume (Units) Analysis By Region, 2017-2021

    8.3. Current Market Size Value (US$ Mn) & Volume (Units) Analysis and Forecast By Region, 2022-2032

        8.3.1. North America

        8.3.2. Latin America

        8.3.3. Europe

        8.3.4. East Asia

        8.3.5. South Asia & Pacific

        8.3.6. MEA

    8.4. Market Attractiveness Analysis By Region

9. North America Spectrophotometers Market Analysis 2017-2021 and Forecast 2022-2032, By Country

    9.1. Historical Market Size Value (US$ Mn) & Volume (Units) Trend Analysis By Market Taxonomy, 2017-2021

    9.2. Market Size Value (US$ Mn) & Volume (Units) Forecast By Market Taxonomy, 2022-2032

        9.2.1. By Country

            9.2.1.1. U.S.

            9.2.1.2. Canada

        9.2.2. By Instrument Type

        9.2.3. By Technology

        9.2.4. By End User

    9.3. Market Attractiveness Analysis

        9.3.1. By Country

        9.3.2. By Instrument Type

        9.3.3. By Technology

        9.3.4. By End User

    9.4. Key Takeaways

10. Latin America Spectrophotometers Market Analysis 2017-2021 and Forecast 2022-2032, By Country

    10.1. Historical Market Size Value (US$ Mn) & Volume (Units) Trend Analysis By Market Taxonomy, 2017-2021

    10.2. Market Size Value (US$ Mn) & Volume (Units) Forecast By Market Taxonomy, 2022-2032

        10.2.1. By Country

            10.2.1.1. Brazil

            10.2.1.2. Mexico

            10.2.1.3. Rest of Latin America

        10.2.2. By Instrument Type

        10.2.3. By Technology

        10.2.4. By End User

    10.3. Market Attractiveness Analysis

        10.3.1. By Country

        10.3.2. By Instrument Type

        10.3.3. By Technology

        10.3.4. By End User

    10.4. Key Takeaways

11. Europe Spectrophotometers Market Analysis 2017-2021 and Forecast 2022-2032, By Country

    11.1. Historical Market Size Value (US$ Mn) & Volume (Units) Trend Analysis By Market Taxonomy, 2017-2021

    11.2. Market Size Value (US$ Mn) & Volume (Units) Forecast By Market Taxonomy, 2022-2032

        11.2.1. By Country

            11.2.1.1. Germany

            11.2.1.2. U.K.

            11.2.1.3. France

            11.2.1.4. Spain

            11.2.1.5. Italy

            11.2.1.6. Rest of Europe

        11.2.2. By Instrument Type

        11.2.3. By Technology

        11.2.4. By End User

    11.3. Market Attractiveness Analysis

        11.3.1. By Country

        11.3.2. By Instrument Type

        11.3.3. By Technology

        11.3.4. By End User

    11.4. Key Takeaways

12. East Asia Spectrophotometers Market Analysis 2017-2021 and Forecast 2022-2032, By Country

    12.1. Historical Market Size Value (US$ Mn) & Volume (Units) Trend Analysis By Market Taxonomy, 2017-2021

    12.2. Market Size Value (US$ Mn) & Volume (Units) Forecast By Market Taxonomy, 2022-2032

        12.2.1. By Country

            12.2.1.1. China

            12.2.1.2. Japan

            12.2.1.3. South Korea

        12.2.2. By Instrument Type

        12.2.3. By Technology

        12.2.4. By End User

    12.3. Market Attractiveness Analysis

        12.3.1. By Country

        12.3.2. By Instrument Type

        12.3.3. By Technology

        12.3.4. By End User

    12.4. Key Takeaways

13. South Asia & Pacific Spectrophotometers Market Analysis 2017-2021 and Forecast 2022-2032, By Country

    13.1. Historical Market Size Value (US$ Mn) & Volume (Units) Trend Analysis By Market Taxonomy, 2017-2021

    13.2. Market Size Value (US$ Mn) & Volume (Units) Forecast By Market Taxonomy, 2022-2032

        13.2.1. By Country

            13.2.1.1. India

            13.2.1.2. Thailand

            13.2.1.3. Indonesia

            13.2.1.4. Malaysia

            13.2.1.5. Singapore

            13.2.1.6. Australia

            13.2.1.7. New Zealand

            13.2.1.8. Rest of South Asia & Pacific

        13.2.2. By Instrument Type

        13.2.3. By Technology

        13.2.4. By End User

    13.3. Market Attractiveness Analysis

        13.3.1. By Country

        13.3.2. By Instrument Type

        13.3.3. By Technology

        13.3.4. By End User

    13.4. Key Takeaways

14. MEA Spectrophotometers Market Analysis 2017-2021 and Forecast 2022-2032, By Country

    14.1. Historical Market Size Value (US$ Mn) & Volume (Units) Trend Analysis By Market Taxonomy, 2017-2021

    14.2. Market Size Value (US$ Mn) & Volume (Units) Forecast By Market Taxonomy, 2022-2032

        14.2.1. By Country

            14.2.1.1. GCC Countries

            14.2.1.2. South Africa

            14.2.1.3. Israel

            14.2.1.4. Rest of MEA

        14.2.2. By Instrument Type

        14.2.3. By Technology

        14.2.4. By End User

    14.3. Market Attractiveness Analysis

        14.3.1. By Country

        14.3.2. By Instrument Type

        14.3.3. By Technology

        14.3.4. By End User

    14.4. Key Takeaways

15. Key Countries Spectrophotometers Market Analysis

    15.1. U.S.

        15.1.1. Pricing Analysis

        15.1.2. Market Share Analysis, 2021

            15.1.2.1. By Instrument Type

            15.1.2.2. By Technology

            15.1.2.3. By End User

    15.2. Canada

        15.2.1. Pricing Analysis

        15.2.2. Market Share Analysis, 2021

            15.2.2.1. By Instrument Type

            15.2.2.2. By Technology

            15.2.2.3. By End User

    15.3. Brazil

        15.3.1. Pricing Analysis

        15.3.2. Market Share Analysis, 2021

            15.3.2.1. By Instrument Type

            15.3.2.2. By Technology

            15.3.2.3. By End User

    15.4. Mexico

        15.4.1. Pricing Analysis

        15.4.2. Market Share Analysis, 2021

            15.4.2.1. By Instrument Type

            15.4.2.2. By Technology

            15.4.2.3. By End User

    15.5. Germany

        15.5.1. Pricing Analysis

        15.5.2. Market Share Analysis, 2021

            15.5.2.1. By Instrument Type

            15.5.2.2. By Technology

            15.5.2.3. By End User

    15.6. U.K.

        15.6.1. Pricing Analysis

        15.6.2. Market Share Analysis, 2021

            15.6.2.1. By Instrument Type

            15.6.2.2. By Technology

            15.6.2.3. By End User

    15.7. France

        15.7.1. Pricing Analysis

        15.7.2. Market Share Analysis, 2021

            15.7.2.1. By Instrument Type

            15.7.2.2. By Technology

            15.7.2.3. By End User

    15.8. Spain

        15.8.1. Pricing Analysis

        15.8.2. Market Share Analysis, 2021

            15.8.2.1. By Instrument Type

            15.8.2.2. By Technology

            15.8.2.3. By End User

    15.9. Italy

        15.9.1. Pricing Analysis

        15.9.2. Market Share Analysis, 2021

            15.9.2.1. By Instrument Type

            15.9.2.2. By Technology

            15.9.2.3. By End User

    15.10. China

        15.10.1. Pricing Analysis

        15.10.2. Market Share Analysis, 2021

            15.10.2.1. By Instrument Type

            15.10.2.2. By Technology

            15.10.2.3. By End User

    15.11. Japan

        15.11.1. Pricing Analysis

        15.11.2. Market Share Analysis, 2021

            15.11.2.1. By Instrument Type

            15.11.2.2. By Technology

            15.11.2.3. By End User

    15.12. South Korea

        15.12.1. Pricing Analysis

        15.12.2. Market Share Analysis, 2021

            15.12.2.1. By Instrument Type

            15.12.2.2. By Technology

            15.12.2.3. By End User

    15.13. India

        15.13.1. Pricing Analysis

        15.13.2. Market Share Analysis, 2021

            15.13.2.1. By Instrument Type

            15.13.2.2. By Technology

            15.13.2.3. By End User

    15.14. Thailand

        15.14.1. Pricing Analysis

        15.14.2. Market Share Analysis, 2021

            15.14.2.1. By Instrument Type

            15.14.2.2. By Technology

            15.14.2.3. By End User

    15.15. Indonesia

        15.15.1. Pricing Analysis

        15.15.2. Market Share Analysis, 2021

            15.15.2.1. By Instrument Type

            15.15.2.2. By Technology

            15.15.2.3. By End User

    15.16. Malaysia

        15.16.1. Pricing Analysis

        15.16.2. Market Share Analysis, 2021

            15.16.2.1. By Instrument Type

            15.16.2.2. By Technology

            15.16.2.3. By End User

    15.17. Singapore

        15.17.1. Pricing Analysis

        15.17.2. Market Share Analysis, 2021

            15.17.2.1. By Instrument Type

            15.17.2.2. By Technology

            15.17.2.3. By End User

    15.18. Australia

        15.18.1. Pricing Analysis

        15.18.2. Market Share Analysis, 2021

            15.18.2.1. By Instrument Type

            15.18.2.2. By Technology

            15.18.2.3. By End User

    15.19. New Zealand

        15.19.1. Pricing Analysis

        15.19.2. Market Share Analysis, 2021

            15.19.2.1. By Instrument Type

            15.19.2.2. By Technology

            15.19.2.3. By End User

    15.20. GCC Countries

        15.20.1. Pricing Analysis

        15.20.2. Market Share Analysis, 2021

            15.20.2.1. By Instrument Type

            15.20.2.2. By Technology

            15.20.2.3. By End User

    15.21. South Africa

        15.21.1. Pricing Analysis

        15.21.2. Market Share Analysis, 2021

            15.21.2.1. By Instrument Type

            15.21.2.2. By Technology

            15.21.2.3. By End User

    15.22. Israel

        15.22.1. Pricing Analysis

        15.22.2. Market Share Analysis, 2021

            15.22.2.1. By Instrument Type

            15.22.2.2. By Technology

            15.22.2.3. By End User

16. Market Structure Analysis

    16.1. Competition Dashboard

    16.2. Competition Benchmarking

    16.3. Market Share Analysis of Top Players

        16.3.1. By Regional

        16.3.2. By Instrument Type

        16.3.3. By Technology

        16.3.4. By End User

17. Competition Analysis

    17.1. Competition Deep Dive

        17.1.1. ELICO Ltd.

            17.1.1.1. Overview

            17.1.1.2. Product Portfolio

            17.1.1.3. Profitability by Market Segments

            17.1.1.4. Sales Footprint

            17.1.1.5. Strategy Overview

                17.1.1.5.1. Marketing Strategy

                17.1.1.5.2. Product Strategy

                17.1.1.5.3. Channel Strategy

        17.1.2. Agilent Technologies

            17.1.2.1. Overview

            17.1.2.2. Product Portfolio

            17.1.2.3. Profitability by Market Segments

            17.1.2.4. Sales Footprint

            17.1.2.5. Strategy Overview

                17.1.2.5.1. Marketing Strategy

                17.1.2.5.2. Product Strategy

                17.1.2.5.3. Channel Strategy

        17.1.3. Bruker Corporation

            17.1.3.1. Overview

            17.1.3.2. Product Portfolio

            17.1.3.3. Profitability by Market Segments

            17.1.3.4. Sales Footprint

            17.1.3.5. Strategy Overview

                17.1.3.5.1. Marketing Strategy

                17.1.3.5.2. Product Strategy

                17.1.3.5.3. Channel Strategy

        17.1.4. Perkin Elmer, Inc.

            17.1.4.1. Overview

            17.1.4.2. Product Portfolio

            17.1.4.3. Profitability by Market Segments

            17.1.4.4. Sales Footprint

            17.1.4.5. Strategy Overview

                17.1.4.5.1. Marketing Strategy

                17.1.4.5.2. Product Strategy

                17.1.4.5.3. Channel Strategy

        17.1.5. Thermo Fisher Scientific Inc.

            17.1.5.1. Overview

            17.1.5.2. Product Portfolio

            17.1.5.3. Profitability by Market Segments

            17.1.5.4. Sales Footprint

            17.1.5.5. Strategy Overview

                17.1.5.5.1. Marketing Strategy

                17.1.5.5.2. Product Strategy

                17.1.5.5.3. Channel Strategy

        17.1.6. GE Healthcare

            17.1.6.1. Overview

            17.1.6.2. Product Portfolio

            17.1.6.3. Profitability by Market Segments

            17.1.6.4. Sales Footprint

            17.1.6.5. Strategy Overview

                17.1.6.5.1. Marketing Strategy

                17.1.6.5.2. Product Strategy

                17.1.6.5.3. Channel Strategy

        17.1.7. Shimadzu Scientific Instruments

            17.1.7.1. Overview

            17.1.7.2. Product Portfolio

            17.1.7.3. Profitability by Market Segments

            17.1.7.4. Sales Footprint

            17.1.7.5. Strategy Overview

                17.1.7.5.1. Marketing Strategy

                17.1.7.5.2. Product Strategy

                17.1.7.5.3. Channel Strategy

18. Assumptions & Acronyms Used

19. Research Methodology

Explore Healthcare Insights

View Reports
Future Market Insights

Spectrophotometers Market

Schedule a Call