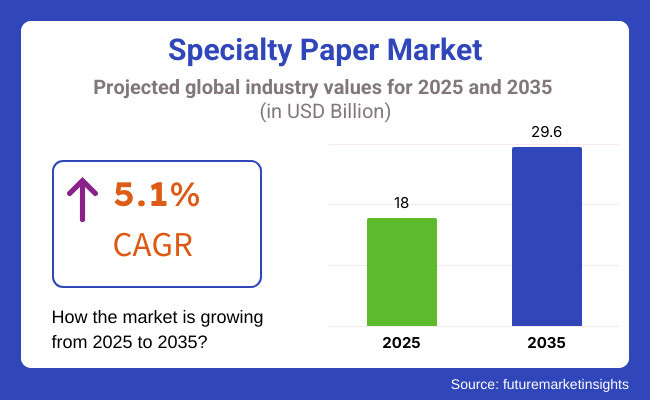
The specialty paper market is anticipated to reach USD 18.0 billion in 2025. It is expected to grow at a CAGR of 5.1% during the forecast period and reach a value of USD 29.6 billion in 2035. The specialty paper industry is witnessing consistent growth as a result of growing demand from different sectors, including packaging, printing, labeling, and healthcare.
Specialty papers are designed for particular purposes, providing additional properties like water resistance, grease resistance, high durability, and better printability. The increasing demand for eco-friendly and recyclable paper products is likely to propel market growth in the next decade.

Advances in pulp processing, better paper coating technologies, and automation in specialty paper production also propel the development of the market. Increased investment in AI-based quality control systems is also giving another boost to the growing business of digital printing. The active application of intelligent packaging advancements, which RFID-based paper labels, among many others, is giving rise to improved logistics effectiveness and enhanced brand interaction.
Explore FMI!
Book a free demo
| 2020 to 2024 Trends | 2025 to 2035 Projections |
|---|---|
| Early emphasis on plastic waste reduction. | Tighter international regulations requiring sustainable specialty paper solutions. |
| Biodegradable coatings development. | Growth of AI-based, interactive, and high-barrier paper technologies. |
| Extensively applied in packaging and labeling. | Growing use in security printing, healthcare, and luxury packaging. |
| Controlled by large paper producers. | Emergence of innovative specialty paper start-ups and environment-oriented paper companies. |
| Driven by e-commerce packaging requirements. | Market growth driven by automation, AI adoption, and intelligent packaging solutions. |
| Early adoption of recyclable and compostable papers. | Mass-scale shift to biodegradable, high-performance, and multifunctional papers. |
| Limited application of AI in paper production. | Predictive analytics-based AI, automated manufacturing, and interactive paper solutions. |
| Simple advancements in barrier coatings. | Incorporation of RFID-enabled labels, digital printing innovations, and smart papers. |
Between 2020 and 2024, the market experienced steady growth, driven by rising demand from the packaging and printing industries. However, manufacturers faced challenges such as supply chain disruptions and fluctuating raw material costs. Increased investments in research aimed to enhance durability, recyclability, and print compatibility, ensuring better performance and sustainability. Growing concerns over plastic waste led regulatory bodies to promote the adoption of bio-based and compostable alternatives. Moreover, advancements in automation improved production efficiency, reducing material waste and energy consumption.
In the upcoming years, market expansion will be fueled by innovations in high-strength and multifunctional materials, AI-driven production optimization, and the rise of smart labeling solutions. AI integration in predictive material analysis and customized formulations will enhance competitiveness. Furthermore, increasing demand for premium branding, luxury packaging, and food safety applications will create new opportunities. Companies are also prioritizing improvements in moisture resistance, print quality, and fiber sustainability. The adoption of interactive materials with embedded QR codes and NFC technology is expected to gain traction in the coming years.
| Challenges | Opportunities |
|---|---|
| Fluctuations in Raw Material Costs:The rising prices of wood pulp and sustainable fibers are significantly affecting production costs. Market volatility-driven by supply chain disruptions, deforestation regulations, and growing demand for eco-friendly materials-impacts profitability. Manufacturers are increasingly exploring alternative fiber sources and adopting more efficient production techniques to mitigate these challenges. | Expansion in Sustainable and High-Barrier Materials:The growing demand for eco-friendly packaging and printing solutions is fueling innovation in high-barrier paper alternatives. Companies are actively developing recyclable, compostable, and biodegradable materials to replace plastic-based options. Advanced coatings and multi-layered technologies are particularly gaining traction in the food, beverage, and pharmaceutical sectors. |
| Regulatory Compliance and Environmental Concerns:Strict environmental regulations are driving companies to invest in sustainable practices. Compliance with waste reduction policies and sustainability standards necessitates ongoing innovation in material sourcing and production processes. Businesses that invest in eco-friendly coatings, plastic-free alternatives, and energy-efficient manufacturing are finding themselves at a competitive advantage in the evolving market. | Advancements in Smart and Interactive Packaging Technologies:Technological progress is opening new avenues in packaging, such as RFID-enabled labels, thermal-sensitive materials, and moisture-resistant coatings. These innovations not only enhance security and traceability but also boost user engagement. Research in interactive and intelligent solutions is accelerating, setting the stage for connected packaging and next-generation printing applications. |
The packaging, printing, and labeling industries are major growth drivers as businesses seek eco-friendly, durable, and high-barrier alternatives to plastic. Manufacturers are enhancing material strength, printability, and moisture resistance to meet industry demands. Companies are also focusing on extending product longevity by developing water-resistant, greaseproof, and biodegradable alternatives. Additionally, advancements in tamper-proof security papers, thermal printing, and RFID-integrated labeling are improving functionality and regulatory compliance.
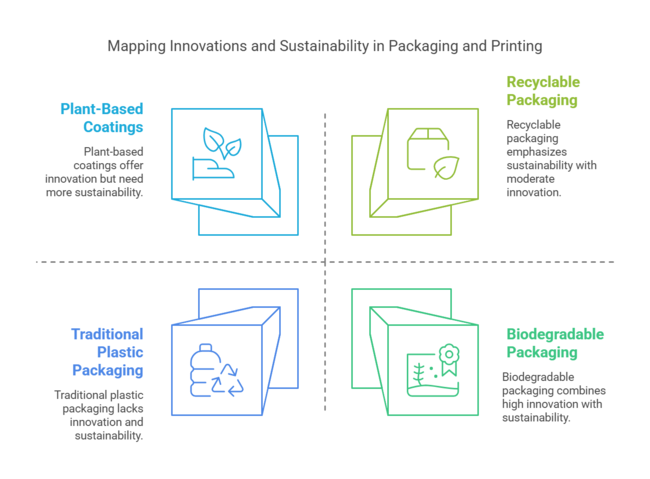
The packaging industry continues to be a dominant force, with businesses seeking sustainable solutions for food wraps, luxury packaging, and paper-based pouches. Companies are developing highly durable and recyclable materials with advanced coatings to maintain freshness and extend shelf life. The integration of compostable, lightweight, and high-barrier paper packaging is further strengthening sustainability efforts. Businesses are also researching plant-based coatings and plastic-free laminates to enhance recyclability.

With increasing use in food wrapping, flexible packaging, and premium branding, sustainable materials are gaining popularity. These solutions offer superior print quality, barrier protection, and recyclability compared to conventional alternatives.
Market trends indicate a shift toward biodegradable and compostable materials, where innovative solutions enhance durability and reduce environmental impact. Studies show that over 75% of premium packaging companies prefer FSC-certified or recycled paper-based solutions due to their alignment with sustainability regulations and consumer preferences.
The adoption of sustainable packaging in security printing, healthcare, and industrial applications has further expanded market opportunities. As businesses focus on improving sustainability and packaging efficiency, grease-resistant paper, high-gloss coatings, and AI-driven print technologies are becoming increasingly popular.
Despite advantages such as enhanced barrier protection and aesthetic appeal, the market faces challenges such as fluctuating raw material costs, limited recyclability of certain coatings, and regulatory compliance issues. However, developments in plant-based coatings, nanotechnology enhancements, and AI-driven quality control systems are driving innovations that enhance product performance and sustainability.
The market is driven by diverse product types, each serving unique applications. Décor paper enhances furniture and laminates, offering durability and aesthetic appeal. Thermal and carbonless papers are essential for receipts, tickets, and business forms, ensuring efficient, ink-free printing in retail and banking.
Kraft paper dominates packaging and industrial use, valued for its strength and recyclability. Other specialty papers cater to customized needs, ensuring high performance and sustainability. Their versatility across industries makes them indispensable in modern packaging, printing, and design applications.
Asia-Pacific is projected to emerge at the forefront of the market along with rapid industrialization, a growing packaging sector, and stringent regulations advocating for sustainable materials. Also, countries are very much in demand for packaging, labeling and printing in food packaging- China, India, and Japan. Biodegradable coatings, moisture-resistant materials, and digital printing technologies are seen to further enhance the growth of the market in the region.
Government policies driving sustainability and waste reduction cause manufacturers to invest in recyclable and compostable alternatives. There are also multinationals completing their integration in Asia-Pacific that will boost local capacities in production packaging and printing. Research and development into smart applications provide prospects in areas such as heat-sensitive and antimicrobial materials.
North America continues to be an important market for food packaging, healthcare, and security printing, with the USA and Canada at the forefront of innovation in high-barrier coatings, digital printing solutions, and moisture-barrier packaging. This is driven by investment in automated manufacturing and AI-driven materials optimization, which will improve efficiency and reduce waste. Legislation is looking at sustainability, and governments are creating laws to promote alternatives to environmentally harmful materials, while corporations are launching initiatives to shift toward recyclable and compostable materials.
R&D efforts are directed toward grease-resistant, tamper-resistant, and light-weight solutions that meet changing consumer and industry needs. Increased demand for value-added packaging and luxury branding are driving the requirement for premium quality printing substrates. Finally, many companies in North America have also worked with smart labels using embedded RFID technology for tracking better inventory and supply chain efficiency. Innovation in new fiber-based barrier coatings and recyclable thermal materials is expected to further shape this market.
Europe holds a significant market share, driven by strict environmental regulations, the adoption of circular economy principles, and increasing demand for sustainable packaging solutions. Leading economies like Germany, France, and the UK are advancing in eco-friendly materials and biodegradable coatings. Investments in advanced pulp processing technologies are also improving manufacturing efficiency, while closed-loop recycling systems are accelerating the shift toward circular production practices.
Stringent policies promoting alternatives to plastic and responsible raw material sourcing are shaping the industry's future. Growing consumer awareness and demand for sustainable options in packaging, labeling, and medical applications are driving long-term market growth. Additionally, collaborations between manufacturers and sustainability-focused organizations are fostering innovation. Research institutions across Europe are developing next-generation materials with enhanced printability, moisture resistance, and security features, boosting adoption across multiple industries.

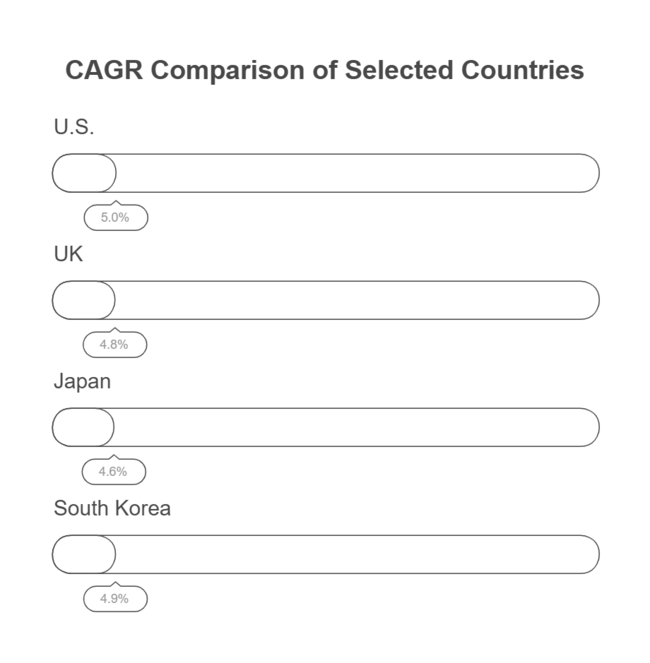
The USA dominates the market, driven by increasing demand for high-performance, sustainable, and customized paper solutions across industries such as packaging, printing, labeling, and security applications. The need for water-resistant, greaseproof, and recyclable materials has encouraged manufacturers to develop advanced coatings, lightweight structures, and biodegradable alternatives. Additionally, government regulations promoting plastic-free packaging and eco-friendly printing materials are pushing companies to adopt more sustainable solutions.
As per FMI estimation, advancements in high-strength fibers, anti-counterfeit security features, and moisture-resistant coatings are improving product functionality and durability. Businesses are also exploring smart technologies, such as RFID-enabled labels and thermosensitive coatings, to enhance security and traceability. Furthermore, the increasing adoption of eco-friendly materials in luxury packaging, food wraps, and industrial filtration is driving innovation in high-performance and environmentally responsible paper products.
The UK market is expanding as businesses prioritize sustainability, regulatory compliance, and innovative packaging and printing solutions. Rising demand for plastic-free, biodegradable, and high-barrier materials has led to increased adoption across multiple sectors, including food packaging, healthcare, and premium stationery. Government initiatives promoting circular economy practices and plastic reduction are making companies integrate compostable, fiber-based, and water-resistant solutions.
Furthermore, innovations in security papers, textured finishes, and moisture-proof coatings are making these products more attractive for high-value applications. Companies are also exploring customized branding and digital printing technologies to enhance aesthetics and functionality. The shift toward sustainable luxury packaging and eco-friendly label materials is further increasing demand for high-quality paper solutions in the UK market.
Japan is experiencing steady growth due to increasing demand for precision-engineered, high-quality, and technologically advanced materials in printing, electronics, and industrial applications. Companies are developing solutions with superior strength, heat resistance, and anti-static properties to meet Japan’s high-performance standards. Strict regulations on environmental sustainability and paper waste reduction are prompting businesses to transition toward recyclable, FSC-certified, and low-emission alternatives.
Progressions in thermal-sensitive coatings, conductive layers, and lightweight packaging materials are driving demand in applications requiring enhanced durability and efficiency. Businesses are also investing in automation-friendly production systems to improve efficiency and material conservation. Additionally, the rise of digital printing, smart labeling, and flexible electronics is fueling demand for high-performance solutions in Japan.
South Korea is seeing significant growth due to increased demand for eco-friendly, high-strength, and multi-functional materials in packaging, medical, and industrial applications. The need for greaseproof, anti-counterfeit, and food-safe solutions has led manufacturers to develop products with improved barrier coatings, biodegradable resins, and heat-sealable features. Government regulations promoting plastic-free alternatives and sustainable forestry further support market expansion.
Additionally, businesses are integrating digital tracking technologies such as QR-coded packaging and tamper-evident labels to enhance product authentication and brand engagement. The growing demand for decorative, embossed, and high-opacity materials in premium packaging and luxury branding is further boosting adoption. Moreover, research into flame-retardant, antimicrobial, and self-cleaning materials is helping businesses develop innovative solutions tailored to sustainability-conscious markets.
The industry is fragmented, with numerous players competing for market share. No single company dominates, allowing businesses to innovate and diversify their offerings. Companies develop high-performance materials to cater to applications such as packaging, labeling, and printing, ensuring they meet evolving industry demands and customer expectations across various sectors.
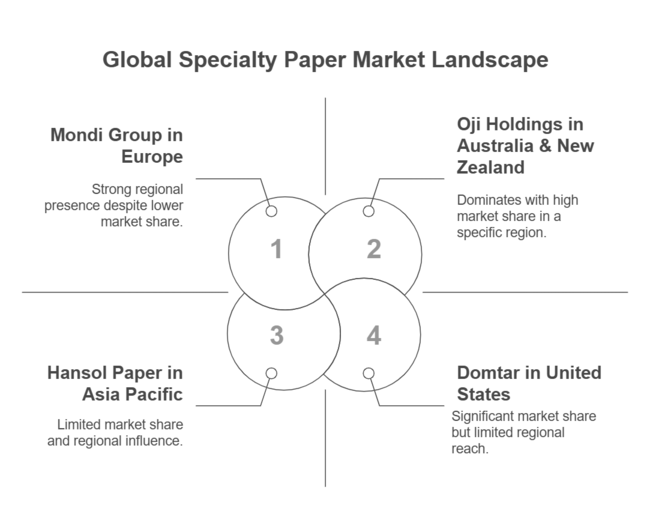
Leading manufacturers invest in research and development to enhance product quality and sustainability. Companies like Stora Enso, Nippon Paper, and Mondi focus on advanced manufacturing techniques to improve durability, printability, and eco-friendliness. Their commitment to innovation enables them to maintain strong positions while addressing the growing demand for sustainable and high-performance solutions.
Mid-sized firms differentiate themselves by offering tailored solutions for niche applications. Businesses such as ITC Limited and Domtar Corporation adapt quickly to industry trends, providing customized materials for food packaging, medical use, and industrial applications. Their agility allows them to compete effectively while catering to specific consumer needs with high-quality, specialized products.
Smaller manufacturers and emerging players emphasize eco-friendly materials and processes. They focus on biodegradable, recyclable, and compostable solutions to align with global sustainability efforts. By prioritizing green innovations, these companies attract environmentally conscious customers, helping drive the industry’s transition toward sustainable alternatives without compromising performance, durability, or printability in various applications.
Despite its fragmented nature, the industry continues to evolve through competition and innovation. Companies across all tiers invest in efficiency, material advancements, and regulatory compliance. As environmental concerns and consumer preferences shift, the industry embraces sustainable solutions, ensuring long-term growth while meeting global demand for high-quality, specialized materials.
The market is expanding due to increasing demand in packaging, printing, and labeling applications. Industries require high-performance materials that offer durability, print quality, and functional benefits. As businesses seek alternatives to traditional materials, innovative paper-based solutions are gaining popularity for their ability to enhance product presentation and improve sustainability.
Material innovations are shaping the market, with barrier-coated products, water-resistant laminates, and anti-counterfeit security features addressing performance and sustainability concerns. These advancements improve product protection, extend shelf life, and support environmentally friendly packaging. As regulations push for reduced plastic usage, paper-based alternatives are emerging as viable solutions across various industries.
Technological improvements in automated production and AI-driven quality control are optimizing manufacturing efficiency. Automation enhances consistency and reduces production costs, while AI-based inspection systems detect defects in real time. These advancements ensure high-quality output, allowing manufacturers to meet the growing demand for reliable and innovative paper solutions in competitive markets.
Sustainability remains a key focus, with companies investing in hybrid solutions that balance durability and recyclability. Collaborations between packaging manufacturers and paper mills are fostering customized products tailored to industry-specific needs. As eco-conscious consumer preferences grow, businesses are prioritizing innovative and environmentally responsible solutions to align with evolving market expectations.

United States (Specialty Paper)
Notes: Companies like International Paper/Georgia-Pacific focus more on bulk packaging (corrugated), not specialty niches.
Europe (Specialty Paper)
Shift: Sappi has a smaller presence here compared to Mondi/Stora Enso.
Asia Pacific (Specialty Paper)
Note: Chinese giants like Nine Dragons focus on bulk packaging, not specialty.
Australia & New Zealand (Specialty Paper)
Japan & South Korea (Specialty Paper)
The overall market size for the market is USD 18.0 billion in 2025.
The market is expected to reach USD 29.6 billion in 2035.
The market will be driven by increasing demand from packaging, printing, and labeling industries. Sustainability trends, innovations in biodegradable coatings, and improvements in fiber treatment technologies will further propel market expansion.
Key challenges include fluctuating raw material costs, limitations in recyclability for coated specialty papers, and compliance with stringent environmental regulations. However, advancements in plant-based coatings, improved recycling methods, and the integration of AI-driven quality control are helping to mitigate these challenges.
By product type the market is categorized into décor, thermal, carbonless, kraft, and others.
Based on the end use application, the market is segmented into printing & writing, packaging, building & construction, industrial, and other commercial end use.
The market is segmented by region into North America, Latin America, Western Europe, South Asia & Pacific, East Asia, Middle East, and Africa.
Nitrogen Flushing Machine Market Analysis by Automatic and Semi-Automatic Through 2035
Pan Liner Market Analysis by Polyethylene (PE), Nylon, Polypropylene, Polyester, Polytetrafluoroethylene (PTFE) and Biodegradable Plastics Through 2035
Perfume Filling Machine Market Analysis by Automatic Perfume Filling Machines and Manual Perfume Filling Machines Through 2035
Molded Pulp Packaging Machines Market Analysis - Growth & Forecast 2025 to 2035
Packaging Tensioner Market Analysis - Growth & Forecast 2025 to 2035
Packaging Films Market Analysis by Product Type, Material Type and End Use Through 2035

Thank you!
You will receive an email from our Business Development Manager. Please be sure to check your SPAM/JUNK folder too.